Stepwise capillary electrophoretic separation of DNA fragments
using poly(ethylene oxide) solutions in the presence of
electroosmotic flow
*
Hsuan-Shen Chen, Huan-Tsung Chang
Department of Chemistry, National Taiwan University, P.O. Box 23 –34, Roosevelt Road Sect. 4, No. 1, Taipei 10764, Taiwan
Abstract
Single-base resolution in the separation of DNA markers V and VI was achieved in the presence of electroosmotic flow (EOF), using poly(ethylene oxide) (PEO) solutions containing ethidium bromide (EtB) under isocratic conditions. Furthermore, a new approach called stepwise capillary electrophoresis (SCE) has been developed for DNA analysis, including stepwise changes in PEO concentration, EtB concentration as well as both PEO and EtB concentrations, wherein the EOF was used to introduce different PEO solutions into the capillary during the separation. DNA fragments smaller than 80 bp were both detected under isocratic conditions using 20 mg / ml EtB, and SCE using 1 and 20 mg / ml EtB, but not under isocratic conditions using 1 mg / ml EtB. Resolution and speed of the DNA separation in SCE were different from those obtained from isocratic means, indicating that DNA underwent different concentrations of PEO and EtB in SCE. For example, DNA fragments with 458 and 504 base pairs (bp) were partially resolved in SCE, but not under isocratic conditions. The results further suggest that it is worth developing gradient techniques for widening the separation range and enhancing resolution in DNA analysis. 1999 Elsevier Science B.V. All rights reserved.
Keywords: Buffer composition; Stepwise capillary electrophoresis; DNA; Poly(ethylene oxide); Ethidium bromide
1. Introduction (EtB), are commonly used for the DNA analysis in
CE with laser-induced fluorescence (LIF) detection
Capillary electrophoresis (CE) is a powerful meth- system [8]. It has been reported that the DNA chain
od for DNA analysis because of its high resolving becomes longer and stiffer, and the net charges of
power and extremely high speed [1–3]. Recently, the DNA fragments decrease after forming
complex-replaceable polymer solutions prepared from linear es with cationic intercalating dyes [9–11]. As a
polymers, such as linear polyacrylamide (LPA) [4], consequence, intercalated DNA migrates more
slow-cellulose [5], and poly(ethylene oxide) (PEO) [6], ly than pure DNA, and the band becomes narrower
have been commonly used for high-resolution DNA [12]. It has also been shown that the mobility and
analysis. It is noted that single-base resolution of fluorescence intensity of the intercalated DNA
de-DNA up to several hundred bases has been demon- pend on DNA / dye ratios, indicating that a better
strated using LPA solutions [7]. separation result might be achieved by carefully
Intercalating dyes, such as ethidium bromide choosing the species and concentration of cationic
intercalating dyes. Furthermore, gradient techniques with a capability of introducing different
concen-*Corresponding author.
E-mail address: [email protected] (H.-T. Chang) trations and / or species of the intercalating dyes
0021-9673 / 99 / $ – see front matter 1999 Elsevier Science B.V. All rights reserved. P I I : S 0 0 2 1 - 9 6 7 3 ( 9 9 ) 0 0 3 8 0 - 5
should be useful for enhancing efficiency in the In the presence of electroosmotic flow (EOF),
separation of DNA. filling capillaries with polymer solutions of varying
Techniques providing single-base resolution and pore sizes seems to be feasible. Recently, we took
high speed are important for detecting point muta- advantage of a relatively high EOF to introduce PEO
tions of DNA, PCR products, and DNA sequencing solutions into capillaries for high-resolution DNA
[13,14]. Up to date, the method with single-base separations without the need of filling polymer
resolution is only good for the separation of small solutions prior to separations [25,26]. One of the
DNA fragments because of the lack of a suitable advantages of performing this new method is that we
polymer solution for separating a wide size range of can regenerate fresh capillary surface each time, and
DNA. It has been suggested that the relative size thus a highly viscous polymer solution can be
between pores of polymer solution and DNA is an reproducibly introduced into a very small-size
capil-important factor in determining resolution [15]. Thus lary. This may be useful for high-resolution DNA
performing gradient techniques to induce the change separations, which is important in DNA sequencing
in DNA conformations and / or to introduce different and DNA diagnosis. In addition, it is possible to
pore-size polymer solutions into the capillary seems perform CPGGE for the analysis of DNA of varying
to be optimistic for extending the separation range in sizes using the EOF to introduce different polymer
the analysis of DNA. Gradient techniques, such as solutions into the capillary during the separation.
temperature [16] and voltage [17], have been demon- In this work, a new method with a capability of
strated in CE for detecting point mutations in the introducing different polymer solutions during DNA
analysis of small alterations in DNA sequence of analysis was demonstrated. Herein, the hypothesis
genomic materials. Slight changes in the mobilities that better results in the DNA separation can be
of DNA molecules, resulting from the changes in achieved in the presence of EOF in SCE using
DNA conformations, account for the high-resolution different PEO solutions was tested. Another
objec-result. Unfortunately, these methods are only suitable tive of this work is to examine the effects of the
for separating certain sizes of DNA fragments. On changes in EtB and PEO concentrations on speed
the other hand, capillary pore gradient gel electro- and resolution in the separation of DNA markers V
phoresis (CPGGE) is more useful for widening the and VI.
separation range, increasing resolution, and short-ening total separation time in the separation of DNA
[18,19]. However, such gradient techniques are 2. Materials and methods
difficult to perform in CE since capillaries are not
easily filled with different pore-size polymer solu- 2.1. Equipment
tions. Recently, polydispersed polymer solutions
prepared from different sizes of PEO have been used The basic design of the separation system has been
for the separation of DNA fragments ranging from previously described [20]. Briefly, a high-voltage
18 to 2176 bp in 30 min [20]. More recently, a power supply (Gamma High Voltage Research,
Or-sophisticated method has been used to prepare PA mond Beach, USA) was used to drive
electropho-gradient gel matrices for the separation of oligo- resis. The entire detection system was enclosed in a
saccharides and poly(Asp) in CE [21], indicating that black box with a HV interlock. High-voltage end of
this method might be useful for enhancing resolution the separation system was put in a home-made
in the analysis of DNA. However poor reproducibil- plexiglass box for safety. A 1.5-mW He–Ne laser
ity, bubble formation, and short lifetime of the with 543.6 nm output from Melles Griot (Irvine, CA,
capillary are common problems when PA is polymer- USA) was used for excitation. The light was
col-ized inside the capillary. In consequence, this tech- lected with a 103 objective (N.A.50.25). One RG
nique is not suitable for the high-throughput analysis 610 cutoff filter was used to block scattered light
of DNA using multiplexed systems because obtain- before the emitted light reaches the phototube
ing reproducible results from different capillaries is (Hamamatsu R928). The fluorescence signal was
24-bit A / D interface at 10 Hz (Borwin, JMBS DNA, then 2% PEO containing EtB via the EOF for
Developments, Le Fontanil, France) and stored in a the rest of the separation. More details see Section 3.
personal computer. Capillaries (Polymicro
Tech-nologies, Phoenix, AZ, USA) with 75 mm I.D. and 2.5. Calculation
365 mm O.D. were used for DNA separations
without any further coating process. Resolution (R ) was calculated using Eq. (1).
s
R 5 2(t 2 t ) /(t 1 t ) (1)
2.2. Chemicals s 2 1 w1 w2
where t and t are the migration times, and t1 2 w1 and
All chemicals for preparing buffer solutions were
tw2 are the width of the peak at baseline for
from Aldrich (Milwaukee, WI, USA). EtB was
fragments 1 and 2, respectively. obtained from Molecular Probes (Eugene, OR,
USA). The buffer solutions were 13TBE (89 mM Tris, 89 mM boric acid and 2 mM EDTA) containing
3. Results and discussion
different amounts of EtB in the absence and presence
6
of different amounts of PEO (Mr 8?10 ). DNA
markers V and VI were purchased from Boehringer 3.1. Isocratic separation
Mannheim (Mannheim, Germany).
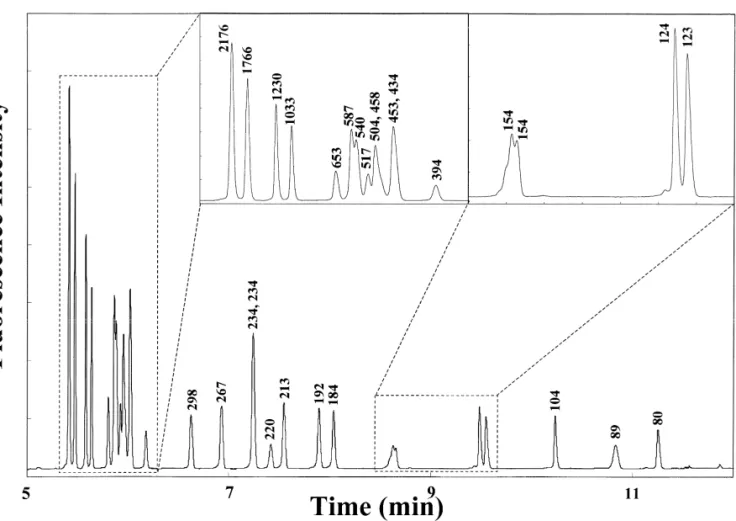
Fig. 1 shows the separation of DNA markers V and
2.3. Preparation of PEO solutions VI, ranging from 8 to 2176 base pairs (bp) in the
presence of EOF, using a 1% PEO solution
con-Certain amounts of PEO were gradually added taining 1 mg / ml EtB. DNA fragments larger than 80
into the 13TBE buffer solutions in a beaker stirring bp were separated in less than 12 min. It should be
in a water bath at 85–908C. During the addition of noted that larger DNA fragments were detected
PEO, a magnetic stirring rod was used at high speed earlier than small ones since larger DNA fragments
to produce a well homogenized solution. After the were retarded more effectively by PEO matrices
addition was complete, the solution was stirred for at when they migrated upstream against the EOF. The
least one more hour. Finally, polymer solutions were results show not only single-base resolution between
degassed with a vacuum system in an ultrasonic 123- and 124-bp DNA fragments, but also partial
tank. Polymer solutions stored in a refrigerator at resolution between two 154-bp DNA fragments.
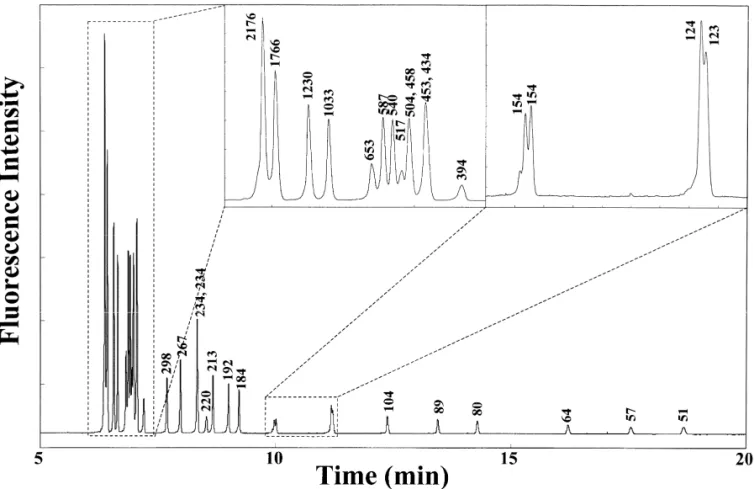
48C were usable for at least a week. Unlike the result shown in Fig. 1, Fig. 2 shows that
DNA fragments larger than 51 bp were detected in
2.4. Separation less than 20 min at 15 kV, using 2% PEO solution
containing 1 mg / ml EtB. Although resolution
be-Prior to analysis, capillaries were treated with 0.5 tween 123- and 124-bp DNA fragments is worse,
M NaOH overnight. After each run, capillaries were resolution values between two 154-bp, and between
washed with 0.5 M NaOH at 0.5 kV for 10 min to 540- and 587-bp DNA fragments become larger.
remove polymer solutions and refresh the capillary From the baseline shift in Figs. 1, 2 (not clearly
wall. Twenty-five mg / ml DNA was injected into the shown in the whole scale of the electropherograms),
capillary filled with TBE buffer containing EtB at 1 we knew that the EOF is smaller in a 2% PEO
kV for 5 s. Then the injection end of the capillary solution. The result suggests that the longer
migra-was moved into PEO solutions. During the sepa- tion time using the 2% PEO solution might result
ration, PEO solutions were migrated into the capil- from the higher viscosity and more adsorption of the
lary via the high EOF for sieving DNA fragments. In PEO molecules in the capillary surface.
the stepwise experiment, 13 TBE containing EtB It is difficult to detect smaller DNA fragments in
were filled prior to injection of DNA, 1% PEO the presence of EOF because the fluorescence
inten-containing EtB were introduced into the capillaries sities are weak and the electrophoretic mobilities
Fig. 1. Separation of DNA markers V and VI in the presence of EOF at 15 kV, using a 1% PEO (M 8 000 000) solution containing 1 mg / mlr
EtB. Capillary: 40 cm in total length and 30 cm in effective length; filled with 13TBE containing 1 mg / ml EtB. Buffer vials contain the 1% PEO and 1 mg / ml EtB solution.
are high. In order to detect smaller DNA fragments, that the EPMs of DNA fragments decreased after
several approaches might be worth trying, such as forming intercalated complexes with EtB because the
increasing the EOF, decreasing the DNA mobility, EOF almost remained constant in PEO solutions
and / or enhancing the sensitivity of the detection containing different amounts of EtB. The reduction
system. For example, a higher EOF can be achieved should be due to the decrease in the net charges and
using a more suitable polymer solution with lower elongation of the DNA fragments. Moreover, the
ionic strengths. On the other hand, decreases in the higher resolution values between 123- and 124-bp,
mobility of DNA can be approached using suitable and two 234-bp DNA fragments were observed in
intercalating dyes and smaller pore-size polymer the presence of high concentrations of EtB.
solutions. It is also important to choose suitable dyes
(e.g. bisintercalating dyes such as TOTO) with 3.2. Why SCCE?
optimal concentrations for enhancing the sensitivity.
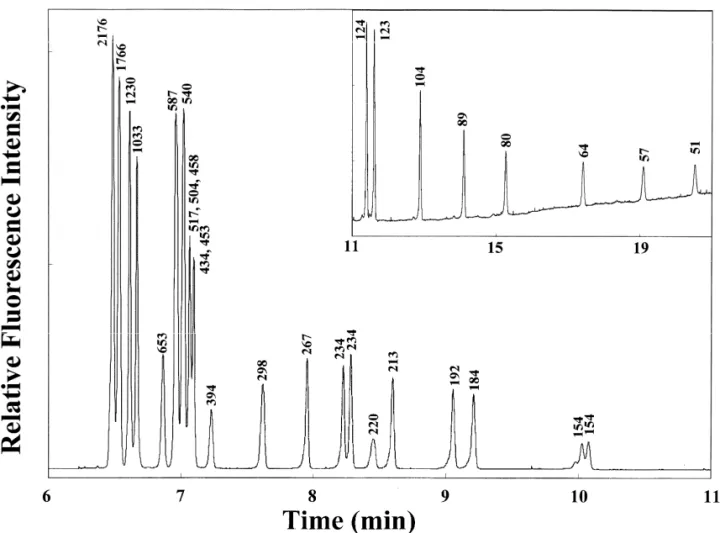
To further shorten separation times and enhance Although the separation of DNA in the presence
the detection capability for smaller DNA fragments, of EOF has been shown for many years, this method
we performed the separation using a 2% PEO has only been applied to the separation of large DNA
solution containing 20 mg / ml EtB. Fig. 3 shows the fragments using ultradiluted polymer solutions
separation of DNA makers V and VI at 15 kV in less [27,28]. The restriction to the use of high
Fig. 2. Separation of DNA markers V and VI in the presence of EOF at 15 kV, using a 2% PEO solution containing 1 mg / ml EtB. Buffer vials contain the 2% PEO and 1 mg / ml EtB solution. Other conditions as in Fig. 1.
decrease in the EOF, wherein the adsorption of the ing efficiency in the analysis of DNA. To perform
polymer molecules into the capillary wall is more SCE for DNA analysis, the buffer vials containing
serious. Recently, the use of polymer solution above different concentrations of PEO and EtB were
manu-its entanglement threshold in the presence of EOF ally changed. Thus different PEO solutions were
has been demonstrated in the separation of small introduced into the capillary by the EOF during the
DNA as well as kilobase DNA markers by our group DNA analysis.
[25,26]. In the presence of EOF, better resolution in
the separation of DNA fragments could be achieved 3.3. SCE using different PEO solutions
since DNA migrated upstream against EOF [29]. The
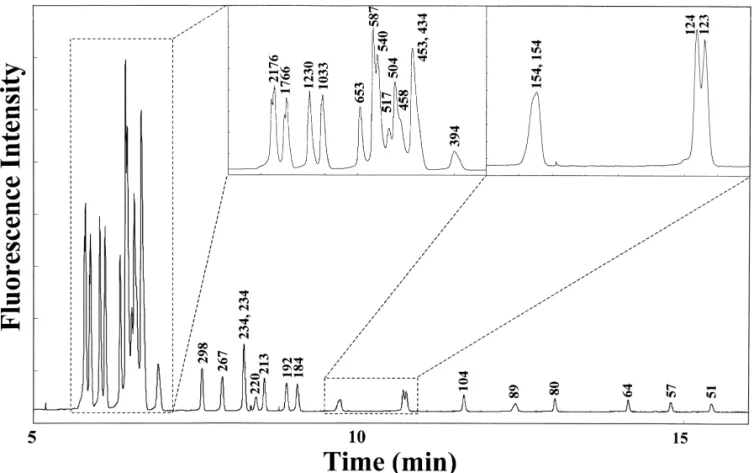
high-resolution separation of small DNA using a Fig. 4 shows the separation of DNA Markers V
very small-size capillary filled with highly viscous and VI in SCE at 15 kV, using a 1% PEO solution
polymer solutions in the presence of the EOF has for 4 min, then a 2% PEO solution for the rest of the
been demonstrated [25]. More importantly, the sepa- separation time. DNA fragments larger than 51 bp
ration of DNA in CPGGE becomes feasible in the were detected in less than 16 min. The separation
presence of EOF. However, it may suffer from the time and resolution obtained in SCE were different
variation of the EOF. Thus it is very important to from those obtained under two different isocratic
refresh capillary surface with 0.5 M NaOH to conditions (Figs. 1, 2), indicating that DNA
frag-minimize the adsorption of polymer molecules into ments underwent the two different polymer solutions
the capillary wall prior to analysis. As the EOF can when they migrated upstream against the EOF. For
Fig. 3. Separation of DNA markers V and VI in the presence of EOF at 15 kV, using a 2% PEO solution containing 20 mg / ml EtB. Buffer vials contain the 2% PEO and 20 mg / ml EtB solution. The capillary was filled with a 13TBE solution containing 20 mg / ml EtB Other conditions as in Fig. 1.
zone of the 1% PEO solution, and thus resolution the migration times based on the first peak (2176-bp
values between any two larger DNA fragments DNA fragment). The R.S.D. values are less than 2%,
(larger than 653 bp) obtained in SCE were higher except that of the 394-bp DNA fragment. One reason
than those obtained using the isocratic means (2% for poor reproducible results of DNA fragments
PEO). Surprisingly, two partially resolved bands of around 394 bp is the diffusion problem because they
458- and 504-bp DNA fragments were obtained, migrated closely to the interface between 1% and 2%
which may be due to the changes in DNA conforma- PEO solutions. The migration time of the interface
tions when they migrated through the two different estimated from the shift of the baseline (not clearly
PEO solutions. The loss in resolution between two shown in the whole scale in Fig. 4) is around 7.5
154-bp DNA fragments is abnormal, which may be min. If this is the fact, the problem of poor
repro-due to the changes in DNA conformations and the ducibility should be further minimized by using two
diffusion effects (concentration change on the inter- polymer solutions with similar viscosities, but
differ-face between the two different polymer solutions). ent pore sizes, or by performing CPGGE using a
Table 1 shows the reproducibility of the migration pumping system for automatically and gradually
times of some DNA fragments obtained in SCE. To changing polymer solutions in the injection end.
prevent the variations resulting from changing the Tables 2, 3 show the comparison of the migration
Fig. 4. Separation of DNA markers V and VI at 15 kV in SCE, using a 1% PEO solution containing 1 mg / ml EtB for 4 min, then a 2% PEO solution containing 1 mg / ml EtB for the rest of the separation. Buffer vials contain the 2% PEO and 1 mg / ml EtB solution. Other conditions as in Fig. 1.
Table 2
Comparison of the migration times of some DNA fragments in isocratic and stepwise separations
Table 1
Base pair Migration time (min) Reproducibility of migration times of some DNA fragments in
SCE a
A B C D E
Base pair Normalized migration 2176 6.36 6.25 6.00 5.79 5.42
a
time (min) Mean RSD (%) 1766 6.41 6.29 6.05 5.86 5.48
1230 6.55 6.40 6.17 6.01 5.58 2176 5.79 5.79 5.79 5.79 0.00 1033 6.64 6.47 6.25 6.09 5.64 1766 5.86 5.87 5.86 5.86 0.10 653 6.82 6.63 6.43 6.23 5.81 1230 6.01 6.00 6.00 6.00 0.09 394 7.20 6.99 6.81 6.90 6.18 1033 6.09 6.10 6.07 6.09 0.22 298 7.69 7.45 7.30 8.12 6.63 653 6.32 6.47 6.29 6.36 1.51 234 8.32 8.01 7.91 8.22 7.24 394 6.90 7.53 7.23 7.22 4.38 213 8.66 8.30 8.24 8.54 7.55 298 7.58 7.84 7.70 7.71 1.71 123 11.21 10.25 10.51 10.72 9.55 234 8.22 8.35 8.38 8.32 1.03 64 16.21 13.53 14.43 14.14 N.D. 213 8.54 8.68 8.71 8.64 1.06 51 18.67 14.98 16.18 15.43 N.D. 123 10.72 10.88 10.91 10.83 0.92 64 14.14 14.42 14.48 14.35 1.28 a
A and E: 2% and 1% PEO solutions under isocratic con-51 15.43 15.68 15.74 15.62 1.05 ditions. B, C, and D: a 1% PEO solution was introduced into the
a capillary for 0.5, 1, and 4 min, respectively, at 15 kV, then a 2%
A 1% PEO solution was introduced into the capillary for 4
PEO solution during the separation. min at 15 kV, then a 2% PEO solution during the separation.
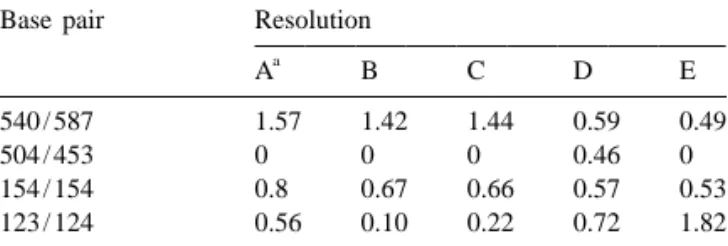
Table 3 containing 1 mg / ml EtB for 4 min, then a 2% PEO Comparison of some of the resolution values in the separation of solution containing 20 mg / ml EtB for the rest of the DNA fragments under isocratic and stepwise conditions
separation. In this case, it has a less chance for larger
Base pair Resolution DNA fragments than smaller DNA fragments
under-a
A B C D E going the PEO zone with higher EtB. Thus
res-olution values between any two larger DNA
frag-540 / 587 1.57 1.42 1.44 0.59 0.49
ments (larger than 653 bp) obtained from SCE are
504 / 453 0 0 0 0.46 0
154 / 154 0.8 0.67 0.66 0.57 0.53 higher than those obtained under isocratic conditions
123 / 124 0.56 0.10 0.22 0.72 1.82 (20 mg / ml EtB). In other words, EtB molecules
a
A and E: 2% and 1% PEO solutions under isocratic con- might have more significant effects on the change in
ditions. B, C, and D: a 1% PEO solution was introduced into the the conformation of smaller DNA fragments during capillary for 0.5, 1, and 4 min, respectively, at 15 kV, then a 2% the separation. It is therefore that the total separation PEO solution during the separation.
time obtained in SCE is in the range of those obtained under two isocratic conditions (1 and 20
conditions and in SCE using various fractions of two mg / ml EtB).
different PEO solutions during the separation. As the To test the effects of the changes in the net
results shown in Table 2, the migration times of charges and conformations of DNA as well as the
DNA fragments larger than 653 bp become shorter properties (such as pore size) of polymer solutions on
with the increase in the fraction of the 1% PEO the DNA analysis, we performed the separation in
solution inside the capillary during the separation. SCE, using solutions containing different
concen-This again indicates that the EOF is smaller in the trations of PEO and EtB. Fig. 6 shows the separation
2% PEO solution. On the other hand, the migration of DNA markers V and VI in 15 min at 15 kV via
times of the smaller DNA fragments changed irregu- SCE, using a 1% PEO solution containing 1 mg / ml
larly. When small DNA fragments migrated through EtB for 4 min, then a 2% PEO solution containing
the interface between the 1% and 2% PEO solutions, 20 mg / ml EtB for the rest of the separation time.
DNA conformations might change and concentration Results again show that 458- and 504-bp DNA
diffusion might also affect the migration of DNA. fragments were partially resolved. Furthermore, the
The slight change in resolution shown in Table 3 resolution values between any two DNA fragments
may be due to the effects of different viscosity and larger than 653 bp and between 123- and 124-bp
pore sizes of the two PEO solutions. It is interesting fragments are higher than those obtained in Fig. 5.
to note that the peaks of two 154-bp DNA fragments EtB.DNA. When the concentrations of EtB and
were not resolved when the 1% PEO solution was PEO were simultaneously changed in SCE, 20 mg /
introduced for a short period of time. This may be ml EtB (cations) migrated into the 1% PEO (neutral)
due to the diffusion problem in such a narrower 1% solution to undergo DNA in the separation. Thus the
PEO zone between 13TBE and 2% PEO solutions. result should also be partially reflected in that
From the changes in migration time and resolution in obtained in the 1% PEO solution containing 20
SCE under different conditions, we know that DNA mg / ml EtB. Table 4 shows the comparison of the
should undergo two different PEO solutions during results obtained from two isocratic conditions (Figs.
the separation. 2, 3) and two stepwise conditions (Figs. 5, 6).
Obviously, resolution in the separation of DNA
3.4. SCE using different EtB and PEO fragments was varied using different concentrations
of PEO and EtB in SCE. It is interesting to note that
In an attempt to shorten the separation time and partially resolved bands of 458- and 504-bp DNA
enhance the sensitivity of detecting smaller DNA fragments were only achieved in the stepwise change
fragments, we performed the DNA separation using in PEO, not in EtB. Overall, the results also suggest
different concentrations of EtB. Fig. 5 shows the that modification of the DNA conformations by
separation of DNA markers V and VI in less than 15 adding suitable concentrations and species of
Fig. 5. Separation of DNA markers V and VI at 15 kV in SCE, using a 2% PEO solution containing 1 mg / ml EtB for 4 min, then a 2% PEO containing 20 mg / ml EtB for the rest of the separation. Buffer vials contain the 2% PEO and 20 mg / ml EtB solution. Other conditions as in Fig. 2.
capillary with suitable polymer solutions can be cules by introducing suitable dyes, polymer solution,
useful for enhancing the separation efficiency in and electrolytes in the presence of EOF during the
DNA analysis. separation.
Although a dramatic enhancement in separation efficiency of the DNA analysis has not been
4. Conclusion achieved in this preliminary experiment, the results
do suggest the potential of this new approach in the
In this work, we have demonstrated a new ap- analysis of macromolecules. To minimize diffusion
proach for the DNA analysis with single-base res- problems occurred in the interface between two
olution in the presence of EOF. The high-speed and polymer solutions, gradient techniques using a pump
high-resolution separation results in the analysis of to introduce different polymer solutions with slight
DNA, suggesting the potential of SCE in many changes in viscosity might be needed. Thus one of
applications, such as DNA sequencing and the our future goals is to develop gradient techniques,
analysis of PCR products. Another features of SCE using suitable polymer solutions and dyes for
en-is its capability of changing the separation range, hancing the separation efficiency in the separation of
Fig. 6. Separation of DNA markers V and VI at 15 kV in SCE, using a 1% PEO solution containing 1 mg / ml EtB for 4 min, then a 2% PEO solution containing 20 mg / ml EtB for the rest of the separation. Buffer vials contain the 2% PEO and 20 mg / ml EtB solution. Other conditions as in Fig. 2.
Acknowledgements
This work is supported by a grant from National Science Council of the Republic of China (No. NSC 88-2113-M002-002).
Table 4
Comparison of some of the resolution values in the separation of DNA fragments under isocratic conditions, stepwise changes in EtB, and EtB and PEO
References
Base pair Resolution
a
A B C D [1] K. Benedek, A. Guttman, J. Chromatogr. A 680 (1994) 375. [2] V. Dolnik, M. Novotny, J. Microcol. Sep. 4 (1993) 515.
517 / 504 1.50 0.00 0.94 0.89
[3] K. Kleparnik, Z. Mala, P. Bocek, J. Chromatogr. A 772
504 / 458 0.00 0.00 0.00 0.74
(1997) 243.
234 / 234 0.00 1.67 0.52 0.30
[4] Y. Fang, J.Z. Zhang, J.Y. Hou, H. Lu, N.J. Dovichi,
Electro-154 / Electro-154 0.89 1.01 0.72 0.59
phoresis 17 (1996) 1436.
124 / 123 0.00 3.54 1.55 1.73
[5] A.E. Barron, W.M. Sunada, H.W. Blanch, Electrophoresis 17
a
[6] N. Iki, E.S. Yeung, Anal. Chem. 68 (1996) 4321. [19] J.S. Fawcett, D. Wheeler, A. Chrambach, J. Biochem. [7] E. Carrilho, M.C. Ruiz-Martinez, J. Berka, I. Smirnov, W. Biophys. Methods 24 (1992) 181.
Goetzinger, A.W. Miller, D. Brady, B.L. Karger, Anal. [20] H. T. Chang, E.S. Yeung, J. Chromatogr. B 669 (1995) 113. Chem. 68 (1996) 3305. [21] Y. Chen, F. L. Wang, U. Schwarz, J. Chromatogr. A 772 [8] S.M. Clark, R.A. Mathies, Anal. Chem. 69 (1997) 1355. (1997) 129.
[9] H.R. Reese, Biopolymers 34 (1994) 1349. [22] T. Kaneta, H. Jeong, E.S. Yeung, J. High. Resolut. Chroma-[10] C. Carlsson, A. Larsson, M. Jonsson, Electrophoresis 17 togr. 21 (1998) 287.
(1996) 642. [23] X.C. Huang, M.A. Quesada, R.A. Mathies, Anal. Chem. 64 [11] C. Carlsson, M. Jonsson, Macromolecules 29 (1996) 7802. (1992) 2149.
[12] Y. Kim, M.D. Morris, Anal. Chem. 66 (1994) 1168. [24] H. Swerdlow, J.Z. Zhang, D.Y. Chen, H.R. Harke, R. Grey, [13] H. Swerdlow, B.J. Jones, C.T. Witter, Anal. Chem. 69 (1997) S. Wu, N.J. Dovichi, C. Fuller, Anal. Chem. 63 (1991) 2835. 848. [25] H.S. Chen, H.T. Chang, Anal. Chem. 71 (1999), in press. [14] Y. Baba, J. Chromatogr. B 687 (1996) 271. [26] H.S. Chen, H.T. Chang, Electrophoresis 19 (1998) 3149. [15] H.R. Reese, Biopolymers 34 (1994) 1349. [27] H. Oana, R.W. Hammond, J.J. Schwinefus, S. C. Wang, M. [16] G. Gelfi, P.G. Righetti, L. Cremonesi, M. Ferrari, Electro- Doi, M.D. Morris, Anal. Chem. 70 (1998) 574.
phoresis 15 (1994) 1506. [28] S. Nathakarnkitkool, P.J. Oefner, G. Bartsch, M.A. Chin, [17] G. Gelfi, P.G. Righetti, L. Cremonesi, M. Ferrari, Biotech- G.K. Bonn, Electrophoresis 13 (1992) 18.
niques 21 (1996) 926. [29] A.E. Barron, H.W. Blanch, D.S. Soane, Electrophoresis 15 [18] E. Gombocz, A. Chrambach, Electrophoresis 12 (1991) 997. (1994) 64.