D
uring the past decade, there has been a trend growing to develop and disseminate report cards to the public in the healthcare industries of the United States, the United Kingdom, Australia, and Canada. These report cards are purported to induce providers to improve the quality of services, while providing consumers with relevant information onprovider performance. Policy makers believe that the publication of report cards is one potential solu-tion to the problem of informasolu-tion asymmetries in the healthcare market.(1)
The first release of performance information on hospitals to the public dates back to 1863, when Florence Nightingale produced a report comparing
Exploring Willingness and Related Factors by Using the
Healthcare Report Cards for Hospitals in Taiwan
Herng-Ching Lin, PhD
Background: During the past decade, there has been growing a trend to develop and
dis-seminate report cards to the public in the healthcare industries of the United States. The purposes of this article were to understand the willingness of hos-pitals in Taiwan to use report cards and to explore the factors that influence the willingness of hospitals to use them.
Methods: A postal survey study was conducted on 495 hospitals to explore factors influencing the willingness of hospitals to use report cards. A multiple logis-tic regression was performed to identify statislogis-tically significant factors relat-ed to the willingness of the hospitals to use report cards.
Results: In total, 52.0% of the sampled hospitals were "very willing" or "willing" to use report cards. The top three factors which respondents felt most influ-enced the willingness of hospitals to use report cards were the provision for incorrect data, the upgrading of the image of the hospital, and the increase in administrative costs. Multiple logistic regression analysis revealed that the willingness of hospitals to use report cards was positively significantly asso-ciated with the score of the factor "to upgrade the image of the hospital" (OR = 8.0; 95% CI 1.8-36.0), and it was negatively associated with the score of the factor "to increase the possibility of malpractice suits" (OR = 0.5; 95% CI 0.2-0.9).
Conclusions: It was also found that more than half of hospitals were willing to use report
cards. Thus, it is recommended that mandatory hospital report cards be initi-ated in order to allow consumers to make fair and accurate comparisons among hospitals.
(Chang Gung Med J 2003;26:330-8)
Key words: Hospital report cards, multiple logistic regression, report cards.
From the Graduate Institute of Health Care Administration, Taipei Medical University, Taipei. Received: Oct. 28, 2002; Accepted: Jan. 28, 2003
Address for reprints: Assist. Prof. Herng-Ching Lin, Graduate Institute of Health Care Administration, Taipei Medical University. 250, Wu-Hsing St., Taipei, Taiwan, R.O.C Tel.: 886-2-2345-2506 ext. 13; Fax: 886-2-2378-9788; E-mail: henry11111@tmu.edu.tw
the mortality rates of patients in London teaching hospitals.(2) However, it was not until 1986 that the
hospital mortality data was publicly released again by the Health Care Financing Administration in the US.(3) This was the first time that consumers had
access to performance information of healthcare providers in modern times. Since then, the number of healthcare providers or healthcare plans releasing performance information has continued to increase. In 1995, the concept of "standardized, publicly released reports on the quality of care" was described with the term "report card" by Epstein.(4) In 1998,
Slovensky et al. defined the report cards as "pub-lished summaries of the organization or plan perfor-mance for a specified period of time, usually 1 year."(5) In 1999, Bodenheimer also defined the
report cards "as one manifestation of a health care marketplace in which competing providers would measure and report information about the quality of care they offer".(6)
Many studies have documented how the report cards have emerged as a new tool to empower con-sumers with the ability to choose an appropriate provider. For example, a survey done for the United States federal agency, Health Care Policy and Research, found that more than 80% of respondents thought report cards would be useful to make deci-sions about healthcare plans or providers.(7) Another
survey conducted by Harris revealed that 70% of respondents responded that report cards were either very helpful or helpful in making their healthcare purchasing decisions.(8) However, a study by Voelker
revealed that consumers did not necessarily take the time to use the information on the report cards even when they were aware of them.(9)
In addition to facilitating informed consumer choice, report cards are also intended to stimulate quality improvements by providers through the pub-lic reporting of performance information. The New York State Department of Health reported that the publication of hospital report cards compelled hospi-tals to decrease the statewide risk-adjusted mortality rate for cardiac surgery from 3.5% in 1990 to 2.5% in 1992.(8) One study by Chassin et al. reported that
the risk-adjusted mortality associated with coronary artery bypass grafts in New York State dropped by 41% after the introduction of hospital report cards.(10)
In a study by Schneider and Lieberman, the estimat-ed percentage of adolescents receiving measles,
mumps, and rubella immunizations increased from 52% to 59%, and the percentage of heart attack vic-tims receiving beta-blocker medication rose from 62% to 85% with the advancement of hospital report cards.(11)
The trend of the increasing use of report cards has been accepted as a promising mechanism to pro-vide consumers with more information regarding costs and quality of healthcare providers or health-care plans as well as to stimulate quality improve-ments by healthcare providers in the United States. However to date, very few studies have been con-ducted concerning the public release of hospital information in Taiwan.(12) In particular, very few
studies have addressed the possible factors that influ-ence the willingness of hospitals to use healthcare report cards. Even in the United States, only the fac-tors of high costs, concern over incorrect reporting of performance data provided by other hospitals, and enhancement of the hospitals' images were identified as influencing the willingness of hospitals to use report cards.(5,13,14) Empowering consumers with the
ability to choose an appropriate hospital is becoming more important as costs are no longer a major barrier to healthcare under the Taiwan National Health Insurance (NHI). Therefore, the purposes of this article were to understand the willingness of Taiwanese hospitals to use hospital report cards and to identify the factors that influence this willingness. This article can help draw the attention of policy makers and hospital administrators to increase their efforts towards developing relevant hospital report cards.
METHODS
Study population
The subjects of this study were general hospitals that were accredited by the Taiwan Joint Commission on Hospital Accreditation as medical centers, regional hospitals, district teaching hospitals, or district hospitals in the year 2001. The study pop-ulation included 495 general hospitals consisting of 17 medical centers, 62 regional hospitals, 49 teach-ing district hospitals, and 367 district hospitals.
Instrument
A structured questionnaire of the willingness of hospitals to use report cards (HWRC) was developed
by a research team through literature reviews, and structured interviews with eight experts, including two persons each in charge of quality assurance at medical centers, regional hospitals, teaching district hospitals, and district hospitals. The final version of the HWRC questionnaire consisted of three parts. The first part included the overall willingness of a hospital to use report cards. The overall willingness level was measured on a 5-point Likert scale, with 5 meaning very willing, and 1 meaning very unwilling. The second part included 10 questions that relat-ed to factors influencing the willingness of hospitals to use report cards. These 10 factors were catego-rized into positive and negative factors. The positive factors included to upgrade the image of the hospital, to reflect requests for information by the public, to face increasing competition from other hospitals, to increase consumers" loyalty to hospitals, and to be a reimbursement reference for the Bureau of the National Health Insurance. On the other hand, the negative factors included increase the possibility of malpractice suits, cause of misunderstandings of the quality of care by the public, fear of its use as a pun-ishment reference of the hospital by a government office, provision of incorrect performance data by other hospitals, and increase of administrative costs. These 10 questions were also measured on a 5-point Likert scale from greatly disagree (1) to greatly agree (5).
The third part concerned hospital demographics including ownership, level, location, teaching status, and whether or not there was a full-time person in charge of quality assurance at the hospital, and whether the hospital participates in the Taiwan Quality Indicators Project (TQIP) or Taiwan Healthcare Indicator Series (THIS). The validity of the HWRC was examined by experts, and the resul-tant Content Validity Index was greater than 0.8. Internal consistency was also assessed using Cronbach's α correlation coefficient. Cronbach's α was 0.75 for the 10 questions related to factors influ-encing the willingness of hospitals to use report cards
Data collection and analysis
In total, 495 questionnaires were mailed from May 1 through June 25, 2002 to hospital administra-tors or persons in charge of the healthcare quality assurance in hospitals. The hospitals' names and
addresses were obtained from the Department of Health in 2002. Two follow-up mailings to non-respondents were also performed to improve the response rate during the survey period.
Statistical analyses were performed using the Statistical Package for the Social Sciences (SPSS 10.0 for Windows, 1997, SPSS, Chicago, Ill). All variables were analyzed using descriptions such as frequency, percentage, mean, and standard deviation. A multiple logistic regression was also conducted to identify the statistically significant factors related to the willingness of hospitals to use report cards. The dependent variable was treated as a dichotomous cat-egory on the basis of whether a hospital was willing to use report cards (willingness = 1, unwillingness = 0). Hospitals that answered "very willing" and "will-ing" on the question of overall willingness of hospi-tals to use report cards were recorded as 1 and those which answered "very unwilling" and "unwilling" to the question of overall willingness were recorded as 0. The independent variables consisted of 10 factors related to the willingness of hospitals to use report cards. In addition, hospital level (medical center, regional hospital, district teaching hospital, and dis-trict hospital), hospital ownership (public hospital, voluntary hospital, and proprietary hospital), hospital location (based on the location of the six branches of the Bureau of the National Health Insurance where the hospital filed claims for medical benefits), teach-ing status, existence of person in charge of quality of care in hospital, and hospital participation in the TQIP or THIS were all controlled for in this study. In addition, the relationships between the overall willingness of hospitals to use report cards and hos-pital level, hoshos-pital ownership and hoshos-pital location were examined using Kruskal-Wallis tests. All regression coefficients were considered significant at
p < 0.05.
RESULTS
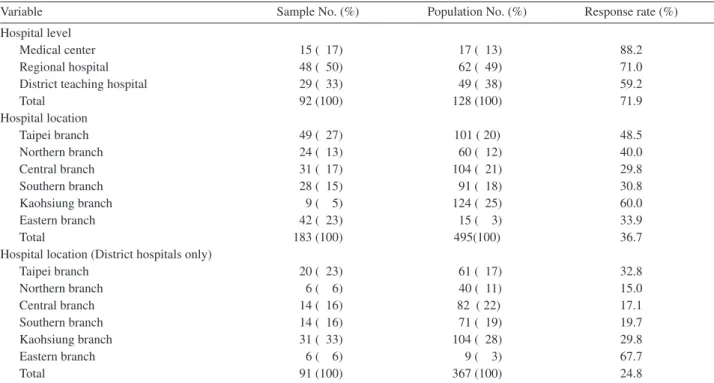
There were 183 questionnaires returned which yielded a 36.7% response rate. This response rate was higher than those in studies conducted on the same sample by Lin et al. and Lan et al.(12,13) In
addi-tion, the sampled hospitals were similar to all hospi-tals accredited by the Taiwan Joint Commission on Hospital Accreditation in 2001 as medical centers, regional hospitals, district teaching hospitals, and
district hospitals with regard to hospital location ( p = 0.124) (Table 1). Since the response rate for dis-trict hospitals was lower compared to those of other hospital levels, a goodness-of-fit test was also con-ducted regarding hospital level after excluding dis-trict hospitals. It was found that the sampled hospi-tals were similar to the entire population of hospihospi-tals with respect to hospital level ( p = 0.441). With respect to district hospitals, a goodness-of-fit test showed that the sampled hospitals were similar to the entire population of hospitals with respect to hospital location ( p = 0.145).
Of the sample, 8.2% of the respondents were medical centers, 26.2% were regional hospitals, 15.8% were district teaching hospitals, and 49.8% were district hospitals. As for the teaching status, 47% of the respondents were teaching hospitals, and the remaining 53% were not teaching hospitals.
Overall willingness of hospitals to use report cards
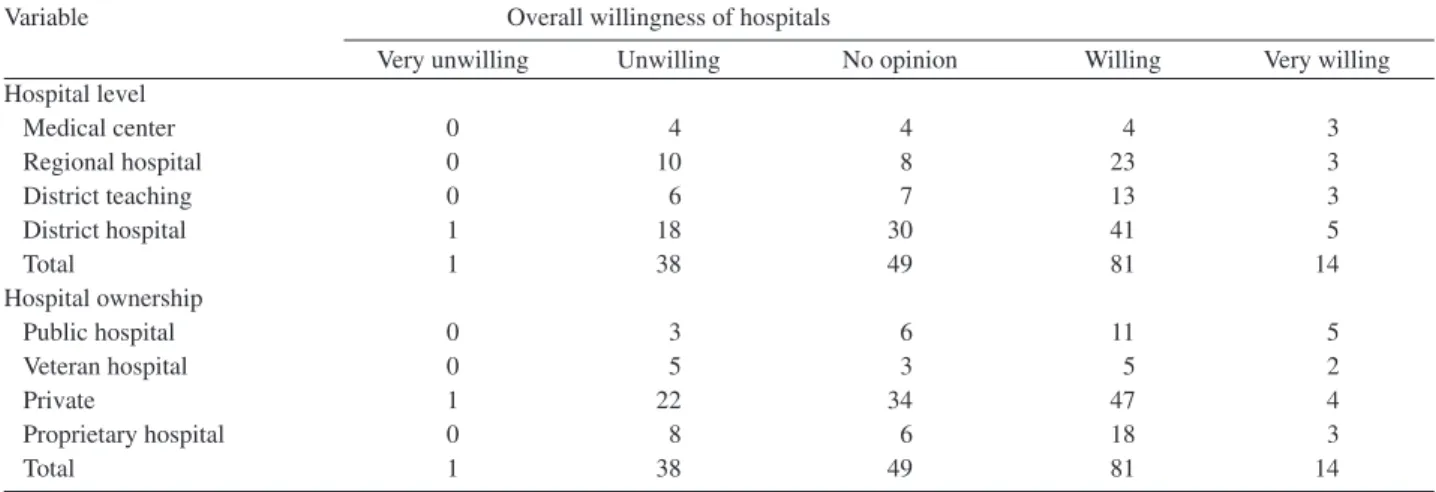
Among the sampled hospitals, 0.5% were "very unwilling" to use hospital report cards, and 20.8% answered that they were "unwilling" to use hospital
report cards. In other words, 21.3% were "very unwilling" or "unwilling" to use hospital report cards. On the contrary, 7.7% of the sampled hospi-tals were "very willing" to use hospital report cards. The majority of hospitals (44.4%) were "willing" to use hospital report cards. That is, 52.0% were "very willing" or "willing" to use hospital report cards. The remaining 26.8% answered "no opinion" to the question of overall willingness for their hospital to use report cards. The results also showed that the overall willingness of hospitals to use report cards was not significantly related to the hospital level ( p = 0.862) or hospital ownership ( p = 0.284) (Table 2).
Factors of the willingness of hospitasl to use report cards
The top three factors (Table 3) which respon-dents felt most influenced the willingness of hospi-tals to use report cards were the provision of incor-rect data (4.2Ų0.6), the upgrading of the image of the hospital (4.0Ų0.6), and the increase in adminis-trative costs (4.0Ų0.8). On the other hand, the top three factors that respondents felt least influenced the
Table 1. Characteristics of Entire Population of Hospitals and Sampled Hospitals
Variable Sample No. (%) Population No. (%) Response rate (%)
Hospital level
Medical center 15 ( 17) 17 ( 13) 88.2
Regional hospital 48 ( 50) 62 ( 49) 71.0
District teaching hospital 29 ( 33) 49 ( 38) 59.2
Total 92 (100) 128 (100) 71.9 Hospital location Taipei branch 49 ( 27) 101 ( 20) 48.5 Northern branch 24 ( 13) 60 ( 12) 40.0 Central branch 31 ( 17) 104 ( 21) 29.8 Southern branch 28 ( 15) 91 ( 18) 30.8 Kaohsiung branch 9 ( 5) 124 ( 25) 60.0 Eastern branch 42 ( 23) 15 ( 3) 33.9 Total 183 (100) 495(100) 36.7
Hospital location (District hospitals only)
Taipei branch 20 ( 23) 61 ( 17) 32.8 Northern branch 6 ( 6) 40 ( 11) 15.0 Central branch 14 ( 16) 82 ( 22) 17.1 Southern branch 14 ( 16) 71 ( 19) 19.7 Kaohsiung branch 31 ( 33) 104 ( 28) 29.8 Eastern branch 6 ( 6) 9 ( 3) 67.7 Total 91 (100) 367 (100) 24.8
Table 3. Relationships between Factors and the Willingness of Hospitals to Use Report Cards
Variable Mean S.D. O.R. 95% C.I.
To upgrade the image of the hospital 4.0 0.6 8.0 (1.8-36.0)
To reflect requests for information by the public 3.9 0.7 1.2 (0.4-3.6) To face increasing competition from other hospitals 3.9 0.7 1.2 (0.5-3.4)
To increase consumers' loyalty to hospitals 3.7 0.8 0.9 (0.4-2.4)
As a reimbursement reference for the Bureau of National Health Insurance 3.5 0.9 1.4 (0.7-2.9) To increase the possibility of malpractice suits 3.5 1.0 0.5 (0.2-0.9) To cause misunderstandings of the quality information by the public 3.9 0.9 1.5 (0.6-3.8) As a punishment reference of the hospital by a government office 3.3 1.0 0.7 (0.4-1.5)
To provide incorrect data 4.2 0.6 1.9 (0.4-8.2)
To increase administrative costs 4.0 0.8 1.0 (0.4-2.5)
Hospital ownership
Proprietary hospital (yes/no) 0.4 (0.1-2.0)
Voluntary hospital (yes/no) 1.0 (0.2-5.1)
Hospital location
Taipei branch (yes/no) 0.6 (0.1-2.5)
Northern branch (yes/no) 1.3 (0.2-9.3)
Central branch (yes/no) 0.6 (0.2-2.9)
Southern branch (yes/no) 0.7 (0.2-2.9)
Eastern branch (yes/no) 0.8 (0.1-13.9)
Hospital level
Medical center (yes/no) 0.2 (0.1-1.9)
Regional hospital (yes/no) 0.5 (0.1-2.6)
District teaching hospital (yes/no) 0.5 (0.1-2.1)
There is a person in charge of quality of care The hospital participates 1.1 (0.4-3.4)
in TQIP or THIS Constant 1.4 (0.5-3.7)
N 134
Correct classification rate 78.5%
Abbreviations: S.D.: standard deviation; O.R.: odds ratio; S.E.: standard error; C.I.: confidence interval.
Table 2. Relationship between Overall Willingness of Hospitals to Use Report Cards and Hospital Level and Ownership
Variable Overall willingness of hospitals
Very unwilling Unwilling No opinion Willing Very willing Hospital level Medical center 0 4 4 4 3 Regional hospital 0 10 8 23 3 District teaching 0 6 7 13 3 District hospital 1 18 30 41 5 Total 1 38 49 81 14 Hospital ownership Public hospital 0 3 6 11 5 Veteran hospital 0 5 3 5 2 Private 1 22 34 47 4 Proprietary hospital 0 8 6 18 3 Total 1 38 49 81 14
willingness of hospitals to use report cards were being a reference for punishment of the hospital by a government office (3.3Ų1.0), being a reimbursement reference for the Bureau of the National Health Insurance (3.5Ų0.9), and the increase in the possibil-ity of malpractice suits (3.5Ų1.0).
Relationships between factors and the willing-ness of hospitals to use report cards
Multiple logistic regression analysis (Table 3) revealed that whether or not a hospital was willing to use report cards was positively significantly associat-ed with the score of the factor "to upgrade the image of the hospital" (OR = 8.0; 95% CI 1.8-36.0), and negatively associated with the score of the factor "to increase the possibility of malpractice suits" (OR = 0.5; 95% CI 0.2-0.9). This indicates that hospitals that agreed that the use of report cards would upgrade their image were more willing to use hospi-tal report cards than were hospihospi-tals that disagreed. Hospitals that agreed that the use of report cards would increase the possibility of malpractice suits were less willing to use hospital report cards.
The results showed that whether or not a hospi-tal was willing to use report cards was not signifi-cantly associated with hospital location, hospital level, and hospital ownership. In addition, neither the factor of "there is a full-time person in charge of quality of care "(OR = 1.1; 95% CI 0.4-3.4) nor the factor of "a hospital participates in TQIP or THIS" (OR = 1.4; 95% CI 0.5-3.7) was significantly related to the willingness of hospitals to use report cards.
DISCUSSION
During the past decade, public disclosure of comparative performance data has become a promi-nent trend in the healthcare industry in many coun-tries.(15) The willingness and acceptability of
publi-cizing performance information by providers play important roles in the successful implementation of a public disclosure initiative.(15) This pioneering study
found that 52% of the hospitals in Taiwan were will-ing to use report cards. However, very few hospital report cards have been developed or disseminated in Taiwan to date. The possible reasons for the gap between the willingness of hospitals and the actual use of report cards may be attributed to the hospitals' unfamiliarity with report cards, low number of
relat-ed studies that have been publishrelat-ed, and the low incentive that exists for hospitals to initiate report cards.
The results of this study revealed that hospitals rated the provision of incorrect data as the factor with the greatest influence over their willingness to use report cards. This is consistent with a report by the Royal Women's Hospital that the manipulation of performance data is one of the major arguments pro-posed by the opponents of reporting.(16) The
phenom-enon of "manipulation of performance data to achieve good performance scores" is commonly known as "gaming".(17) It was also consistent with
the results of many previous studies which showed that inaccurate information resources and inadequate risk adjustment measures of databases impeded the use of report cards by providers.(5,18-20) Therefore,
determining ways to standardize the measures select-ed and to verify information resources will be major issues for the successful initiatives of hospital report cards in Taiwan.
Not surprisingly, hospitals also rated increased administrative costs as one of the top three factors influencing their willingness to use report cards. This finding is consistent with the conclusions of studies by Slovensky et al. and by the Royal Women's Hospital which reported that the costs of developing and producing a report card was seen as one of the major disincentives toward publishing performance information.(5,16) The cost issue would
be particularly crucial with the incessant decreases in profit margins of hospitals after the implementation of the NHI in Taiwan in 1995.
The results of this study showed that the extent to which hospitals agree that the use of report cards can upgraded the image of a hospital was positively related to their overall willingness to use report cards. This was consistent with the findings of Davies that the publication of performance data was a method to extend one's institutional reputation.(15)
Bentley and Nash also found that some organizations responded more positively to report cards when they were identified as good performers by the reports.(21)
On the contrary, some organizations responded nega-tively to report cards when their performance was displayed in a negative light by the reports.
Aside from the factors discussed above, the overall willingness of hospitals to use report cards was negatively related to the extent to which they
agree that the use of report cards could increase the possibility of malpractice suits. That is, the more a hospital believed that the use of report cards would result in increased possibilities of malpractice suits, the more unwilling the hospital was to use hospital report cards. According to the data released by the Department of Health in Taiwan in 2000 (DOH, 2002), the number of malpractice lawsuits increased 58.5% after the beginning of the NHI in 1995. A possible explanation for the increase in the number of malpractice lawsuits is that people have progres-sively recognized the importance of protecting their own rights when facing imbalances in the relation-ships in medical knowledge with physicians or hos-pitals. However, one of the rationales behind the use of report cards is to empower consumers by publish-ing and disseminatpublish-ing relevant information on providers. Therefore, some hospitals might be afraid that the public trust in hospitals will decrease with the introduction of report cards and will lead to an increase in the number of malpractice lawsuits. Further research is needed to explore whether a rela-tionship exists between the implementation of hospi-tal report cards and the number of malpractice law-suits.
Limitations
There were a few limitations to this study. First, because the data were obtained from self-reporting surveys by people in charge of quality assurance in Taiwanese hospitals, there was no way to determine whether an individual's remarks truly represented the consensus of the hospital. Second, although the test of "goodness of fit" showed that there were no differ-ences between the overall population and the sam-pled hospitals regarding hospital level and hospital location, the response rate for the district hospitals was still low (25.9%). Therefore, the findings should not be generalized across all district hospitals. Third, this study is perhaps the first national survey concerning the willingness of hospitals to use report cards. Therefore, there is no way to compare the present results with other studies.
The movement toward report cards apparently has had a sentinel effect on healthcare delivery through the public reporting of performance informa-tion based on the experiences in the United States, the United Kingdom, Canada, and Australia. However, very few studies concerning the issue of
hospital report cards have been published in Taiwan to date. This study found that 52% of hospitals were willing to use report cards. Therefore, it is recom-mended that mandatory hospital report cards be initi-ated in order to allow consumers make fair and accu-rate comparisons among hospitals. It is also recom-mended that hospital report cards make adjustments for the severity of illness and comorbidity for com-parisons among hospital performance outcomes and address consumers' feedback which can facilitate the development of relevant measures and interpreta-tions.
Acknowledgments
The author appreciates Mr. Kuan Lao for his suggestions and efforts during the process of con-ducting this study.
REFERENCES
1. Gormley WT. Assessing health care report cards. J Public Adm Res Theory 1998;8:325-52.
2. Marshall MN. Accountability and quality improvement: the role of report cards. Qual Health Care 2001;10:67-8. 3. Schauffler HH, Mordavsky JK. Consumer reports in
health care: do they make a difference? Annu Rev Public Health 2001;22:69-89.
4. Epstein A. Performance reports on quality--prototypes, problems, and prospects. N Engl J Med 1995;333:57-61. 5. Slovensky DJ, Fottler MD, Houser HW. Developing an
outcomes report card for hospitals: a case study and implementation guidelines. J Healthc Manag 1998;43:15-35.
6. Bodenheimer T. The American healthcare system--physi-cians and the changing medical marketplace. N Engl J Med 1999;340:584-8.
7. Hochhauser M. Why patients have little patience for report cards. Manag Care 1998;7:31-2,34.
8. Harris N. Report cards, Part 2: How hospitals measure up. Bus Health 1994;12:20-22,24.
9. Voelker R. Do consumers get quality? Bus Health 1999;17:14-9.
10. Chassin MR, Hannan EL, DeBuono BA. Benefits and hazards of reporting medical outcomes publicly. N Engl J Med 1996;334:394-8.
11. Schneider EC, Lieberman T. Publicly disclosed informa-tion about the quality of health care: response of the US public. Qual Health Care 2001;10:96-103.
12. Chen CC, Lin HC, Kuan L. Exploring the Applicable Quality Indictors on Hospital Report Cards in Taiwan. J Taiwan Public Health 2002;21:296-304.
13. Lin HC, Tung YC, Kuo NW, Yang CM, Hsu YH. Identifying Quality Dimensions for Quality Assurance
under the Case Payment System in Taiwan. New Taipei J Med 2002;4:34-43.
14. Lan CF, Hsiung HY, Hwu TJ, Yeh JS. Status Quo of Medical Quality Management in Taiwan. J Med Quality (Chinese) 2000;2:5-12.
15. Davies H. Public release of performance data and quality improvement: internal responses to external data by US health care providers. Qual Health Care 2001;10:104-23. 16. Turner ACT. Review of existing models of reporting to
consumers on health service quality. Royal Women's Hospital. 2000.
17. Sheldon T. Promoting healthcare quality: what role per-formance indicators? Qual Health Care 1998;7 (Suppl):
S45-S50.
18. Epstein AM. Rolling down the runway: the challenges ahead for quality report cards. JAMA 1998;279: 1691-6. 19. Rainwater JA, Romano PS, Antonius DM. The California
Hospital Outcomes Project: how useful is California's report card for quality improvement? Jt Comm J Qual Improv 1998;24:31-9.
20. Wynn P. California medical groups keeping score. Dermatol Times 1999;20:49-51.
21. Bentley JM, Nash DB. How Pennsylvania hospitals have responded to publicly released reports on coronary artery bypass graft surgery. Jt Comm J Qual Improv 1998;24:40-9.
495 52.0% (OR = 8.0; 95% CI 1.8-36.0) (OR = 0.5; 95% CI 0.2-0.9) (ܜطᗁᄫ 2003;26:330-8) έΔᗁጯ̂ጯ ᗁચგநጯࡁտٙ צ͛͟ഇĈϔ઼91ѐ10͡28͟ćତצΏྶĈϔ઼92ѐ1͡28͟Ą ৶פ٩ОώĈڒޮᇉҁरĂέΔᗁጯ̂ጯ ᗁચგநጯࡁտٙĄέΔξӓᎸූ250ཱིĄTel.: (02)23452506ᖼ13; Fax: (02)23758291; E-mail: henry11111@tmu.edu.tw