以電泳及轉漬技術分析不同長度之DNA與金屬微粒之偶合
79
0
0
全文
(2) 以電泳及轉漬技術分析不同長度之 DNA 與金屬微粒之偶合 Application of electrophoresis and blotting for analyzing the conjugation of DNA and metal particles. 研 究 生:陳欣彬 指導教授:楊昀良 博士. Student:Ian-Pan Chan Advisor:Dr. Yun-Liang Yang. 國 立 交 通 大 學 生 物 科 技 學 院 生 物 科 技 研 究 所 碩 士 論 文. A Thesis Submitted to Institute of Biological Science and Technology Department of Biological Science and Technology National Chiao Tung University in partial Fulfillment of the Requirements for the Degree of Master in Biological Science and Technology July 2007 Hsinchu, Taiwan, Republic of China. 中華民國九十六年七月.
(3) 以電泳及轉漬技術分析不同長度之 DNA 與金屬微粒之偶合 學生:陳欣彬. 指導教授:楊昀良 博士 國 立 交 通 大 學 生 物 科 技 學 院 生 物 科 技 研 究 所 碩 士 班. 摘. 要. 利用去氧核糖核酸(DNA)之鏈狀結構作模板製造奈米電導線是很多研究所興趣的 部分。DNA 的好處是它的寬度為 1-2 奈米,其長度卻可以到達微米的等級。此外,專 一的鹼基亙補特性可把 DNA 分子固定在預先選定的表面上,DNA 上的各種功能基可與 很多有機或無機化合物反應以便作更進一步的修飾作用。因此,DNA 成為製造奈米電 導線的理想模板。. 本實驗利用不同長短的 DNA 序列﹝1、3.3、48 kb﹞作模板並在其末端固定磁珠(SA) 及金球(Au)。利用 Klenow 把 Biotin 標記的核苷酸補入 5 端突出的 DNA 上,此兩端有 Biotin 標記的 DNA 再與 Streptavidin 標記的磁珠偶合。實驗結果顯示 Biotin dATP 標記 的 1 和 3.3 kb 片段與 Biotin dCTP 標記的 48 kb 片段兩端都成功的接上磁珠,但 Biotin dATP 標記的 48 kb 片段只有單邊接上且數量很少。實驗的另一部分是利用金硫鍵結把金 球接到 DNA 序列兩端,結果顯示部分 Thiol 標記的 1 和 3.3 kb 片段兩端接上金球,而 Thiol 標記的 48 kb 片段則是兩端都接上金球只是數量很少。. i.
(4) Application of electrophoresis and blotting for analyzing the conjugation of DNA and metal particles Student: Ian-Pan Chan. Advisor: Dr. Yun-Liang Yang Institute of Biological Science and Technology. Department of Biological Science and Technology National Chiao Tung University. Abstract This research is interested in testing the idea of using DNA strand as templates for the fabrication of nanowire. DNA has a favorable aspect ratio of 1-2 nm width, coupled with lengths that can exceed microns. Moreover, the specific base pairing of nucleic acids can be used to localize DNA molecules to predetermined surface locations. Functional groups presented by DNA also make this molecule reactive toward a variety of other organic and inorganic compounds which allows further modification. Thus, DNA template is an ideally suited nanowire fabrication material. In my experiment, BspHI digested the short pGEM-URA3 DNA sequence (1 and 3.3 kb) and the long λDNA sequence (48 kb) were used as a DNA template and the ends were anchored with magnetic beads and Au particles. The 5’end overhang of the DNA was filled in with biotin labeled nucleotides by Klenow and incubated with Streptavidin coated magnetic beads (SA). The data illustrates that most of Biotin dATP filled-in BspHI digested URA3 and Biotin dCTP filled-in λDNA were anchored to SA at both ends. On the other hand, only little Biotin dATP filled-in λDNAs were anchored and mostly at just one end. Another part of the research used thiol-Au linkage. The results show that BspHI digested URA3 with thiol-labeled some were anchored to Au with both end. The thiol-labeled λDNA was anchored to Au at both ends but the quantity was little.. ii.
(5) 誌謝 寫論文寫到現在,終於到了要寫誌謝的時候。這兩年來要感謝的人實在太多 了,首先要萬分感謝的是指導老師楊昀良老師,無論是學術研究或是人生規劃上 都提供了非常寶貴的建議,以後從事這個領域與否,這些教導都是畢生受用。 特別感謝口試委員柯富祥老師、徐琅老師和陳玄芳老師對這篇論文所提供的 建議與指正,與老師們討論實驗真的讓學生獲益良多。還要感謝林志生老師在大 學專題時期的教導,領引學生進入了科學的殿堂。 兩年的實驗室生活真的很愉快,一路上雖然會有挫折焦慮的時候,可是亙相 打打氣又還是可以繼續的走下去。需要感謝的人真的很多,感謝美惠、志豪、怡 瑾、杏枚、秉博、昶文,有您們真好,謝謝您們一直以來的關心和照顧。感謝金 蓉、育穎、晨圃、毓緯兩年來的扶持與加油。感謝淑萍、旻秀、淑貞、敏書,雖 然我是學姐,可是卻經常被包容與照顧,真的非常感謝。此外還要感謝瀞云、柏 伶、佳叡、萍芳、宗翰、至瑩、馨儀、姸寧、毓駿。謝謝您們讓我這兩年的生活 豐富而精彩。 感謝好朋友 fish、小丸、瑜茹、郁文、綿綿、豔玲一路的陪伴。也感謝瑞萍、 毛毛、銘銘、蔡叔叔家、大溪爺爺奶奶們,我覺得我們其實就是一家人。 感謝家人的支持與包容,您們是我努力的原因,謝謝您們愛我。在外面的這 幾年真的讓我學到很多,謝謝您們。 最後,僅以這小小的榮耀獻給所有幫助過我、直接、間接參與此文獻的人。 感謝您們。. iii.
(6) Content Chinese Abstract ................................................................................................................... i English Abstract.................................................................................................................... ii Acknowledgement................................................................................................................. iii Content .................................................................................................................................. iv Content of Tables .................................................................................................................. viii Content of Figures ................................................................................................................ ix. I. Introduction....................................................................................................................... 1 1.1 Nanowires used in Integrated Circuits ....................................................................... 1 1.2 The use of biological tools for nanotechnology ......................................................... 2 1.3 DNA based nanobiotechnology .................................................................................. 2 1.4 Previous research in DNA coupling with metals particles ......................................... 4 1.5 Overview of research project...................................................................................... 4 1.6 Linkage between DNA to Magnetic beads ................................................................. 5 1.7 Linkage between DNA to Au particles ....................................................................... 6 1.8 Stretching DNA for nanowire fabrication .................................................................. 6. II. Material ............................................................................................................................ 8 2.1 Chemicals, enzymes, and reagents ............................................................................. 8 2.2 Buffers ........................................................................................................................ 9 2.3 Medium....................................................................................................................... 10 2.4 Primers........................................................................................................................ 10 2.5 Equipments ................................................................................................................. 10. iv.
(7) III. Methods........................................................................................................................... 12 3.1 Isolation of URA3 plasmid DNA ............................................................................... 12 3.2 Restriction enzyme digestion of pGEM-URA3 ......................................................... 13 3.3 Klenow fill-in ............................................................................................................. 13 3.4 3’End thiol labeling .................................................................................................... 14 3.5 Biotin maleimide was added to the thiol labeled ends of the DNA .......................... 14 3.6 Dot blot of biotin-labeled DNA.................................................................................. 15 3.7 Polymerase chain reaction of λ DNA ......................................................................... 15 3.8 Incubation of biotin-labeled DNA with Streptavidin MagneSphere Paramagnetic particles....................................................................................................................... 16 3.9 Incubation of thiol labeled DNA with Au particles .................................................... 17 3.10 Restriction enzyme digestion of SA or Au conjugated DNA ................................. 17 3.11 Fluorescence staining................................................................................................ 18. IV. Results.............................................................................................................................. 19 4.1 Biotin-labeled DNA incubated with streptavidin coated magnetic beads .................. 19 4.1.1 Obtaining short DNA templates ........................................................................ 19 4.1.2 Obtaining long DNA templates ......................................................................... 19 4.1.3 Dot blot of biotin-labeled DNA......................................................................... 20 4.1.4 Analysis with the gel electrophoresis of the supernatant of the biotin-labeled DNA interacting with streptavidin coated magnetic beads ............................... 21 4.1.5 Dot blot of biotin-labeled DNA with SA after several washed ......................... 22 4.1.6 Restriction enzyme digestion of biotin-labeled DNA with SA after 4 washed . 23 4.1.7 Fluorescence staining of biotin-labeled DNA with SA ..................................... 24 4.2 Thiol-labeled DNA incubated with Au particles ........................................................ 24 v.
(8) 4.2.1 Dot blot of thiol-labeled DNA with biotin maleimide....................................... 24 4.2.2 Analysis with gel electrophoresis of the supernatant of the thiol-labeled DNA interacting with Au particles.............................................................................. 25 4.2.3 Restriction enzyme digestion of thiol-labeled DNA with Au after several washed ........................................................................................................................... 26 4.2.4 Fluorescence staining of thiol-labeled DNA with Au after several washed ...... 27. V. Discussion.......................................................................................................................... 28 5.1 Biotin-labeled DNA incubated with streptavidin coated magnetic beads .................. 28 5.1.1 Fill-in with biotin-labeled dATP or dCTP ......................................................... 28 5.1.2 BaeI digestion for examining the fill-in of λ DNA ........................................... 29 5.1.3 Dot blot of biotin-labeled DNA......................................................................... 29 5.1.4 Supernatant of biotin-labeled DNA interacting with SA................................... 30 5.1.5 Dot blot of biotin-labeled DNA interacting with SA after several washed....... 31 5.1.6 Restriction enzyme digestion of biotin-labeled DNA incubated with SA......... 32 5.1.7 Fluorescence staining of biotin-labeled DNA with SA ..................................... 33 5.1.8 Summary .......................................................................................................... 33 5.2 Thiol-labeled DNA incubated with Au particles........................................................ 34 5.2.1 Dot blot thiol-labeled DNA incubated with biotin maleimide .......................... 34 5.2.2 Analysis with gel electrophoresis of the supernatant of the thiol-labeled DNA interacting with Au particles.............................................................................. 35 5.2.3 Restriction enzyme digestion of thiol-labeled DNA with Au after several washed ........................................................................................................................... 35 5.2.4 Fluorescence staining of thiol-labeled DNA with Au particles......................... 37 5.2.5 Summary............................................................................................................ 37. vi.
(9) VI. Future Work ................................................................................................................... 39. VII. References...................................................................................................................... 40. vii.
(10) Content of Tables 1. Result of biotin-labeled DNA anchored to streptavidin coated magnetic beads ................ 45 2. Result of thiol-labeled DNA anchored to Au particles ....................................................... 46. viii.
(11) Content of Figures 1. Strategy and the flow chart of the experiments in this study.............................................. 47 2. Strategy of the 5’ end overhang DNA filled in by Klenow ................................................ 48 3. Strategy of 3’ end thiol-labeled DNA incubated with Au particles .................................... 49 4. Restriction enzyme digestion of pGEM-URA3.................................................................. 50 5. BaeI digestion of λ DNA filled in with biotin-labeled nucleotides .................................... 51 6. Dot blot of biotin labeled DNA incubated with streptavidin peroxidase polymer ............. 52 7. Supernatant of the biotin-labeled DNA incubated with streptavidin coated magnetic beads (SA) .................................................................................................................................. 54 8. Dot blot of biotin-labeled DNA incubated with SA after several washes .......................... 55 9. Restriction enzyme HincII digestion of BioA-BspHI-URA3-SA after washed 4 times .... 57 10. Restriction enzyme SmaI digestion of BioA-λ DNA-SA and BioC-λ DNA-SA after washed 4 times ............................................................................................................... 58 11. Fluorescence staining of biotin labeled BspHI-digested URA3 incubated with SA ........ 59 12. Fluorescence staining of biotin-labeled λ DNA incubated with SA................................. 60 13. Dot Blot of thiol-labeled DNA incubated with biotin maleimide .................................... 62 14. Thiol-labeled DNA incubated with Au particles .............................................................. 63 15. Restriction enzyme digestion of thiol-labeled DNA incubated with Au after washed 4 times ................................................................................................................................. 64 16. Fluorescence staining of thiol-labeled BspHI digested URA3 incubated with Au........... 65 17. Fluorescence staining of thiol-labeled λ DNA incubated with Au ................................... 67. ix.
(12) I. Introduction 1.1 Nanowires used in Integrated Circuits The demand for integrated circuits that will allow information be processed at even faster speeds remains undiminished. Currently, most integrated circuits are constructed by optical lithography, which in present commercial fabrication lines allows feature sizes to be constructed in the 30 nm range [Electronic News, 2006]. This is despite the fact that, as a result of miniaturization, the density of wires and switches that comprise such circuits has doubled every eighteen months, giving rise to Moore’s Law [Moore, 1965]. While it appears certain that Moore’s Law will hold true until 2016, it is not certain that it will hold true thereafter for two reasons. The first reason is that to build smaller wires and switches using established fabrication and materials technologies will require major scientific and technological advances. Specifically, it will require the development at great cost of new light sources and process tools; new mask and resist materials; and new high and low dielectric constant materials. The second reason is that as wires and switches become smaller the materials of which they are composed no longer exhibit bulk properties, but exhibit properties dominated by confinement and surface effects [Stanca et al., 2006]. As a consequence these wires and switches may exhibit novel characteristics. In other context this will represent a new opportunity; in this context it will represent a major challenge. There have been two principal responses of the related scientific and engineering communities. The first response has been to develop alternative fabrication and materials technologies. The second response has been to propose new integrated circuit architectures that can accommodate or even exploit the novel characteristics exhibited by these smaller wires and switches. When contemplating alternative fabrication technologies, one is attracted to the self. 1.
(13) assembly in solution and self organization at a conventionally patterned silicon wafer substrate of nanoscale wires and switches. When contemplating alternative materials technologies, one is attracted to the use of biological molecules as templates and nanoparticles as building blocks. [Niemeyer et al., 2001; Parak et al., 2003]. 1.2 The use of biological tools for nanotechnology Many functional biological assemblies represent genuine nanotechnological systems and devices [Sarikaya et al., 2003]. These nano-objects are formed by the process of self-assembly, facilitated by molecular recognition events between building blocks, resulting in the formation of functional devices. Even the simplest living organism contains functional complex elements such as motors, pumps, and cables, all functioning at the nanoscale [Drexler, 1981]. Much research is being devoted to the use of nanotechnology tools for the advancement of biology (bionanotechnology) [Wilkinson, 2003]. This is directly related to the use of nanotechnology to address biological and medical needs. However, the reverse research direction is also very interesting and it involves the use of ordered biological building blocks for the fabrication of various non-biological nanostructures [Taton, 2003]. In recent years there has been increasing interest in the utilization of biological tools for nanotechnological applications that are not related to biology such as micro-electronics and nanoelectronics,. microfluidics. and. nanofluidics,. and. microelectromechanical. and. nanoelectromechanical systems [Gazit, 2007]. The biological building blocks include proteins, peptides, nucleic acids, bacteriophages, and plant viruses. These biologically templated nanostructures may have applications in diverse fields that are very remote, such as electronics, telecommunication, and materials engineering.. 1.3 DNA based nanobiotechnology DNA-based nanobiotechnology holds the promise of allowing the bottom-up self 2.
(14) assembly of complex nanodevices. This great potential lies in the molecular recognition capability of DNA and the ability to synthesize DNA molecules having specific sequences. Therefore, considerable effort has been dedicated to developing DNA templates nanostructures that can be integrated into more complex nanodevices. Self assembly of such devices could potentially reduce time and costs inherent in current nanofabrication methods and provide smaller, more reliable devices. The linear dsDNA has a width of 2 nm and a length of 0.34 nm per nucleoside subunit. A wide range of molecular lengths, from nanometers to microns, can be realized with established technology in molecular biology, for example DNA ligation, enzymatic digestion, and polymerase chain reaction. DNA templated nanowires could be prepared with an almost unlimited range of aspect ratio. A DNA molecule has two classes of binding site: negatively charged phosphate group and aromatics bases [Gu et al., 2006]. The polyanionic backbone of the molecule, composed of alternating sugar and phosphate groups, binds metallic cations or cationic nanoparticles by electrostatic interaction. Various transition metal ions bind to the nitrogen atoms of the DNA bases and form metal DNA complexes by coordination coupling involving two d orbitals. For example, the N7 atoms of bases guanine and adenine form strong complexes with Pt(II) and Pd(II) ions [Takahara et al., 1995; Huang et al., 1995; Onoa et al., 1998], and the N3 atoms of the bases thymine and cytosine strongly interact with Pd(II) ions [Duguid et al., 1993]. Both classes of binding site have been utilized in nanowire fabrication [Braun et al., 1998; Becerril et al., 2004; Gu et al., 2005; Mertig et al., 2002; Monson et al., 2003]. DNA is also uniquely suited to molecular recognition in the way known as Watson-Crick base pairing: A pairs specifically with T and G pairs specifically with C. The specific molecular recognition capability could possibly be used to localize DNA molecules to predetermined surface locations and to bind oligonucleotide-coupled nanoparticles to specific regions on DNA templates. Thus, DNA is ideally suited nanofabrication template material 3.
(15) [Stoltenberg et al., 2004].. 1.4 Previous research in DNA coupling with metals particles In the early work in this area, Alivisatos et al. (1996) and Mirkin et al. (1996) exploited the molecular recognition properties of DNA to assemble nanoparticles into organized structures with nanoscale precision. Later in 1998, Braun et al. used complementary ssDNA to bridge a 12 µm long, 100 nm wide conductive silver wires. Other seminal work paved the way to formed a gold nanowires based on the use of a DNA template. This was achieved by the intercalation of functional gold nanoparticles into dsDNA, followed by covalent photochemical attachment of the intercalater [Patolsky et al., 2002]. The use of metal-coated DNA molecules was also demonstrated for DNA-assisted wiring of Au electrodes on silicone wafers [Griffin et al., 2004] and for the specific metallization of a Y-shaped DNA that incorporated a central biotin moiety [Stanca et al., 2006]. These patterned and directed metallization schemes hold promises for novel applications in the design and manufacture of nanoelectronic devices in the future. Although lithography methods are constantly being improved, template-assisted nanowire formation may be very useful for making interconnections between lithographically defined elements [Shacham-Diamand et al., 2003].. 1.5 Overview of research project Because of DNA has low inherent conductivity [Merkoci, 2007], electrical activation of DNA is essential for the construction of nanowires in DNA based nanocircuitry. So there are two key issues needing to be solved: (1) specifically depositing and aligning DNA molecules on surfaces and (2) modifying those molecules to create conductive nanowires [Stolenberg et al., 2004]. My research focused on the first issue concerning about how to specifically depositing dsDNA molecules on the surface by using either magnetic beads or Au particles anchored at 4.
(16) the both ends of DNA. Magnetic beads and Au particles seem to be the most desired particles because of their unique native properties [Kouassi et al., 2006]. Magnetic beads owe their popularity to their numerous attributes such as their magnetic properties that enable them to be directed by an external magnetic field, the possibility to separate them from a reaction mixture, in addition to their low toxicity and biocompatibility [Kouassi et al., 2006]. Considerable interest over the past two decades has been directed toward the using of Au particles with biotechnology because of their excellent biocompatibility, stability and established manufacturing protocols. Furthermore, the use of thiol chemistry on a gold surface allows the attachment of molecules with a relative with using a variety of thiol linker [Minard-Basquin et al., 2005; Demers et al., 2000].. 1.6 Linkage between DNA to Magnetic beads In this study, the interaction between biotin and streptavidin was used to anchor both ends of DNA to magnetic beads. Streptavidin is a 60 kilo-dalton tetrameric protein isolated in crystalline form from culture filtrates of Streptomycetes avidinii [Chaiet et al., 1964]. Streptavidin has no carbohydrate and an acidic isoelectric point of 5. Streptavidin is much less soluble in water than avidin and can be crystallized from water or 50% isopropanol. Streptavidin is rich in tryptophan [Hoffman et al., 1980] and is highly resistant to denaturation by acids or proteolytic enzymes. It is even more resistant than avidin to dissociation into subunits by guanidine hydrochloride. Biotin is a 244 dalton vitamin found in tissue and blood and binds with high affinity to streptavidin. The structure of the streptavidin-biotin complex has been described by several groups [Weber et al., 1989; Hendrickson et al., 1989], showing a β-barrel structure of streptavidin binding biotin into its interior. The streptavidin-biotin interaction is the strongest known noncovalent, biological recognition with dissociation constant Kd = 4*10-14 M. The 5.
(17) bond formation between biotin and streptavidin is very rapid and once formed is unaffected by extremes of pH, organic solvents and other denaturing agents [Tong et al., 1992]. The strong interaction has led to a large number of research and diagnostic applications using streptavidin-biotin technology. The strength and reliability of the interaction underlie its importance in biotechnology, but the interaction is also a model for high affinity receptor ligand binding. In most assays, streptavidin is coupled to a solid phase, such as magnetic bead, a microtiter plate or a biosensor chip, while biotin is coupled to the moiety of the interest, often a nucleic acid, protein or antibody [Holmberg et al., 2005].. 1.7 Linkage between DNA to Au particles Another technique is to use the linkage between thiol and Au to anchor both ends of DNA to Au particles. The Au-thiolate bond is a strong-homolytic bond strength 44 kcal/mol and contributes to the stability of the SAMs together with the Van der Waals forces between adjacent methylene groups, which amount to 1.4-1.8 kcal/mol [Rong et al., 2001]. Hence, Au binds thiols with high affinity and it does not undergo any unusual reactions with them, e.g., the formation of a substitutional sulfide interphase. The strong interaction has led to a large number of research and diagnostic applications using Au-thiol technology. Therefore, by using a thiol modified nucleotides incorporated into the templated DNA in my research, the DNA will be possible to link to Au and for further analyzed.. 1.8 Stretching DNA for nanowire fabrication At equilibrium, a DNA molecule in aqueous solution will usually be randomly structured as a result of thermal fluctuations. Entropy will shorten the end-to-end distance, often to a much smaller size than the contour length. A DNA molecule therefore must be stretched to serve as a nanowire template. Many approaches have been used to stretch and align DNA molecules, including molecular combing [Gueroui et al., 2001; Otobe et al., 2001; Yokota et 6.
(18) al., 1997], electrophoretic stretching [Kaji et al., 2002; Namasivayam et al., 2002], hydrodynamic stretching [Ye et al., 2000], and van der Waals interaction [Bezryadin et al., 2004]. Molecular combing is the simplest method of stretching DNA templates in nanowire fabrication and thus the most widely used one. No chemical modification of DNA molecules is required. Combing can be done on various hydrophobic and hydrophilic surfaces, and it can yield well dispersed and strongly bound to the substrate, a situation favorable for subsequent metallization and characterization of nanowires. Both direct current (DC) and alternating current (AC) electric fields can be used to stretch DNA. An advantage of the electrophoretic approach is that nanowire templates can be stretched and positioned directly between electrodes. After metallization, electrical properties of nanowires connecting two electrodes can readily be characterized. DNA must be modified by thiolation or biotinylated to be stretched by a DNA field. Otherwise, optical tweezers must be used to tether one end of a DNA molecule before stretching. Stretching by dielectrophoresis does not require chemical modification. Spin stretching is a simplified hydrodynamic stretching without the requirement of chemical modification of DNA.. 7.
(19) II. Material 2.1 Chemicals, enzymes, and reagents z. Alfa Aesar [六和]: Au particles (Cat. No .00765). z. Amresco [波仕特]: Agarose I (Cat. No. 0710-500G) Ethidium bromide (Cat. No. X328) Glycerol (Cat. No. 0854-1L-PTM) Phenol saturated solution (Cat. No. 0945) Tris-Hydrochloride (Cat. No. 0234-500G). z. Amersham Biosciences [伯新]: Nitrocellulose Memebrane (Cat. No. FM0053-1). z. Anchor [安佳]: Non fat Milk (Cat. No. EMB53084-D). z. AppliChem [仲群]: Ampicillin (Cat. No. A2839). z. Bio-Rad [汎泰]: Ethylenediaminetetraacetic acid (EDTA) (Cat. No. 161-0729). z. Fermentas [進階]: dNTP set (Cat. No. R0181) SmaΙ (Cat. No. ER0661) Taq (Cat. No. EP0401). z. Invitrogen [德怡]: Biotin-14-dATP (Cat. No. 19524-016) Biotin-14-dCTP (Cat. No. 19518-018). z. Kodak [泰歷]: X-film (Cat. No.1651454) GBX Developer and Replenisher (Cat. No. 8875569) GBX Fixer and Replenisher (Cat. No. 1749837). z. Merck [Merck]: Sodium acetate (Cat. No.1.06267.0500). z. MILLIPORE [騰達行]: Chemiluminescent HRP substrate (Cat. No.WBKLS0500). z. Molecular Probes [德怡]: YOYO-1 (Cat No. Y3601). z. NEB [諾貝爾]: Klenow (Cat. No. M0210L) BaeI (Cat. No. R06131L). 8.
(20) BspHI (Cat. No. R0517S) z. Panreac [仲群]: Potassium chloride (Cat. No. 131494) Potassium dihydrogen phosphate (Cat. No.121509). z. Promega [勁因]: Streptavidin MagneSphere Paramagnetic particles (Cat. No. Z5481). z. Premier [全盟]: ExcelPureTM Plasmid Mini Kit (Cat. No. PM250) ExcelPureTM PCR Cleanup Kit (Cat. No. CU250). z. Riedel-deHaen [六和]: Sodium chloride (Cat. No. 13423) Sodium hydroxide (Cat. No. 30620) Sodium phosphate dibasic (Cat. No. 30427). z. Scharlau [啓新]: LB broth (Cat. No. 02-385). z. SibEnzyme [百錬]: 1 kb DNA ladder (Cat. No. SEM11C001). z. Sigma [六和]: Phenol (Cat. No. P-4682) Streptavidin−Peroxidase Polymer (Cat. No. S2438) Tween 20 (Cat. No. P-1379). z. TaKaRa [日興]: λ DNA (Cat. No. TAK3010) HincII (Cat. No. 1059A). z. Vector Laboratories [嘉旺]: 3' EndTag DNA Labeling System (Cat. No. MB-9002) Biotin (Long Arm) Maleimide (Cat. No. SP1501). 2.2 Buffers z. 5 M EDTA solution 186.1 g EDTA in ddH2O to total volume of 800 ml (pH 8.0). Adjust the pH to 7.4 with HCl, and add ddH2O to 1 liter. z. 50 X TAE buffer 48.4 g Tris base, 0.5 M EDTA (pH 8.0) 20 ml, 11.42 ml acetic acid, add ddH2O to 200 ml. z. 1 X PBS 9.
(21) 8 g NaCl, 0.2 g KCl, 1.44 g Na2HPO4 and 0.24 g KH2PO4 in 800 ml of ddH2O. Adjust the pH to 7.4 with HCl, and add ddH2O to 1 liter z. 10 X TE buffer 100 mM Tris-Cl (pH 8.0), 10 mM EDTA. 2.3 Medium z. LB (Luria-Bertni)/ Ampicillin 1 % tryptone, 0.5 % yeast extract, 1 % NaCl, 50 µg/ml Ampicillin. 2.4 Primers Name. Sequence (5’→3’). Location. Lambda F. GCATGGAGGACACGGAGGAAGG. 18152~18173. Lambda R. GTTCCGGCGGGCTGTCATAA. 19605~19624. 2.5 Equipments z. -20℃ low temperature refrigerator (WHITE-WESTINGHOUSE). z. -80℃ low temperature refrigerator 925/926 (FIRSTEK SCIENTIFIC). z. Bench top orbital shaker S101 (FIRSTEK). z. Centrifuge model 5100 (Kubota Corporation). z. Digital scale PB153-S (METTLER TOLEDO). z. Digital scale TB-214 (DENVER INSTRUMENT). z. GeneQuant pro DNA/RNA calcul ator (AMERSHAM PHARMACIA BIOTECH). z. Gene CyclerTM (BIO-RAD). z. Image system GEL DOC 2000 (BIO-RAD). z. Microcentrifuge MICRO 240A (DENVILLE SCIENTIFIC INC.). z. Orbital shaker IKA-VIBRAX-VXR 10.
(22) z. pH meter Φ360 (BACKMAN). z. 4℃ refrigerator KS-101MS (MINI KINGCON). z. Spectrometer 20GENESYS RT(SPECTRONIC INSTRUMENTS). z. Shaker VORTEX-GENIE2 G560 (SCIENTIFIC INDUSTRICS). z. Thermal Cycler PTC-100RT (MJ RESEARCH INC.). z. UV crosslinker XL-1000 (SPECTRONICS). z. VORTEX-GENIE2 G560 (SCIENTIFIC INDUSTRICS). z. Water bath B206-T1 (FIRSTEK SCIENTIFIC). z. Fluorescence Microscope ECLIPSE TE2000-U (NIKON). 11.
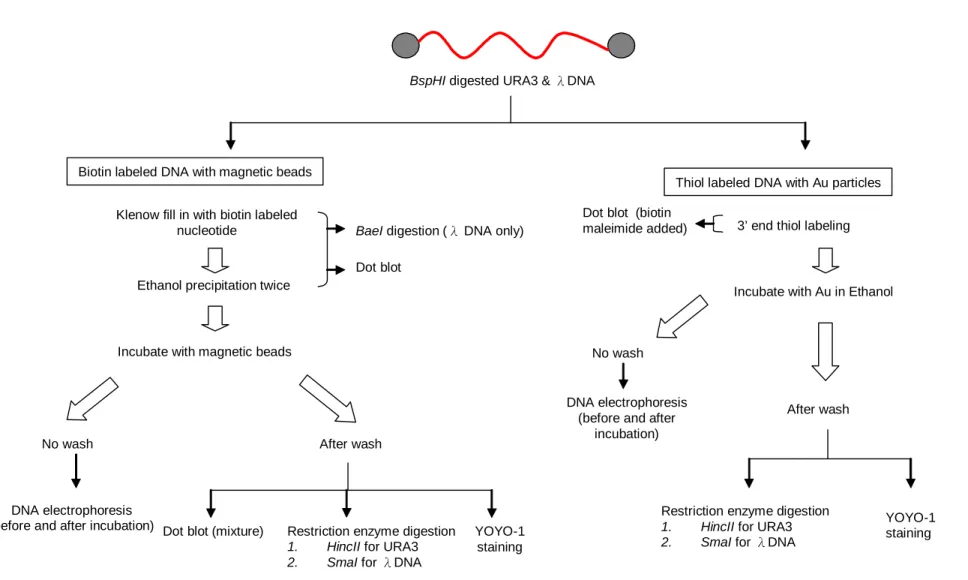
(23) III. Methods The overall strategy and the flow chart were illustrated in Figure 1. In this study, two different DNAs were used for assessing the techniques of anchoring the ends to the Magnetic beads and Gold particles. One was the linearized pGEM-URA3, 4.4 kb in length. The other is the linear genome of λ phage 48 kb.. 3.1 Isolation of URA3 plasmid DNA The pGEM-URA3 plasmid in E. coli was extracted with ExcelPureTM Plasmid Miniprep Purification Kit (Premier, Cat. No. PM250). The procedure is as following: The E. coli with the pGEM-URA3 plasmid was inoculated in 5 ml LB broth with 50 µg/ml ampicillin, grew at 37 ℃ overnight with vigorous shaking (~180 rpm). 1.5 ml of E. coli solution was transferred to an eppendorf tube. The cells were recovered by centrifugation at 13000 rpm for 1 minute and then resuspended in 200 µl Solution I buffer (Premier, Cat. No. PM250). 200 µl of Solution II buffer (Premier, Cat. No. PM250) was added to the mixture which was then mixed gently. Then 200 µl of Solution III buffer (Premier, Cat. No. PM250) was added and mixed gently again. Cells were spun at 13000 rpm for 5 minutes at room temperature. The supernatant was transferred to Mini-MTM Column (Premier, Cat. No. PM250) and spun at 13000 rpm for 1 minute. The filtrate in the collection tube was discarded. 700 µl of Wash Solution (Premier, Cat. No. PM250) was added and spun for 1 minute. The filtrate was discarded. This washing step was repeated once again. After the filtrate was discarded, the column was centrifuged at 13000 rpm for 3 minutes to remove residual ethanol. Mini-MTM column was then transferred to a new eppendorf and incubated at 60 ℃ for 5 minutes to evaporate the ethanol. Finally, the DNA was eluted by 50 µl ddH2O and spun at 13000 rpm for 1 minute. The pGEM-URA3 plasmid was stored at -20 ℃.. 12.
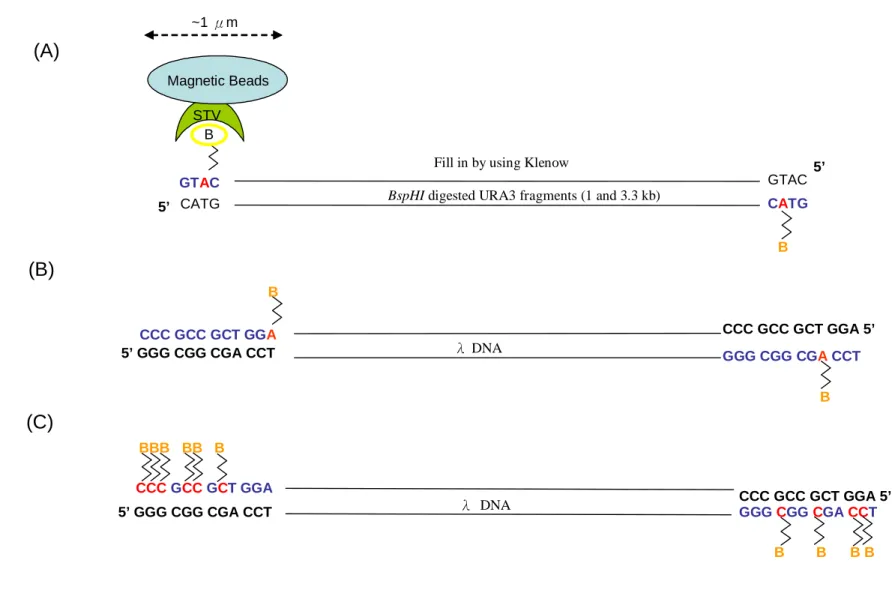
(24) 3.2 Restriction enzyme digestion of pGEM-URA3 The pGEM-URA3 plasmid was digested into 1008 bps and 3342 bps short DNA fragments with 5’end overhangs by restriction enzyme BspHI. The 40 µg of pGEM-URA3 plasmid was dissolved in appropriate volume of ddH2O and was digested with BspHI (NEB, Cat. No. R0517S). Generally, 1 µg DNA was digested with 1 unit of restriction enzyme in a 10 µl reaction volume at 37 ℃ for 2 hours. The reaction was stopped by heating in 65 ℃ for 20 minutes. In order to change the solution from digestion buffer to ddH2O, the digested product was cleaned up by ExcelPureTM PCR Cleanup Kit (Premier, Cat. No. CU250). 500 µl binding buffer (Premier, Cat. No. CU250) was added to the reaction product and the mixture was vortexed briefly. The mixture was then transferred to Mini-MTM Column (Premier, Cat. No. CU250) and the column was spun at 13000 rpm for 1 minute. The filtrate in the collection tube was discarded. 700 µl of Washing Solution (Premier, Cat. No. CU250) was added and the column was spun for 1 minute. The filtrate was discarded. This washing step was repeated once again. After the filtrate was discarded, the column was centrifuged at 13000 rpm for 3 minutes to remove residual ethanol. Mini-MTM column was transferred to a new eppendorf and incubated at 60 ℃ for 5 minutes to evaporate the ethanol. Finally, the DNA was eluted by 40 µl ddH2O and the column was spun at 13000 rpm for 1 minute. The DNA was stored at -20 ℃.. 3.3 Klenow fill-in The strategy and the numbers of biotin-labeled nucleotides filled in were showed in Figure 2. The BspHI digested URA3 was filled in with biotin dATP to produce 1 biotin labeling on both ends. The 12 bp 5’overhang of λ DNA was either filled in with biotin-labeled dATP (Invitrogen, Cat. No. 19524-016) to produce 1 biotin labeling on both ends, or filled in with 13.
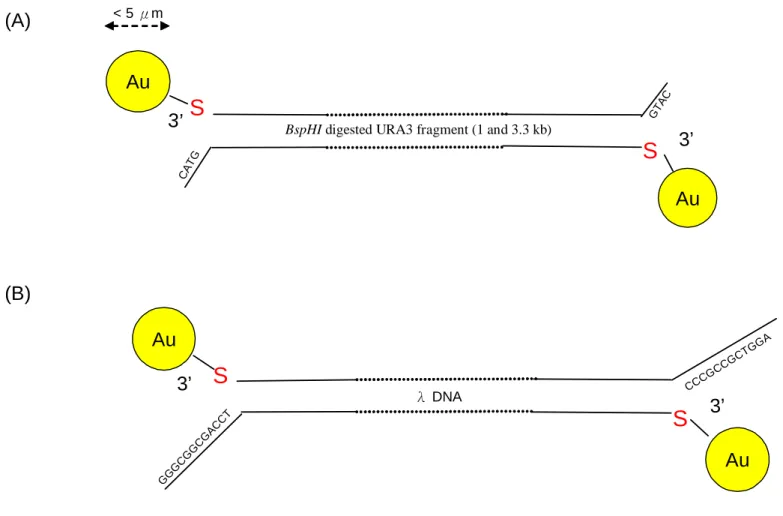
(25) biotin dCTP (Invitrogen, Cat. No. 19518-018) to produce 4 and 6 biotin labeling on its ends. The fill-in reaction was performed with DNA polymerase I, large (Klenow) fragment (NEB, Cat. No. M0210L). 15 µg DNA (λ DNA was heated at 65 ℃ for 5 minutes before the reaction) was dissolved in 1X buffer 2 (NEB, Cat. No. M0210L) containing 20 µM non-target nucleotides and 10 µM non-biotin-labeled target nucleotide and 10 µM biotin-labeled target nucleotide in 50 mM pH 7.8 Tris-Cl, 5 mM MgCl2 and 10 µg/µl BSA. The control was filled in in 1 X buffer 2 containing 20 µM dNTPs with 50 mM pH 7.8 Tris-Cl, 5 mM MgCl2 and 10 µg/µl BSA. 15 unit of Klenow was added to reaction with total volume 150 µl and incubated at 25 ℃ for 15 minutes. The reaction was stopped by 10 mM pH 8.0 EDTA and heating at 75 ℃ for 20 minutes. The fill-in product was cleaned up by adding 1/10 volume 3 M pH 5.2 sodium acetate and 2.2 volume -20 ℃ 99.5% ethanol. It was kept in -20 ℃ for 2 hours then spun for 13000 rpm for 10 minutes. The supernatant was discarded and the pellet was dried for 5 minutes at room temperature. After that the pellet was dissolved in 100 µl ddH2O. Ethanol precipitation was repeated once. Finally, the pellet was dissolved in 100 µl ddH2O.. 3.4 3’ end thiol labeling The strategy of 3’ end thiol-labeling was shown in Figure 3. The 3’ end thiol-labeled DNA was obtained from using 3' EndTag DNA Labeling System (Vector Laboratories, Cat. No. MB-9002). The reaction was set up by combining 0.5 nmols of 3’ end DNA in ≦ 14 µl , 2 µl 10X TdT reaction buffer (Vector Laboratories, Cat. No. MB-9002), 2 µl SH-GTP (Vector Laboratories, Cat. No. MB-9002) and 2 µl TdT (Vector Laboratories, Cat. No. MB-9002) in a microcentrifuge tube. The total reaction volume was brought to 20 µl with ddH2O and the reaction incubated for 30 minutes at 37℃.. 3.5 Biotin maleimide was added to the thiol labeled ends of the DNA 14.
(26) 10 µl biotin maleimide (Vector Laboratories, Cat. No. SP1501) was added to the thiol-labeled DNA. The reaction was mixed well and incubated for 30 minutes at 65 ℃. Then 70 µl ddH2O and 100 µl of buffered phenol were added to the mixture and vortexed briefly. The reaction was then spun at 7200 rpm for 5 minutes and the upper aqueous layer was transferred to a new eppendorf tube. 5 µl precipitant (Vector Laboratories, Cat. No. MB-9002) and 300 µl of 95% ethanol was mixed with the aqueous fraction. The precipitated nucleic acid was pelleted by centrifugation at 13000 rpm for 15 minutes, and then the pellet was washed briefly with 70% ethanol and centrifuged for 3 minutes at 13000 rpm. The pellet was air dried at room temperature for 5 minutes and resuspended in 20 µl ddH2O.. 3.6 Dot blot of biotin-labeled DNA The biotin-labeled DNA is captured by Streptavidin-Peroxidase Polymer (SIGMA, Cat. No. S2438) and can be detected by dot blot analysis. The procedure is as following: The 1 µl biotin-labeled DNA or biotin-labeled DNA with streptavidin coated magnetic beads (Promega, Cat. No. Z5481) were spotted onto the nitrocellulose membrane (Amersham Biosciences, Cat. No. FM0053-1) and crosslinked by UV with 0.12 joules twice. The membrane was then blocked with 5 % non-fat milk in 1X pH 7.4 PBS with 0.05 % TWEEN 20 at 4 ℃ overnight. The membrane was washed with 1X PBS with 0.05 % TWEEN 20 for 5 minutes twice. Then the membrane was incubated with 1.5 µg Streptavidin-Peroxidase Polymer in 3 ml 1X PBS with 0.05 % TWEEN 20 at room temperature for 3 hours. The membrane was washed with 1X PBS with 0.05 % TWEEN 20 for 5 minutes six times. The membrane was incubated with Chemiluminescent HRP substrate (MILLIPORE, Cat. No.WBKLS0500) for 1 minute. Then it was covered with Saran wrap after removing the excessive solution from the surface, then exposed to X-ray film in the dark room for proper exposure time.. 3.7 Polymerase chain reaction of λ DNA 15.
(27) The 1.5 kb PCR product of λ DNA was amplified by the method of PCR with the Lambda F and Lambda R primer pair. The sequence of Lambda F is 5’GCATGGAGGACACGGAGGAAGG. -3’;. Lambda. R. is. 5’-. GTTCCGGCGGGCTGTCATAA -3’. Each reaction mixture (50μl) contains 60 ng of λ DNA, 1 μM of Lambda F and Lambda R primer pair, 0.2 mM of dNTPs (Fermentas, Cat. No. R0181), 2 mM of MgCl2 (Fermentas, Cat. No. EP0401), 1.25 unit of Taq DNA polymerase (Fermentas, Cat. No. EP0401), and 5 μl of 10X Taq Buffer with KCl (Fermentas, Cat. No. EP0401). The PCR conditions were as following: activation of Taq DNA polymerase for 5 minutes at 95 ℃, followed by 36 cycles of 1 minute of denaturation at 95 ℃, 45 seconds of annealing at 58 ℃, and 1 minute of extension at 72 ℃. Finally, the reaction was extended at 72 ℃ for 5 minutes. In order to check the PCR result, 2 μl of PCR product was analyzed on 1 % agarose gel electrophoresis. In order to change the solution from reaction buffer to ddH2O, the PCR product was cleaned up by ExcelPureTM PCR Cleanup Kit (Premier, Cat. No. CU250). 500 µl binding buffer was added to the reaction product and the mixture was vortexed briefly. The mixture was then transferred to Mini-MTM Column and the column was spun at 13000 rpm for 1 minute. The filtrate in the collection tube was discarded. 700 µl of Washing Solution was added and the column was spun for 1 minute. The filtrate was discarded. This washing step was repeated once again. After the filtrate was discarded, the column was centrifuged at 13000 rpm for 3 minutes to remove residual ethanol. Mini-MTM column was transferred to a new eppendorf and incubated at 60 ℃ for 5 minutes to evaporate the ethanol. Finally, the DNA was eluted by 40 µl ddH2O and the column was spun at 13000 rpm for 1 minute. The DNA was stored at -20 ℃.. 3.8 Incubation of biotin-labeled DNA with Streptavidin MagneSphere Paramagnetic particles 16.
(28) 100 μg streptavidin-coated magnetic beads (SA) with diameter 1 µm was resuspended by gently flicking the bottom of the tube until the particles were completely dispersed, and captured them by placing the tube in the magnetic stand until the SA have collected at the side of the tube approximately 30 seconds. Then carefully removed the supernatant and washed the SA with 100 µl 0.5 M NaCl in 1X TE for 5 times. After each washed, the SA was captured with the magnetic stand and carefully removed the washing solution. Finally, the liquid was removed as much as possible without disturbing the SA. The biotin-labeled DNA and PCR product of λ DNA with 0.5 M NaCl as a control were added to the SA and incubated at room temperature for 1 hour with gently flicking the tube every 1-2 minutes. The biotin-labeled DNA and PCR product of λ DNA with SA was then washed with 200 µl 0.5 M NaCl in 1X TE for 4 times. Finally the mixture was resuspended in 100 µl 0.5 M NaCl in 1X TE.. 3.9 Incubation of thiol labeled DNA with Au particles 160 µg Au particles (Alfa Aesar, Cat. No .00765) of which the diameter was 5 µm were resuspended with 40 µl 99.5 % ethanol by gently flicking the bottom of the tube until the particles were completely dispersed. Then, 10 µl thiol-labeled DNA and PCR product of λ DNA were added and the mixture was left for 1 hour at 65 ℃ with gentle mixing by inversion every 1-2 minutes. After that the cap of the eppendorf was opened at 65 ℃ and let the ethanol to be evaporated. The mixture was resuspended in 40 µl ddH2O. The Au particles were captured by spun in 6000 rpm for 10 seconds and carefully removed the supernatant without disturbing the Au particles. Then the particles was washed 200 µl 1 X pH 7.4 PBS twice. Finally the mixture was resuspeneded in 40 µl ddH2O.. 3.10 Restriction enzyme digestion of SA or Au conjugated DNA 1 µg BspHI digested URA3 with SA or Au particles were digested with 2.5 units of restriction 17.
(29) enzyme HincII (TaKaRa, Cat. No. 1059A) in 12 µl reaction volume at 37 ℃ for 2 hours. The reaction was stopped by heating at 65 ℃ for 20 minutes. 1 µg λ DNA with SA or Au particles were digested with 2.5 units of restriction enzyme SmaI (Fermentas, Cat. No. ER0661) in 12 µl reaction volume at 30 ℃ for 2 hours. The reaction was stopped by heating at 65 ℃ for 20 minutes.. 3.11 Fluorescence staining 100 µl biotin labeled DNA conjugated with SA was captured with a magnetic stand. And the 50 µl thiol labeled DNA with Au particles was spun at 6000 rpm for 10 seconds. The supernatant was carefully removed without disturbing the particles. Then the particles were incubated with 200 µl 1 µM YOYO-1 (Molecular Probes, Cat No. Y3601) in dark at room temperature for 30 minutes. After that the DNA-conjugated particles were washed with 200 µl 1X PBS twice by gently flicking the bottom of the tube until all of the particles were resuspended, the particles were captured again. Finally, the particles were resuspended in 200 µl 1X PBS. 10 µl particles was dropped to the slides and placed a 180 * 180 mm coverslip on it, the slide was sealed with nail polish. Then the samples were viewed with a fluorescence microscope with a standard fluorescent filter set.. 18.
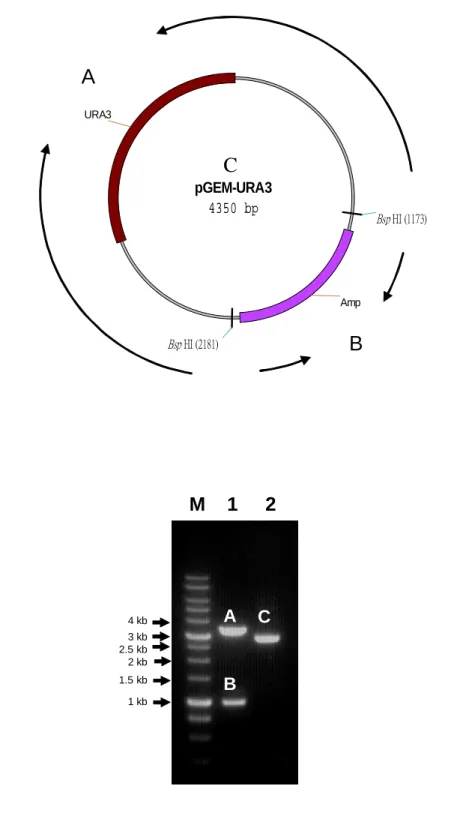
(30) IV. Result In this study, two different DNAs were used for assessing the techniques of anchoring the ends to either Magnetic beads and or particles. One was the pGEM-URA3, 4.4 kb in length (Figure 4A), linearized into 3.3 kb and 1 kb fragments. The other is the linear genome of λ phage, 48 kb.. 4.1 Biotin-labeled DNA incubated with streptavidin coated magnetic beads 4.1.1 Obtaining short DNA templates The pGEM-URA3 plasmid was digested into 3.3 kb and 1 kb short DNA fragments with 5’ end overhang by BspHI as shown in the band A and B of Figure 4B, and the band C in lane 2 was undigested pGEM-URA3 plasmid. The 3.3 kb and 1 kb fragments were named BspH-URA3-A and BspHI-URA3-B and were used as the short template DNAs. The 4 bp 5’ overhang of the BspHI-digested URA3 (BspH-URA3-A and BspHI-URA3-B) were filled in with biotin-labeled dATP and non-biotin-labeled dNTPs by Klenow. The control was filled in with non-biotin-labeled dNTPs only, after that the fill-in products were cleaned up by ethanol precipitation twice.. 4.1.2 Obtaining long DNA templates For the long DNA template, the 12 bp 5’ overhang of λ DNA was filled in with either biotin-labeled dATP or dCTP mixed in non-biotin-labeled dNTPs (with the ratio 1:2) by Klenow. Some were filled in with non biotin-labeled dNTPs as control, and then the products were cleaned up by ethanol precipitation twice. The fill-in λ DNA was then subjected to BaeI digestion to examine whether the fill-in of λ DNA was successful. Because of the 12 bp complementary 5’ end overhang, some of the λ DNA will form circular form DNA spontaneously. Only if the sticky end is filled in and. 19.
(31) turned into blunt end, will the λ DNA become linear form. There are 10 BaeI cutting sites on λ DNA. For a linear form λ DNA after BaeI digestion, there will be 11 digestion fragments. The sizes of the fragments are 694, 6971, 5602, 2508, 496, 2461, 377, 2670, 22197, 4409, 117 bps. If the λ DNA is in circular form, then after digestion, some of the 694 bps and 117 bps fragments will appear as 801 bps fragment (shown in Figure 5A). Therefore the appearance of the 801 bps DNA fragment can be the maker to monitor the Klenow fill-in reaction. The 5’ overhang of λ DNA was filled in with biotin-labeled dATP or dCTP and mixed in non-biotin-labeled dNTPs and incubated with Klenow for 15, 30, 60 minutes. The mixtures without ligation reaction were then digested by BaeI in 25 ℃ for 2 hours. The digestion result was shown in Figure 5B. Lane 10 was the control λ DNA without nucleotides fill-in, and it had the 801 bps DNA fragment (shown in the band D of Figure 5B, indicated by an arrow) consisting of the 117 and 694 bps DNA fragments. Lanes 1-3 were the λ DNAs filled in with biotin-lableled dATP mixed with non-biotin-labeled dNTPs (BioA-λ DNA) and incubated in 25 ℃ for 15, 30, 60 minutes. Lanes 4-6 were λ DNAs filled in with biotin-labeled dCTP mixed with non-biotin-labeled dNTPs (BioC-λ DNA) and incubated for 15, 30, 60 minutes. Lanes 7-9 were the λ DNAs filled in with non-biotin-labeled dNTPs (dNTP-λ DNA) for 15, 30, 60 minutes. Gel electrophoresis result of lanes 1-9 reveals that they only had the 117 and 694 bps DNA fragments and did not have the 801 bps DNA fragment. Therefore, majority of the DNAs were filled in successfully.. 4.1.3 Dot blot of biotin-labeled DNA To further examine whether the biotin-labeled nucleotides were filled in, the reaction products were tested to determine whether they could be captured by Streptavidin-Peroxidase Polymer and the presence of peroxidase polymer was analyzed by dot blot. If the biotin-labeled nucleotides were filled in, then the Streptavidin-Peroxidase Polymer can attach to the biotin-labeled DNA. Therefore, the peroxidase polymer will be detected by dot blot. 20.
(32) There were four treatments in the dot blot of biotin-labeled BspHI-digested URA3: The DNAs of BspHI-digested URA3 were treated with either biotin-labeled dATP mixed with non-biotin-labeled. dNTPs. (BioA-BspHI-URA3). or. non-biotin-labeled. dNTPs. (dNTP-BspHI-URA3) only. Biotin-labeled dATP with no DNA (BioA) and HindIII-digested λ DNA with biotin-labeled (Control DNA) were used as controls. As the result shown in Figure 6A, BspHI-URA3-BioA and control DNA appear to be positive on film, and the sizes of the dots reduced as the quantity of DNA decreased. Next, the long DNA tempate, λ DNA was tested with the same treatments. The data in Figure 6B indicate that the λ DNA with either biotin-dATP (BioA-λ DNA) or dCTP (BioC-λ DNA) fill-in for various incubation times are positive and the λ. DNA with. non-biotin-labeled dNTPs fill-in (dNTP-λDNA), biotin-dATP with no DNA (BioA) and biotin-dCTP with no DNA (BioC) are not.. 4.1.4 Analysis with the gel electrophoresis of the supernatant of the biotin-labeled DNA interacting with streptavidin coated magnetic beads To determine whether the biotin-labeled DNA can be anchored to magnetic beads via the streptavidin coating, it is necessary to check the quantity of DNA within the supernatant after it was incubated with streptavidin coated magnetic beads (SA). If the DNAs can now be anchored to the SA, then they will be precipitated down and disappeared from the supernatant. The biotin-labeled DNA was incubated with either 100 µg SA or 100 µl ddH2O at room temperature for 1 hour, and then the supernatant was analyzed by gel electrophoresis. The results of BioA-BspHI-URA3 and dNTP-BspHI-URA3 incubated either with SA or ddH2O can be seen in Figure 7A. They reveal that the 1 and 3.3 kb DNA fragments of BioA-BspHI-URA3 in the supernatant decreased after incubated with SA compared to ddH2O(Figure 7A, bands E and F in lanes 1 vs. 2). And the supernatant of dNTP-BspHI-URA3 incubated with SA was almost the same as incubated with ddH2O 21.
(33) (Figure 7A, bands E and F in lanes 3 vs. 4). The 1.5 kb λ DNA PCR product is the internal control (band G). As the Figures 7B shows, the band of BioA-λ DNA incubated with SA (BioA-λ DNA-SA) and that of BioC-λ DNA incubated with SA (BioC-λ DNA–SA) were relatively diminished compared with that incubated with ddH2O (Figure 7B, Band H in Lane 1 vs. 2 and Band H in Lane 3 vs. 4). The decreased quantity of BioC-λ DNA was more than that of BioA-λ DNA. The bands of dNTP-λ DNA incubated with either SA or ddH2O were almost the same (Band H in Lane 5 vs. 6). The 1.5 kb λ DNA PCR product is the internal control (Band I).. 4.1.5 Dot blot of biotin-labeled DNA with SA after several washed The biotin-labeled BspHI-URA3 and λ DNA were incubated with SA at room temperature for 1 hour and washed by 0.5 M NaCl in 1X TE buffer 4 times. Finally the reaction was resuspended in 200 µl 0.5 M NaCl in 1X TE. If one end of the biotin-labeled DNA is anchored to SA and the other end is free, it can be captured by Streptavidin-Peroxidase Polymer and appears to be positive on the blot. The. BioA-BspHI-URA3. was. incubated. with. either. SA. or. ddH2O. (BioA-BspHI-URA3-SA and BioA-BspHI-URA3-H2O, respectively). For the control, dNTP-BspHI-URA3 and ddH2O were incubated with SA (BspHI-URA3-dNTP-SA and H2O-SA, respectively) and the reaction precipitates were washed by 200 µl 1X PBS 1 to 4 times. The data in Figure 8A shows that BioA-BspHI-URA3-SA still showed positive in the blot after being washed 4 times, and the signal of BioA-BspHI-URA3-H2O was washed away after two washes. There is no signal for dNTP-BspHI-URA3-SA. Therefore, certain proportions of the BioA-BspHI-URA3-SA have at least one end free of SA and the other end bound by SA. Figure 8B shows the result of BioA-λ DNA and BioC-λ DNA incubated with either SA 22.
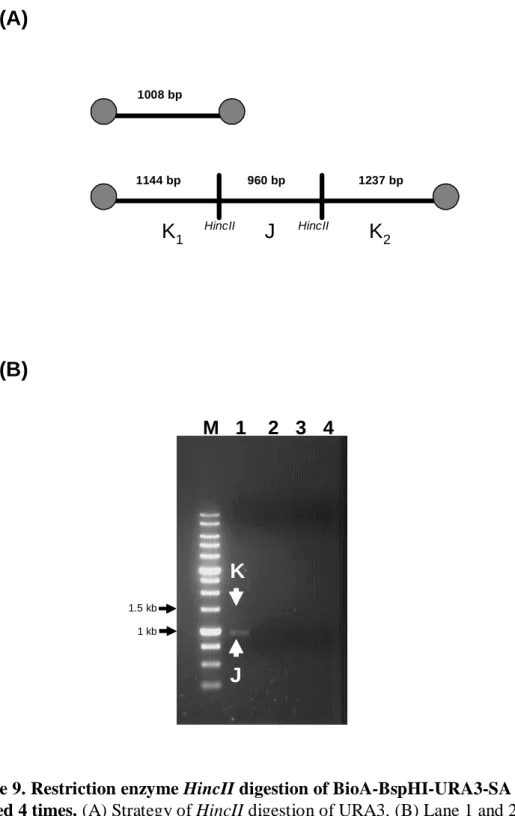
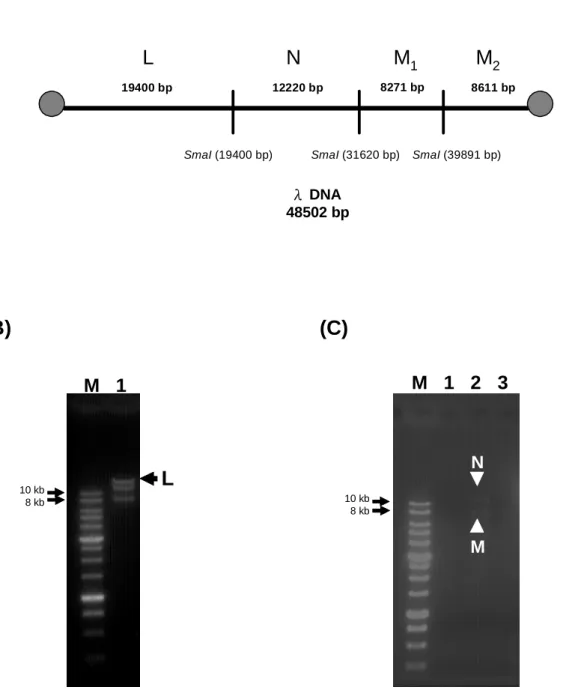
(34) or ddH2O (BioA-λ DNA-SA, BioC-λ DNA-SA, BioA-λ DNA-H2O and BioC-λ DNA-H2O, respectively), and that of dNTP-λ DNA and ddH2O incubated with SA (dNTP-λ DNA-SA and H2O-SA, respectively). BioA-λ DNA-SA and BioC-λ DNA-SA were still positive after being washed 4 times and BioA-λ DNA-H2O and BioC-λ DNA-H2O were negative after being washed once. There is no signal for dNTP-λ DNA-SA and H2O-SA. Therefore, certain proportions of the BioA-λ DNA-SA and BioC-λ DNA-SA have at least one end free of SA and the other end bound by SA.. 4.1.6 Restriction enzyme digestion of biotin-labeled DNA with SA after 4 washes To examine whether both ends of biotin-labeled DNA are anchored to SA, restriction enzyme digestion is introduced to cut the DNA into smaller fragments. If both end fragments were anchored to SA, then they will be precipitated down and will not show up in the supernatant, which was subjected to the analysis by electrophoresis. Figure. 9B. shows. BioA-BspHI-URA3-SA,. the. result. of. restriction. BioA-BspHI-URA3-H2O,. enzyme. HincII. digestion. dNTP-BspHI-URA3-SA. of and. dNTP-BspHI-URA3-H2O. HincII cut the 3.3 kb DNA fragment into three fragments (1144, 960 and 1237 bps). The1144 bp and 1237 bp DNA fragments contain the original ends and should be anchored to SA (Figure 9A), if they were biotin-labeled. We can see there is a DNA fragment (band J) and a small amount of 1.1-1.2 kb DNA fragment (band K) in the lane of BioA-BspHI-URA3-SA. after. HincII. digestion. (Figure. 9B).. The. lane. of. BioA-BspHI-URA3-H2O, dNTP-BspHI-URA3-SA and dNTP-BspHI-URA3-H2O were negative (Figure 9B). Therefore, it is very likely BioA-BspHI-URA3-SA is filled in with biotin and was able to bind to SA. Restriction enzyme SmaI cut λ DNA into 19400, 12220, 8271, and 8611 bps DNA fragments, and the 19400 and 8611 bp DNA fragments should be anchored to SA (Figure 10A). The result of the untreated λ DNA digested by SmaI was shown at Figure 10 B and the 23.
(35) band L was the 19400 bps fragment. Figure 10C was the result of BioA-λ DNA-SA, BioC-λ DNA-SA, dNTP-λ DNA-SA after SmaI digestion. It illustrates that there were two DNA fragments on the lane of BioC-λ DNA-SA. One was about 8 kb and the other was greater than 10 kb (band M and N) and the lane of BioA-λ DNA-SA and dNTP-λ DNA-SA were negative after digestion. Therefore, it is very likely BioA-λ DNA-SA and BioC-λ DNA-SA are filled in with biotin and were able to bind to SA.. 4.1.7 Fluorescence staining of biotin-labeled DNA with SA Biotin-labeled DNA with SA was stained with YOYO-1, which allows over a thousand-fold increase in its green fluorescence when bound to dsDNA. The DNA sample was stained with 200 µl. 1 µM YOYO-1 at room temperature for 30 minutes, then the. stained product was washed with 1 X PBS twice to remove free YOYO-1 and DNA not anchored by SA, and the pellet was resuspended in 1X PBS. 10 µl of the mixture was placed on the slide and observed under fluorescence microscope with 400X magnification. The results are shown in Figure 11. The data shows that BioA-BspHI-URA3-SA was stained by the green fluorescence after washed, and that of dNTP-BspHI-URA3-SA and H2O-SA were negative after washed. The staining results of BioA-λ DNA-SA, BioC-λ DNA-SA, dNTP-λ DNA-SA and H2O-SA were shown in Figure 12. The BioC-λ DNA-SA was stained by green fluorescence after washed and the image of BioA-λ DNA-SA shows no significant difference from that of dNTP-λ DNA–SA.. 4.2 Thiol-labeled DNA incubated with Au particles 4.2.1 Dot blot of thiol-labeled DNA with biotin maleimide Thiol was added to the 3’ end of DNA by 3’EndTag Thiol labeling Kit. To examine whether the thiol is added, the biotin maleimide was added which the maleimide group reacts 24.
(36) to the thiol group. A stable thioether linkage between the maleimide group and sulfhydryl is formed, which cannot be cleaved under physiological conditions. Once the ends of DNA were labeled with biotin maleimide, it can be interact with Streptavidin−Peroxidase Polymer, of which the peroxidase polymer activity can be detected by dot blot. As the Figure 13A shows, BspHI-URA3 with either thiol addition (BspHI-URA3-SH) or ddH2O were reacted with 10 µl biotin maleimde in 65 ℃ for 30 minutes, then they were cleaned up by phenol extraction 3 times and were incubated with Streptavidin−Peroxidase Polymer before the analysis of dot blotting. The data of BspHI-URA3-SH appears to be positive on the film and the great parts of ddH2O with biotin-maleimide were lost as the blot sizes reduced after extraction 3 times. Next, the long DNA template, λ DNA was tested with the same treatment. The result of λ DNA with either thiol addition (λ DNA-SH) or ddH2O incubated with biotin maleimde was shown in Figure 13B. They were cleaned up by phenol extraction 3 times and the result was shown. The data illustrates that of λ DNA-SH still appears to be positive after extraction 3 times, and the great part of ddH2O with biotin-maleimide was lost as the blot sizes reduced after extraction 3 times. The control was 1 µg HindIII-digested λ DNA with biotin-labeled.. 4.2.2 Analysis with gel electrophoresis of the supernatant of the thiol-labeled DNA interacting with Au particles To determine whether the thiol-labeled DNA can be tethered to Au particles, it is necessary to check the quantity of thiol-labeled DNA in the supernatant after it was incubated with Au particles. The thiol-labeled DNA was incubated with or without 160 μg Au particles in ethanol at 65 ℃ for 1.5 hours. In order to evaporate the ethanol, the reaction products were heated in 65 ℃ with the cap of eppendorf opened. After that the products were resuspended in 40 µl ddH2O and the supernatant was analyzed by gel electrophoresis. The result of BspHI-URA3-SH incubated with or without Au was shown at Figure 14A, 25.
(37) there were no obvious difference between BspHI-URA3-SH incubated with or without Au (BspHI-URA3-SH-Au and BspHI-URA3-SH-NoAu, respectively) (Bands O and P in Lane 1 vs, Lane 2). And also no obvious difference between BspHI-URA3 without thiol-labeled (BspHI-URA3-NoSH) incubated with or without Au (BspHI-URA3-NoSH-Au and BspHI-URA3-NoSH-NoAu, respectively) (Bands O and P in Lane 3 vs. Lane 4). Nevertheless, the lane of BspHI-URA3-NoSH-Au and BspHI-URA3-NoSH-NoAu were smeared. The 1.5 kb of λ DNA PCR product is the internal control (band Q). As the Figure 14B shows, there is no distinct difference between λ DNA-SH incubated with or without Au (λ DNA-SH-Au and λ DNA-SH-NoAu, respectively) (Band R in Lane 1 vs. Lane 2) and there is also no distinct difference among λ DNA without thiol-labeled (λ DNA-SH-No) and those incubated with Au and without Au (λ DNA-NoSH-Au and λ DNA-NoSH-NoAu, respectively) (Band R in Lane 3 vs. Lane 4). However the bands of λ DNA in these four lanes were almost lost (Band R). The 1.5 kb of λ DNA PCR product is the internal control (Band S).. 4.2.3 Restriction enzyme digestion of thiol-labeled DNA with Au after several washed To examine whether thiol-labeled DNA is tethered to Au particles, restriction enzyme digestion is introduced to cut DNA into smaller fragments. If both its end fragments were anchored to Au particles, then they will be precipitated down and will not show up in the supernatant, which was subjected to analysis by electrophoresis. The BspHI-URA3-SH-Au and λ DNA-SH-Au were washed by ddH2O for 4 times and resuspended in ddH2O. The washed products were then digested by restriction enzymes. Figure 15A shows the result of HincII digested BspHI-URA3-SH-Au. The 3.3 kb DNA fragment of BspHI-URA3 was digested into 3 fragments (1144, 960 and 1237 bps) by HincII as shown in Figure 9A, the 1144 and 1237 bp DNA fragments were at the ends and should be 26.
(38) anchored to Au particles. As the data reveal in Figure 15A, the lane of BspHI-URA3-SH-Au had two DNA fragments, one was the 960 bps DNA fragment (band T) and the other was between. 1. and. 1.5. kb. (band. U).. The. lanes. of. BspHI-URA3-SH-NoAu,. BspHI-UAR3-NoSH-Au and BspHI-URA3-NoSH-NoAu showed no DNA fragment after digestion. The λ DNA-SH was digested into 4 DNA fragment (19400, 12220, 8271 and 8611 bps) by SmaI, and the 19400 and 8611 bp DNA fragments should be anchored with Au (shown in Figure 10 A). The result of the λ DNA-SH-Au digested by SmaI was shown in Figure 15B. There were two DNA fragments on the lane of λ DNA-SH-Au, one is about 8 kb (lane W) and the other was greater than 10 kb (lane V). The lane of λ DNA-SH-NoAu, λ DNA-NoSH-Au and λ DNA-NoSH-NoAu showed no DNA fragment after digestion.. 4.2.4 Fluorescence staining of thiol-labeled DNA with Au after several washed Thiol-labeled DNA with Au was stained with YOYO-1, which allows over a thousand-fold increase in its green fluorescence when bound to dsDNA. The DNA sample was stained with 200 µl 1 µM YOYO-1 at room temperature for 30 minutes. Then the stained product was washed with 1X PBS twice to remove free YOYO-1 and DNA not anchored by Au. 10 µl of mixture was placed on the slide and observed under fluorescence microscope with 400X magnification. As we can see in the Figure 16, the BspHI-URA3-SH-Au was stained by the green fluorescence after washed and a little of BspHI-URA3-NoSH-Au was stained by the green fluorescence. Those of BspHI-URA3-SH-NoAu and BspHI-URA3-NoSH-NoAu were negative after stained. The result of λ DNA-SH-Au stained with YOYO-1 was shown in Figure 17. The data reveal both the λ DNA-SH-Au and λ DNA-NoSH-Au were stained by green fluorescence after washed, and those of λ DNA-SH-NoAu and λ DNA-NoSH-NoAu were negative. 27.
(39) V. Discussion The research of Bennink ML et al. (1999) proposed that both the sticky ends of λ DNA could be used to attach biotin with Klenow DNA polymerase. This individual DNA molecule was captured between two streptavidin coated polystyrene beads. The first bead is immobilized by the optical tweezers and the second by the micropiptte. However, this method could only manipulate a single DNA molecule each time. Recently, a micromachined magnetic tweezers for DNA manipulation using MEMS technologies was proposed by Chiou et al. (2005). One sticky end of a single DNA molecule was hybridized with a biotinylated primer and bonded onto a magnetic bead. The other end was incorporated with S4-dTTP using Klenow fragment and tethered to a gold surface. This model is still limited for DNA molecule because one of its sticky ends must be hybridized with the homologues biotinylated primer. In this study, we developed a novel method for coupling the both ends of a linear DNA with metal beads without needing to treat the two ends of DNA differently, which can be useful for DNA manipulation. Both its ends were tethered with micron size magnetic beads and Au particles that can easily be manipulated under magnetic or optical tweezers and the tethered processes were suited for the entire DNA molecule. The DNA templates used in this research were the two fragments of BspHI-digested pGEM-URA3 plasmid (0.34 and 1.12 µm in length, known as the short template) and the λ DNA fragment (16.49 µm, the long template). The diameter of double-stranded DNA is 2 nm. The diameter of the magnetic beads and Au particles were about 1 µm and < 5µm, respectively.. 5.1 Biotin-labeled DNA incubated with streptavidin coated magnetic beads 5.1.1 Fill-in with biotin-labeled dATP or dCTP. 28.
(40) The DNA was anchored to magnetic beads through the interaction between biotin-labeled nucleotides filled in at the 5’ end overhang sequences with the streptavidin coats magnetic. pGEM-URA3 was digested into 1 and 3.3 kb DNA fragments (band A and B) by restriction enzyme BspHI (Figure 4B) and the 5’ overhang was then filled in with biotin-labeled dATP. The 5’ overhang of λ DNA was filled in with either biotin-labeled dATP or dCTP. The fill-in products were cleaned up by ethanol precipitation twice (without phenol extraction) and dissolved in ddH2O. The supposedly biotin-labeled DNAs were then subjected for further analysis to determine whether the biotin was incorporated or used directly for conjugation with SA.. 5.1.2 BaeI digestion for examining the fill-in of λ DNA Due to the 5’ single-stranded 12 bps complementary region, λ DNA can form circular form spontaneously. If the Klenow successfully fills in the region, then it can only be linear form. The λ DNA after fill-in was digested by restriction enzyme BaeI and the appearance of the 801 bps DNA fragment from circular form is used as the marker to indicate the 5’ ends were not filled in. As in Figure 5B, only the λ DNA without fill-in has a clear indication of the 801 bps fragment (Band D). Therefore, the λ DNAs were able to be filled in.. 5.1.3 Dot blot of biotin-labeled DNA The other way to examine the fill-in reaction is to use dot blot to detect the peroxidase polymer activity conjugated with streptavidin, which can interact to the DNA via the fill-in biotin-labeled nucleotides. As the result shown in Figure 6A, BspHI-URA3-BioA was positive on the blot even when the quantity was low (down to 1 µg). There was no detection on the biotin-labeled dATP. Therefore, the positive signal indicates some of the BspHI-URA3-BioA was retained by the 29.
(41) streptavidin peroxidase polymer. This is an indication that BspHI-URA3-BioA has biotin labeled nucleotides. Next, the long DNA template, λ DNA was tested with the same treatment. The result shown in Figure 6B, BioA-λ DNA and BioC-λ DNA were positive even if the incubation times was only 15 minutes, and there was no signal on the biotin-labeled dATP and biotin-labeled dCTP. The positive signals of BioA-λ DNA and BioC-λ DNA indicate that they were retained by streptavidin peroxidase polymer. This is an indication that BioA-λ DNA and BioC-λ DNA have biotin-labeled nucleotides.. 5.1.4 Supernatant of biotin-labeled DNA interacting with SA To determine whether the biotin-labeled DNA can be tethered to magnetic beads via the streptavidin coating, it is necessary to check the quantity of biotin-labeled DNA in the supernatant after it was incubated with SA. If the biotin-labeled DNA were tethered to SA, then the quantity of biotin-labeled DNA in the supernatant will be reduced and show up in the supernatant, which subjects to analysis by electrophoresis. The Figure 7A reveals that the 1 and 3.3 kb fragments of BioA-BspHI-URA3 reduced in the supernatant of BioA-BspHI-URA3-SA compared to the BioA-BspH-URA3-H2O (Band E and F in Lane 1 vs. Lane 2), and the supernatant of dNTP-BspHI-URA3 incubated with either SA or ddH2O were almost the same (Band E and F in Lane 3 vs. Lane 4). The reduction of the BioA-BspHI-URA3 in the supernatant indicates that the BioA-BspHI-URA3 was anchored to SA and there was no non-specific binding of non-biotin-labeled DNA to SA. The result of the supernatant of BioA-λ DNA and BioC-λ DNA incubated with SA were shown in Figure 7B. The data suggests that amount of the BioC-λ DNA in the supernatant of BioC-λ DNA- SA was greatly reduced compared to that of the BioC-λ DNA-H2O (Band H in Lane 1 vs. Lane 2), and certain amount of the of BioA-λ DNA in the supernatant of the BioA-λ DNA-SA was reduced compared to that of the BioA-λ DNA-H2O (Band H in Lane 3 30.
(42) vs. Lane 4). The dNTP-λ DNA in the supernatant of dNTP-λ DNA incubated in SA was almost the same as incubated with ddH2O (Band H in Lane 6 vs. Lane 7). According to the reduction of biotin-labeled λ DNA, it indicates that BioA-λ DNA and BioC-λ DNA were anchored to SA and there was no non-specific binding of non-biotin-labeled DNA to SA. Furthermore, the binding capacity of BioC-λ DNA to SA is much more than BioA-λ DNA to SA. This may be because the number of biotin-labeled nucleotides in BioC-λ DNA was more than that in BioA-λ DNA. The 5’ overhang of λ DNA was filled in with one biotin-labeled dATP at each end (Figure 2), whereas there were 4 and 6 biotin-labeled dCTP at the end (Figure 2). Due to the amount of biotin-labeling in BioC-λ DNA was more than that in BioA-λ DNA, the chance of being bound to SA was raised so that the BioC-λ DNA in the supernatant reduced much more than that in BioA-λ DNA. The BioA-BspHI-URA3 has only one biotin-labeled on both ends but the reduction is significant. That may because of the extent of binding of biotinylated DNA to SA is inversely proportional to the length of the DNA, presumably due to charge repulsion between DNA molecules. This effect appears to be a universal characteristic and is independent of the properties of the SA [Lui et al., 1997].. 5.1.5 Dot blot of biotin-labeled DNA interacting with SA after several washed The other way to examine the interacting reaction is to use dot blot to detect the peroxidase polymer activity conjugated with streptavidin, which can interact to the biotin-labeled DNA of which one end is anchored to SA and the other end is free. The result of BioA-BspHI-URA3-SA was shown in Figure 8A, BioA-BspHI-URA3-SA showed positive in the blot even after 4 washes, and the BioA-BspHI-URA3 was washed away after two washes (Lane of BioA-BspHI-URA3-H2O). Therefore, there is certain proportion of BioA-BspHI-URA3 having at least one end free of SA and the other bound by SA. The result of BioA-λ DNA-SA and BioC-λ DNA-SA in Figure 8B showed that the 31.
(43) BioA-λ DNA-SA and BioC-λ DNA-SA were still positive in the blot even if the reactions were washed 4 times, and the BioA-λ DNA and BioC-λ DNA were washed away after first wash (Lane of BioA-λ DNA-H2O and BioC-λ DNA-H2O). The positive signal of BioA-λ DNA-SA and BioC-λ DNA-SA indicates that certain proportion of BioA-λ DNA and BioC-λ DNA have at least one end free of SA and the other bound by SA.. 5.1.6 Restriction enzyme digestion of biotin-labeled DNA incubated with SA To examine whether the biotin-labeled DNA is anchored to SA with either both ends or just one end, it was digested by restriction enzyme and analyzed by electrophoresis. If both end fragments were anchored to SA, then they will be precipitated down and will not show up in the supernatant which was subjected to electrophoresis. HincII cuts the 3.3 kb DNA fragment of BspHI-URA3 into 1237, 960, 1144 bps. The 1237 and 1144 bps DNA fragments were on the ends and should be anchored to SA (Figure 9A). The result in Figure 9B indicates that there was the 960 bps DNA fragment (Band J) and small amount of 1~1.5 kb DNA fragment (Band K) in Lane 1. According to the quantity ratio of band J to band K, most BioA-BspHI-URA3 were anchored to SA with both ends and only few BioA-BspHI-URA3 were anchored to SA with just one end. The result of BioC-λ DNA-SA was the same as above. λ DNA was digested into 19400, 12220, 8271, 8611 bps DNA fragments by SmaI. The 19440 and 8611 bp fragments were on the ends and should be anchored to SA (Figure 10A). As shown in Figure 10B, the 19440 bps fragment (Band L) can be observed in the SmaI digested untreated λ DNA with 1 % agarose gel. The result in Figure 10C indicates that BioC-λ DNA-SA does not have the 19400 bps fragment after SmaI digestion (Lane 2). Therefore, the BioC-λ DNA was anchored to SA at both ends. Compared to the result in the dot blot of BioC-λ DNA incubated with SA after several washed, there should be some BioC-λ DNA with at least one end free of SA and the other end bound to SA. However the quantity was too low to be detected in the 32.
(44) electrophoresis. There was no signal detected on the lane of BioA-λ DNA after SmaI digestion (Lane 1), so we can not know whether the BioA-λ DNA was anchored to SA at both ends. Compared to the result of dot blot of BioA-λ DNA incubated with SA after several washed, there should be only few BioA-λ DNA which have at least one end free of SA and the other end bound to SA, of which the quantity was too low to be detected in the electrophoresis.. 5.1.7 Fluorescence staining of biotin-labeled DNA with SA This method can examine whether biotin-labeled DNA is anchored to SA directly. The biotin-labeled DNA with SA was stained with YOYO-1, which exhibits 100 to 1000 fold fluorescence enhancement upon binding to dsDNA. The image in Figure 11 reveals that the non-specific binding DNA was washed away since the dNTP-BspHI-URA3-SA did not have the green fluorescence after washes and BioA-BspHI-URA3-SA was stained by the green fluorescence after washes; therefore, the reaction of anchoring BioA-BspHI-URA3 to SA was successful since it had the green fluorescence on the SA with the relatively position to the bright-field view. The image of biotin-labeled λ DNA with SA was shown in Figure 12. The BioC-λ DNA-SA was stained by green fluorescence after washes. Compared to the image of dNTP-λ DNA-SA, we can know that the reaction of BioC-λ DNA anchored to SA was successful. Nevertheless, the image of BioA-λ DNA showed no significant difference with that of dNTP-λ DNA. The result of dot blot of BioA-λ DNA-SA showed that certain proportion of BioA-λ DNA was at least with one end free and the other end bound to SA. Only a little of BioA-λ DNA bound to SA because of the weak binding capacity, so we can not see the difference from that of dNTP-λ DNA.. 5.1.8 Summary 33.
數據

+7


相關文件
基因編輯技術以人工核酸酶辨識特定 DNA 位置,並於此處切斷雙股 DNA。DNA 斷
Watson和Crick於 1953年發現的DNA(脫氧核 糖核酸)雙螺旋結構,證明DNA才是遺傳密碼
The algorithms have potential applications in several ar- eas of biomolecular sequence analysis including locating GC-rich regions in a genomic DNA sequence, post-processing
• Learn strategies to answer different types of questions.. • Manage the use of time
assembly of the genome of that species will be far better if read lengths are longer than N... Accurate but
• Next-generation sequencing projects, with their short read lengths and high data volumes, have made these challeng es more difficult.. • We discuss the computational
With λ selected by the universal rule, our stochastic volatility model (1)–(3) can be seen as a functional data generating process in the sense that it leads to an estimated
Genotoxicity and DNA adduct formation of incense smoke condensates: comparison with environmental tobacco smoke condensate s.. A study of the environmental attitudes and
