Hydrogen-Bonding Interactions Mediate the Phase Behavior of an
A-B/C Block Copolymer/Homopolymer Blend Comprising
Poly(Methyl Methacrylate-b-vinylpyrrolidone) and Poly(Vinylphenol)
Hsin-Fang Lee, Shiao-Wei Kuo,* Chih-Feng Huang, Jiann-Shing Lu, Shih-Chi Chan, Chih-Feng Wang, and Feng-Chih Chang*Institute of Applied Chemistry, National Chiao Tung UniVersity, Hsin Chu, Taiwan ReceiVed March 8, 2006; ReVised Manuscript ReceiVed May 10, 2006
ABSTRACT: We have investigated a new type of A-B/C blend, formed between poly(methyl methacrylate-b-vinylpyrrolidone) and poly(vinylphenol) (PMMA-b-PVP/PVPh), that displays unusual phase behavior. In this blend, the PMMA (A) and PVP (B) blocks within the PMMA-b-PVP (A-B) copolymer are miscible; although PVPh (C) experiences attractive interactions (ξ e 0) through hydrogen bonding, with both the PVP and PMMA blocks, its interaction with the former block is significantly stronger than that with the latter (ξBC. ξAC). We investigated the miscibility and phase behavior of this novel A-B/C blend through the use of FTIR spectroscopy, DSC,13C CP/MAS solid-state NMR spectroscopy, and TEM. The proton spin-lattice relaxation time in the rotating frame (T1FH), which we determined using13C NMR spectroscopy, indicates that phase separation occurs for blends containing ca. 20-60 wt % PVPh. TEM images indicated clearly that the morphology of phase separation consists of a matrix of homogeneous mixed PVP/PVPh and micellar domains of excluded PMMA. This special phase behavior and miscibility is due mainly to the diversity of interactions that exist between the PMMA/PVPh and PVP/PVPh units.
Introduction
In recent years, there has been growing interest in the study of blends of diblock (A-B) copolymers mixed with homopoly-mers (C) because of the unusual phase behavior exhibited in such blending systems.1-10Different kinds of A-B/C-type blend
systems have been investigated extensively. One is the blend system comprising an immiscible A-B diblock copolymer (χAB
> 0) and a homopolymer C in which C is immiscible with block A (χAC> 0) but interacts favorably with block B (ξBCe 0). Hellmann et al.1,2and Kwei et al.8,9have theoretically analyzed
the relationships between the microphases and macrophases in a number of such blends and have compared their calculated structures with morphological observations. The other blend system comprises an immiscible A-B diblock copolymer (χAB
> 0) and a homopolymer C that is miscible with both blocks A and B; in such a system, C acts as a “nonselective polymer solvent” for both blocks A and B. The poly(styrene-b-hydroxy-styrene)/poly(vinyl methyl ether) (PS-b-PHOST/PVME) blend-ing system is a typical example: when the PVME content is 50% or higher, it functions as a common solvent for the two blocks and results in a single phase.8 Balsara et al. also
demonstrated a special A-B/C blend system of poly(ethylene-b-propylene)/polyisobutylene (PE-b-PP/PIB),10whereinχ
ACis
positive and a decreasing function of temperature, whileχBCis
negative and an increasing function of temperature. These interactions lead to an order-disorder transition and macrophase separation at specific temperature range.
In this paper, we report a different A-B/C diblock copolymer/ homopolymer system in which the value ofχABis negative (A
and B are miscible) and blocks A and B both experience attractive interactions (hydrogen-bonding interactions,ξACand
ξBC) with C, butξBC. ξAC. To investigate the miscibility and
phase behavior in this blend system, we synthesized poly(methyl
methacrylate-b-vinylpyrrolidone) (PMMA-b-PVP; Mn) 46 000
g/mol) and blended it with poly(vinylphenol) (PVPh). Indeed, we synthesized the PMMA-b-PVP block copolymer for the first time through a combination of atom transfer radical polymer-ization (ATRP) and conventional radical polymerpolymer-ization. Al-though ATRP has many advantages over other polymerization methods when used for block copolymerization, including a high tolerance toward a wide range of monomers and functional groups,11it has not yet been applied successfully for
polymer-izing vinylpyrrolidone, vinyl acetate, or olefins. One approach to overcoming this limitation is to combine ATRP with conventional radical polymerization through the use of difunc-tional initiators.12,13
We have reported previously that PVPh is totally miscible with PVP over the entire range of blend compositions because of strong hydrogen bonding between the hydroxyl groups of PVPh and the carbonyl groups of PVP.14,15In addition, Zhang
et al. reported that PVPh/PMMA blends are miscible because of the hydrogen-bonding interactions that exist between PVPh’s hydroxyl groups and the carbonyl groups of PMMA.16,17
Furthermore, according to the Painter-Coleman association model,18,19the interassociation equilibrium constant of the PVPh/
PVP blend (KA ) 6000; determined from studies of a model
compound)20,21is significantly higher than that of the PVPh/
PMMA blend (KA ) 37.4).18 This result implies that the
formation of hydrogen bonds between PVPh and PVP should dominate over that between PVP and PMMA in PMMA-b-PVP/ PVPh blends.
We investigated the interactions and phase behaviors of this A-B/C-type blend of PMMA-b-PVP and PVPh through the use of differential scanning calorimetry (DSC), Fourier transform infrared (FTIR) spectroscopy, high-resolution 13C CP/MAS
NMR spectroscopy, and transmission electron microscopy (TEM). Measurements of the proton spin-lattice relaxation time in the rotating frame (T1FH), determined through 13C NMR
spectroscopic analyses, indicated that phase separation exists within blends containing 20-60 wt % PVPh. Transmission
* To whom correspondence should be addressed, E-mail: [email protected] (S-W.K.); [email protected] (F-C.C.). Telephone: 886-3-5131512. Fax: 886-3-5131512.
10.1021/ma0605189 CCC: $33.50 © 2006 American Chemical Society Published on Web 07/04/2006
electron microscopy images clearly indicated that the morphol-ogy of this phase transition consists of a matrix phase of mixed PVP and PVPh and micellar domains of excluded PMMA. Experimental Section
Materials. All monomers were distilled from CaH2and stored under argon at -30°C. Triethylamine was also distilled from CaH2 prior to use. CuIBr was purified according to a literature procedure.22 All solvents were distilled prior to use. 2-Bromoisobutyryl bromide (98%, Aldrich), 2,2′ -azobis[2-methyl-N-(2-hydroxyethyl)propiona-mide] (98%, WAKO), N,N,N′,N′′,N′′-pentamethyldiethylenetriamine (PMDETA; 99%, Acros), and Amberlite IR-120 (H form) cation exchange resin were used as received. Poly(vinylphenol) (PVPh; Mn) 10 000) was purchased from Polyscience Inc. (USA).
Synthesis of 2,2′ -Azobis[2-methyl-N-(2-(2-bromoisobutyry-loxy)ethyl)propionamide] (AMBEP). 2-Bromoisobutyryl bromide (5.63 mL, 43.4 mmol) was added dropwise over 1 h to a stirred mixture of 2,2′-azobis[2-methyl-N-(2-hydroxyethyl)propionamide] (5.00 g, 17.3 mmol) and triethylamine (6.02 mL, 43.4 mmol) in CHCl3(150 mL) under argon in an ice bath. The reaction was then stirred at room temperature for 3 h before being washed with water (3× 150 mL) and dried (MgSO4). After filtration, evaporation of CHCl3gave a white product, which was recrystallized from diethyl ether/ethyl acetate (3.83 g, 50.4%).1H NMR (CDCl
3)δ: 7.18 (s, 2H), 4.32 (t, 4H), 3.67 (q, 4H), 1.90 (s, 12H), 1.35 (s, 12H).
Synthesis of PMMA with a Central Azo Unit (Azo-PMMA). Azo-PMMA macroinitiator was synthesized as indicated in Scheme 1 using the ATRP technique. In a 10-mL pear-shaped flask, the AMBEP initiator (60 mg, 0.1 mmol; synthesized as described above) was degassed, and then previously degassed ethyl acetate (2 mL) was added by syringe. The mixture was stirred until the solution was homogeneous. A dry 25-mL round-bottom flask equipped with a stirrer bar and charged with CuIBr (30 mg, 0.2 mmol) was degassed and then deoxygenated MMA monomer (4.5 mL, 40 mmol), ethyl acetate (2.5 mL), and PMDETA (0.13 mL, 0.6 mmol) were added sequentially; the solution was stirred for 20 min to form the Cu complex. The initiator solution was then added. This whole process was performed for 1 day in an oil bath at temperatures under 30°C in an argon-filled drybox. The reaction mixture was diluted 5-fold with tetrahydrofuran (THF) and then stirred with Amberlite IR-120 (H form) cation exchange resin to remove the catalyst. The mixture was then passed through an alumina column and precipitated into methanol to produce the azo-PMMA macroinitiator. The isolated yield of azo-azo-PMMA ho-mopolymer was 78%.
Synthesis of Poly(methyl methacrylate-b-vinyl pyrrolidone) Copolymer. Block copolymers of methyl methacrylate (MMA) with N-vinyl-2-pyrrolidone (NVP) were prepared through radical po-lymerization using azo-PMMA as initiator [monomers-to-azo-PMMA ratio ) 200:1 (mol/mol)]. The copolymerization was
conducted in benzene at 90 °C reflux for 24 h under an argon atmosphere. Before vacuum drying, the PMMA-b-PVP was pre-cipitated repeatedly from methylene chloride solution into cold diethyl ether and purified through Soxhlet extraction with THF for 24 h to remove any unreacted azo-PMMA macroinitiator. The isolated yield of purified PMMA-b-PVP copolymer was 38%.
Blend Preparation. Blends of various PMMA-b-PVP/PVPh compositions were prepared through solution casting. DMF solu-tions containing a 5 wt % polymer mixture were stirred for 6-8 h and then cast on a Teflon dish. The solution was left to evaporate slowly 80°C for 1 day. The blend films were then dried under vacuum at 120°C for 2 days.
Characterization. Gel Permeation Chromatography. Molecular weight and molecular weight distributions were determined through gel permeation chromatography (GPC) using a Waters 510 HPLC, equipped with a 410 differential refractometer, a refractive index (RI) detector, and three Ultrastyragel columns (100, 500, and 103) connected in series in order of increasing pore size, with DMF as eluent at a flow rate of 0.6 mL/min. The molecular weight calibration curve was obtained using polystyrene standards.
Differential Scanning Calorimetry. Thermal analyses were performed using a DuPont 910 DSC-9000 controller at a scan rate of 20°C/min over the temperature range from 30 to 250°C under a nitrogen atmosphere. The sample (ca. 5-10 mg) was weighed and sealed in an aluminum pan, quickly cooled to room temperature from the first scan, and then scanned between 30 and 250°C at a scan rate of 20°C/min. The glass transition temperature was taken as the midpoint of the heat capacity transition between the upper and lower points of deviation from the extrapolated glass and liquid lines.
Infrared Spectroscopy. FTIR spectra were recorded using a Nicolet Avatar 320 FTIR spectrometer and NaCl disks; 32 scans were collected at a resolution of 1 cm-1. The DMF solution containing the sample was cast onto a NaCl disk and dried under conditions similar to those used in the bulk preparation. The sample chamber was purged with nitrogen to maintain film dryness.
Solid-State NMR Spectroscopy. High-resolution solid-state13C NMR spectroscopy experiments were performed at 25°C using a Bruker DSX-400 spectrometer operating at a resonance frequency of 100.47 MHz. High-resolution solid state13C NMR spectra were acquired using the cross-polarization (CP)/magic-angle spinning (MAS)/high-power dipolar decoupling (DD) technique, with a 90 °C pulse width of 3.9µs, a pulse delay time of 3 s, an acquisition time of 30 ms, and 2048 scans. A magic-angle sample-spinning rate of 5.4 kHz was used to avoid absorption overlapping. The proton spin-lattice relaxation time in the rotating frame (T1FH) was determined indirectly via carbon observation using a 90°Cτ-spin lock pulse sequence prior to CP. The data acquisition was performed at delay times (τ) ranging from 0.1 to 12 ms with a contact time of 1.0 ms.
Transmission Electron Microscopy. TEM analysis was performed using a Hitachi H-7500 electron microscope operated at 100 kV. Ultrathin sections of the samples were prepared using a Leica Ultracut UCT microtome equipped with a diamond knife. Slices of ca. 700 Å thickness were cut at room temperature. Some of the sliced samples were stained with the vapor from an aqueous solution of RuO4. The contrast between poly(methyl methacrylate) and the two other polymers increased in these samples because poly(methyl methacrylate) is selectively unstained.
Results and Discussion
Block Copolymer Characterization. PMMA-b-PVP diblock copolymer was synthesized as indicated in Scheme 1. The
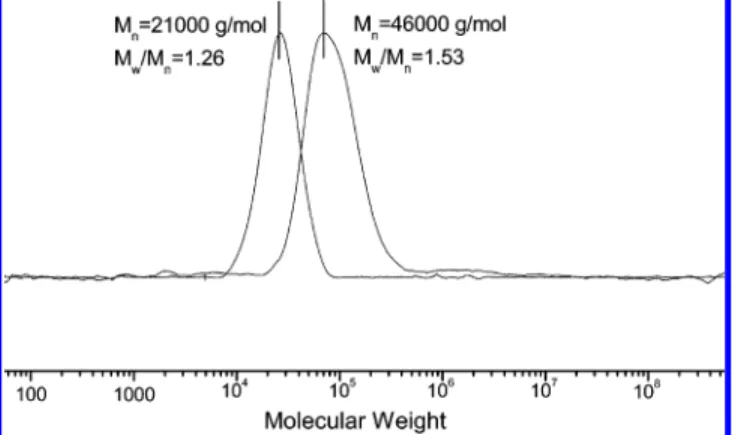
molecular weight distribution of the block copolymer, as measured using GPC (Figure 1), indicates that the value of Mw/
Mn of PMMA was 1.26; the polydispersity of the block
copolymer of methyl methacrylate and vinylpyrrolidone was 1.53. The number-average molecular weight of the PMMA block was 21 000 g/mol, and that of the block copolymer was 46 000 g/mol. Parts a and b of Figure 2 display the1H NMR spectra
of the azo-PMMA macroinitiator and block copolymer. The latter spectrum features peaks that are characteristic of the resonances of both the PMMA and PVP blocks. The DSC analyses of the azo-PMMA macroinitiator and the PMMA-b-PVP copolymer were also conducted for thermal characterizaton. The value of Tg of azo-PMMA is 106 °C. Only one glass
transition for the PMMA-b-PVP diblock copolymer was ob-served at 130 °C, indicating that the diblock copolymer is miscible between PMMA and PVP, which is in agreement with results reported in the literature.23,24
Blends of PMMA-b-PVP and PVPh. Fourier Transform Infrared Spectroscopic Analyses. Scheme 2 summarizes the signals observed for the free and hydrogen-bonded hydroxyl and carbonyl vibrations in the IR spectra of both PMMA and PVP mixed with PVPh. Figure 3 displays the FTIR spectra, recorded at room temperature in the region 2700-4000 cm-1 (OH stretching), of PVPh and various PMMA-b-PVP/PVPh blends; the OH stretching signals of PMMA/PVPh (50/50) and PVP/PVPh (50/50) blends are also included for comparison. Under ambient conditions, the pure PVPh self-associated through the formation of intermolecular hydroxyl multimers. As indicated in Figure 3i, the hydroxyl band of the pure PVPh consists of two components: a relatively narrow band at 3525 cm-1from the free hydroxyl groups and a broad band centered at 3360 cm-1 representing a wide distribution of hydrogen-bonded hydroxyl groups. Here, we focus on the variation of hydrogen-bonded hydroxyl groups. The hydroxyl groups of PVPh that form hydrogen bonds with PVP and PMMA underwent frequency shifts to 3250 (Figure 3a) and 3390 cm-1 (Figure 3j), respectively. From parts b-h of Figure 3, we observe in general that the hydroxyl groups of PVPh form hydrogen bonds with PVP more preferentially at lower PVPh content (i.e., the signal of the hydrogen-bonded hydroxyl groups appears mainly at 3250 cm-1). At higher PVPh contents, the hydroxyl groups of PVPh also form hydrogen bonds with the PMMA blocks (i.e., the signal of the hydrogen-bonded hydroxyl groups broadens).
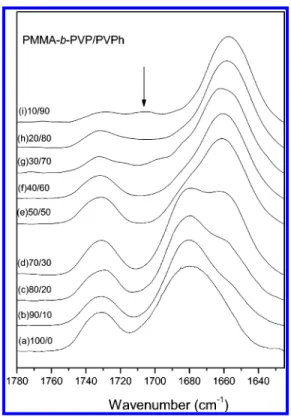
Figure 4 presents FTIR spectra of the carbonyl stretching region, ranging from 1630 to 1780 cm-1, of PMMA-b-PVP and its blends at room temperature. Two types of signals for carbonyl Figure 1. Molecular weight distributions of (a) poly(methyl
meth-acrylate) (Mw/Mn ) 1.26; Mn ) 21 000 g/mol) and (b) the block copolymer (Mw/Mn) 1.53; Mn) 46 000 g/mol).
Figure 2. 1H NMR spectra (CDCl
3) of (a) the PMMA macroinitiator and (b) the PMMA-b-PVP block copolymer.
stretching appear for the pure PMMA-b-PVP: the amide carbonyl stretching band of the PVP at 1680 cm-1 and the carbonyl stretching band of PMMA at 1730 cm-1. When the PVPh content in the blend is increased, a new band appears at 1660 cm-1, reflecting the presence of intermolecular hydrogen bonding between the PVP and PVPh units. In contrast, no peak
shifting and no new peaks developed for PMMA carbonyl group stretching in these blends containing a PVPh content below 60 wt %; this result implies that the PMMA carbonyl groups interact only insignificantly with PVPh when the PVPh content is less than 60 wt %. Table 1 summarizes all of these curve fitting results, i.e., the fraction of hydrogen-bonded carbonyl groups14,18of PVP and PMMA as a function of PVPh content.
It is clear that the PVPh hydroxyl groups begin to form hydrogen bonds with PMMA when the PVPh content is greater than 60 wt %.
These FTIR spectra are consistent with the predictions made using the Painter-Coleman association model (PCAM). Ac-cording to the PCAM,18the interassociation equilibrium constant
of the PVPh/PVP blend (KA) 6000, determined using a model
compound) is significantly greater than that of the PVPh/PMMA blend (KA ) 37.4). The FTIR spectra confirm the tendency
predicted by the PCAM, i.e., that the hydrogen bond formation between PVPh and PVP predominates over that between PVP and PMMA in the PMMA-b-PVP/PVPh blends.
Thermal Analyses. Figure 5 displays DSC thermograms of PMMA-b-PVP/PVP blends in various compositions. The value Figure 3. FTIR spectra recorded at room temperature displaying the
hydroxyl stretching vibration region (2700-4000 cm-1) for (a) PVP/ PVPh (50/50), (b-h) PMMA-b-PVP/PVPh blends of various composi-tions [(b) 80/20, (c) 70/30, (d) 50/50, (e) 40/60, (f) 30/70, (g) 20/80, (h) 10/90], (i) pure PVPh, and (j) PMMA/PVPh (50/50).
Figure 4. FTIR spectra recorded at room temperature displaying the
carbonyl stretching vibration region (1650-1780 cm-1) for
PMMA-b-PVP/PVPh blends of various compositions: (a) 100/0, (b) 90/10, (c)
80/20, (d) 70/30, (e) 50/50, (f) 40/60, (g) 30/70, (h) 20/80, (i) 10/90.
Table 1. Curve-Fitting of the Fraction of Hydrogen-Bonded Carbonyl Groups within the PMMA-b-PVP/PVPh Blends
PVP free CdO PVP H-bonded CdO polymer PVPh content, wt % ν, cm-1 W1/2, cm-1 Af (%) ν, cm-1 W1/2, cm-1 Ab (%) fb (%)a PVP 10 1683 27 65.8 1660 31 34.2 28.5 20 1682 25 54.9 1659 29 45.1 38.7 30 1682 25 43.9 1659 30 56.1 49.5 50 1681 24 17.1 1660 30 82.9 78.9 60 1683 24 9.9 1660 30 90.1 87.5 70 1682 25 6.7 1660 31 93.3 91.5 PMMA 60 1731 22 100 0 70 1732 22 76.3 1700 32 23.7 17.1 80 1731 22 61.0 1701 30 39.0 29.9 90 1729 22 48.2 1701 29 51.8 41.7 af
b) fraction of hydrogen bonding.
Figure 5. DSC thermograms of PMMA-b-PVP/PVPh blends of different compositions.
of the glass transition temperature (Tg) of PVPh is 150°C (0/
100); the PMMA-b-PVP block copolymer has only one glass transition, at 130°C (100/0). For PMMA-b-PVP/PVPh blends, each composition exhibits a single glass transition, indicating that blends of these compositions are macroscopically miscible, except for the blend containing 50 wt % of PVPh, for which we observed two glass transitions. The lower one, at ca. 110
°C, can be assigned as reflecting a PMMA phase that had separated from the mixed phase of miscible PVP and PVPh. Presumably, this phenomenon results from the more favored formation of hydrogen bonds between PVP and PVPh than between PMMA and PVPh, as the FTIR spectra revealed.
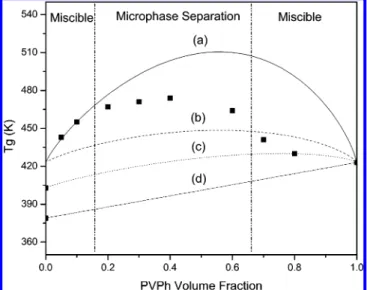
Figure 6 displays the dependence of the value of Tgon the
composition of the blends. We observed that the values of Tg
were all higher than those of the individual polymers; large positive deviations indicate that strong interactions exist within the blends. The typical Fox and Gordan-Taylor equations are not suitable for describing this complicated blend system (data not shown here). Actually, the behavior of the values of Tgof
PMMA/PVPh and PVP/PVPh has been reported based on the linear rule (Figure 6d)25,26and configurational entropy (Figure
6b)27models, respectively. Kim et al. recently proposed27the
configurational entropy model to predict the glass transition behavior of polymer blends that feature specific interactions between the components:
where Tg1, Tg2, and Tg12are the values of Tgof the pure polymers
1 and 2 and of their blend, respectively; φiand riare the volume
fraction and degree of polymerization, respectively, of polymer i; z is the lattice coordination number,β ) zR/(M1u∆Cpp), where
R, M1u, and∆Cpare the gas constant, the molecular weight of
the repeat unit, and the isobaric specific interaction of polymer 1, respectively;γspe is a proportionality constant representing
the specific interactions, such as hydrogen-bonding, dipole-dipole, or ionic interactions, between the two polymers. Kim et al. reported a value ofγspeof 288.1 for blends of PVP and
PVPh, but this value is not appropriate for use with
PMMA-PVP/PVPh blends, as indicated in Figure 6. A value ofγspeof
900 fits well at relatively lower PVPh contents (<20 wt %), but increased deviation occurs between the predicted and experimental data upon increasing the PVPh content. At lower PVPh contents (<20 wt %), the value of Tgincreased
signifi-cantly, presumably because of nanoconfinement of PVP/PVPh with a PMMA corona phase as a result of hydrogen bonding predominantly between PVP and PVPh (Scheme 3). Upon further increasing the PVPh content (<60 wt %), segregation transition of the PMMA domain occurred to further reduce the value of Tg. Total miscibility on the macro- and microscales is
expected at relatively higher PVPh contents (e.g., 80 wt %), i.e., a mixed phase of miscible PMMA, PVP, and PVPh, because the hydroxyl groups of PVPh also interact with the carbonyl groups of PMMA, as evidenced from FTIR spectroscopic analyses. As a result, the value of Tgat this composition can be
predicted well using a combination of the linear rule of PMMA/ PVPh (Figure 6d) and the entropy configurational model of PVP/ Figure 6. Plots of Tgvs composition based on (9) experimental data
and (a, b) the entropy configuration models of PVP/PVPh with (a)γspe ) 900 and (b) γspe) 288, (c) a combination of (b) and (d) for
PMMA-b-PVP/PVPh, and (d) the linear rule of PMMA/PVPh.
ln
(
Tg12 Tg1)
) β(
1 -γspeln(
z - 1 e)
)(
φ1 r1ln φ1+ φ2 r2 ln φ2)
+ φ2ln(
Tg2 Tg1)
(1)Scheme 3. Schematic Illustration of the Phase Behavior of the PMMA-b-PVP/PVPh Blends
Figure 7. 13C CP/MAS spectra recorded at room temperature for PMMA-b-PVP/PVPh blends of different compositions (weight ratios)
PVPh with a value ofγspeof 288.1 (Figure 6b), as indicated in
Figure 6c.
These DSC results suggest that phase transition occurs because PMMA is a significantly weaker hydrogen bond acceptor than is PVP. Added PVPh preferentially forms hydrogen bonds with PVP, rather than with PMMA, and thus, the PMMA blocks are excluded from the PVP/PVPh phase. To further investigate this phase behavior in detail, we measured the spin-lattice relaxation times (T1FH) in the rotating frame
to examine the homogeneity of the PMMA-b-PVP/PVPh blends on the molecular scale (i.e., below 20 nm).
13C CP/MAS State NMR Spectroscopic Analyses.
Solid-state NMR spectroscopy is often used to better understand the phase behavior and interactions within polymer blends.28-30
Figure 7 displays the13C CP/MAS spectra of pure PVPh,
PMMA-b-PVP, and PMMA-b-PVP/PVPh blends at various compositions. The signal for the resonance of the phenolic carbon atom of PVPh at 153 ppm underwent a gradual downfield shift upon blending with PMMA-b-PVP. The shift was ca. 2.5 ppm for a blend containing 80 wt % PMMA-b-PVP, indicating that specific interactions exist between PVPh and the block copolymer; this finding is consistent with the results of our FTIR spectroscopic analyses.
As we discussed earlier, our DSC analyses revealed that phase separation occurred for the 50/50 PMMA-b-PVP/PVPh blend on a scale of ca. 20-40 nm;31,32 we chose to study, through
measurement of proton spin-lattice relaxation times in the rotating frame (T1FH), whether phase separation also occurred
for other compositions on an even smaller scale (<20 nm). We
measured the values of T1FH of the blends through
delayed-contact13C CP/MAS experiments, using eq 2:
whereτ is the spin-lock time used in the experiment, and M0
and Mτ are the intensities of the peaks initially and at time τ, respectively. Parts a-f of Figure 8 present the values of ln-(Mτ/M0) plotted againstτ. We estimated the homogeneities of
these polymer blends through quantitative analyses based on the PMMA-b-PVP carbonyl carbon atom’s resonance at 177 ppm (Figure 8a-c) and the PVPh phenolic carbon atom’s resonance at 153 ppm (Figure 8d-f). We obtained single-exponential decays in T1FHfor pure PMMA-b-PVP, the 20/80
PMMA-b-PVP/PVPh blend, and pure PVPh (Figure 8a, c, e, and f), suggesting that the block copolymer, the 20/80 PMMA-b-PVP/PVPh blend, and PVPh are homogeneous on the scale at which spin diffusion occurs within the time T1FH. In contrast,
the T1FH decays of the carbonyl and phenolic carbon atoms’
resonance of the 80/20 PMMA-b-PVP/PVPh blend were not single-exponential (Figure 8b and d); in addition to a main decay, there also exists a slow decaying component, indicating that two domains, with distinct mobilities, were present in this blend33,34on a scale below 20 nm.
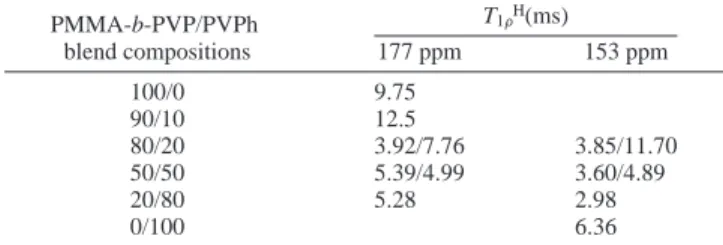
From the slopes of fitted lines, we determined the values of T1FH, which are listed in Table 2, for various compositions of
PMMA-b-PVP/PVPh blends. Blends containing less than 10 wt % of PVPh display homogeneous single-exponential behavior. When the PVPh content increases to 20 wt %, nonexponential Figure 8. Semilogarithmic plots of the magnetization intensities vs delay time, with a contact time of 1.0 ms, for PMMA-b-PVP/PVPh blends at
177 ppm: (a) PMMA-b-PVP, (b) 80/20, and (c) 20/80; at 153 ppm: (d) 80/20, (e) 20/80, and (f) pure PVPh.
ln(Mτ/M0) ) -τ/T1F H
relaxation behavior occurs because the phase transits into two domains: i.e., a PMMA phase that separated from a mixed phase of miscible PVP and PVPh. At higher PVPh contents, the blends became homogeneous again as a result of hydrogen bond formation between PMMA and PVPh.
Combining results of the FTIR spectroscopic, DSC, and delayed-contact 13C CP/MAS experiments, we conclude that
phase transition actually began to occur when the blends contained ca. 20-60 wt % of PVPh. Furthermore, the blends became homogeneous when the PVPh content was larger than 60 wt % because hydrogen bonds began to form between the PMMA and PVPh units (from Table 1).
TEM Analyses. We visualized the morphology of the phase transition through TEM analysis of a film of the PMMA-b-PVP/PVPh blend (70/30). The film was stained with RuO4,
whereupon the PVPh chain was deeply stained, the PVP chain was only lightly stained, and the PMMA chain was selectively unstained. Figure 9 indicates that two phases are present in the film of the blend. The matrix, i.e., the gray region, corresponds to a mixed phase of lightly stained PVP and deeply stained PVPh; the bright region, with formation of micellar domains, corresponds to a PMMA phase that had been excluded from the mixed phase because of its significantly weaker ability to form hydrogen bonds with PVPh. The large black regions dispersed in the matrix probably arose from imperfect staining. Our studies of the phase behavior in these A-B/C-type PMMA-b-PVP/PVPh blends, performed using IR spectroscopy, DSC,13C CP/MAS NMR spectroscopy, and TEM, suggest that
phase transition occurred for blends containing ca. 20-60 wt % of PVPh. Scheme 3 summarizes the detailed phase behavior of these PMMA-b-PVP/PVPh blends. Pure PMMA-b-PVP exhibits good miscibility between its two blocks. When ca. 20-60 wt % of PVPh was present in the blend, segregation transition
occurred into domains containing a matrix of mixed PVP and PVPh and micellar domains of excluded PMMA. These blends become homogeneous again when the PVPh content was greater than 60 wt % because, under these conditions, hydrogen bonds formed between PMMA and PVPh also.
Conclusions
We have investigated the phase behavior, mediated by hydrogen-bonding interactions, of novel A-B/C-type PMMA-b-PVP/PVPh blends. We synthesized the PMMA-b-PVP co-polymer by combining atom transfer radical co-polymerization with conventional radical polymerization. FTIR spectra provided evidence that the PVP carbonyl groups are significantly stronger hydrogen bond acceptors than are the PMMA carbonyl groups. Furthermore, DSC revealed that phase transition existed in this A-B/C blend system. FTIR and13C CP/MAS NMR spectra
provided additional evidence confirming that phase transition occurred for the blends containing ca. 20-60 wt % of PVPh. TEM imaging clearly indicated that the morphology of the segregation transition consisted of a matrix of a homogeneous mixed PVP/PVPh phase and micellar domains of excluded PMMA. The blends became homogeneous again when the PVPh content was greater than 60 wt % because hydrogen bonds also formed between the PMMA and PVPh units. In conclusion, the diversity of attractive interactions (ξ) between the PMMA and PVPh and the PVP and PVPh moieties appears to be a major factor influencing the phase behavior of this A-B/C blend system.
Acknowledgment. This research was supported financially by the National Science Council, Taiwan, Republic of China, under contract no. NSC-94-2216-E-009-002 and Ministry of Education “Aim for the Top University” program (MOEATU program).
References and Notes
(1) Lowenhaupt, B.; Steurer, A.; Hellmann, G. P. Polymer 1991, 32, 1065. (2) Lowenhaupt, B.; Steurer, A.; Hellmann, G. P.; Gallot, Y.
Macromol-ecules 1994, 27, 908.
(3) Tucker, P. S.; Barlow, J. W.; Paul, D. R. Macromolecules 1988, 21, 2794.
(4) Tucker, P. S.; Paul, D. R. Macromolecules 1988, 21, 2801. (5) Hashimoto, T.; Tanaka, H.; Hasegawa, H. Macromolecules 1990, 23,
4378.
(6) Hashimoto, T.; Kimishima, K.; Hasegawa, H. Macromolecules 1991, 24, 240.
(7) Tanaka, H.; Hashimoto, T. Macromolecules 1991, 24, 5713. (8) Zhao, J. Q.; Pearce, E. M.; Kwei, T. K. Macromolecules 1997, 30,
7119.
(9) Han, Y.-K.; Pearce, E. M.; Kwei, T. K. Macromolecules 2000, 33, 1321.
(10) Lee, J. H.; Balsara, N. P.; Chakraborty, A. K.; Krishnamoorti, R.; Hammouda, B. Macromolecules 2002, 35, 7748.
(11) Matyjaszewski, K.; Xia, J. Chem. ReV. 2001, 101, 2921. (12) Destarac, M.; Boutevin, B. Polym. Prepr. 1998, 39, 568.
(13) Paik, H-J.; Teodorescu, M., Xia, J.; Matyjaszewski, K. Macromolecules 1999, 32, 7023.
(14) Kuo, S. W.; Chang, F. C. Macromolecules 2001, 34, 5224. (15) Kuo, S. W.; Chang, F. C. Polymer 2003, 44, 3021.
(16) Zhang, X.; Takegoshi, K.; Hikichi, K. Macromolecules 1991, 24, 5756. (17) Zhang, X.; Takegoshi, K.; Hikichi, K. Macromolecules 1992, 25, 4871. (18) Coleman, M. M.; Graf, J. F.; Painter, P. C. Specific Interactions and the Miscibility of Polymer Blends; Technomic Publishing: Lancaster, PA, 1991.
(19) Coleman, M. M.; Xu, Y.; Painter, P. C. Macromolecules 1994, 27, 127.
(20) Moskala, E. J.; Varnell, D. F.; Coleman, M. M. Polymer 1985, 26, 228.
(21) Hu, Y.; Motzer, H. R.; Etxeberria, A. M.; Fernadez-Berridi, M. J.; Iruin, J. J.; Painter, P. C.; Coleman, M. M. Macromol. Chem. Phys.2000, 201, 705.
(22) Keller, R. N.; Wycoff, H. D. Inorg. Synth. 1946, 2, 1. Table 2. Values of T1GHof the PMMA-b-PVP Copolymer, Pure
PVPh, and Various Compositions of PMMA-b-PVP/PVPh Blends T1FH(ms) PMMA-b-PVP/PVPh blend compositions 177 ppm 153 ppm 100/0 9.75 90/10 12.5 80/20 3.92/7.76 3.85/11.70 50/50 5.39/4.99 3.60/4.89 20/80 5.28 2.98 0/100 6.36
Figure 9. Transmission electron micrograph of the solution-cast film
of the 70/30 (wt %) PMMA-b-PVP/PVPh blend stained with RuO4. The dark region (matrix) corresponds to a mixed phase of -PVP and PVPh; the white region (micelles) corresponds to excluded -PMMA.
(23) Hsu, W. P. J. Appl. Polym. Sci. 2001, 81, 3190.
(24) da Silva, E. P.; Tavares, M. I. B. Polym. Bull. 1998, 41, 307. (25) Li, D.; Brisson, J. Macromolecules 1996, 29, 868.
(26) Lin, C. L.; Chen, W. C.; Liao, C. S.; Su, Y. C. Huang, C. F. Kuo, S. W.; Chang, F. C. Macromolecules 2005, 38, 6435.
(27) Kim, J. H.; Min, B. R.; Kang, Y. S. Macromolecules 2006, 39, 1297. (28) Hill, D. J. T.; Whittaker, A. K.; Wong, K. W. Macromolecules 1999,
32, 5285.
(29) Kuo, S. W.; Chang, F. C. Macromolecules 2001, 34, 4189.
(30) Cheung, M. K.; Wang, J.; Zheng, S.; Mi, Y. Polymer 2000, 41, 1469. (31) Utracki, L. A. Polymer Alloys and Blends; Hanser: Munich, 1989. (32) Guo, M. Trends Polym. Sci. 1996, 4, 238.
(33) Tanaka, H.; Nishi, T. Phys. ReV. B 1986, 33, 32.
(34) Stejskal, E. O.; Schaefer, J.; Sefcik, M. D.; McKay, R. A. Macro-molecules 1981, 14, 275.