2
films prepared by the wet chemical process
Chu-Chi Ting and San-Yuan Chena)
Department of Materials Science and Engineering, National Chiao-Tung University, Hsinchu, Taiwan 300, Republic of China
(Received 5 June 2000; accepted 23 March 2001)
TiO2thin films prepared by metalorganic decomposition (MOD-TiO2) and sol-gel processes (SG-TiO2) were investigated in terms of the anatase-to-rutile phase
transformation and microstructural evolution. It was found that the chemical reactivity of the ligand groups initially coordinated on the titanium precursor plays a decisive role in the structure development of as-deposited SG- and MOD-TiO2films.
MOD-TiO2films consist of small aggregated particles and therefore, tend to coalesce together to form an inhomogeneous microstructure during the anatase-to-rutile phase transformation. On the other hand, SG-TiO2 films consist of uniform large particles that tend to grow homogeneously. MOD-TiO2films showed a higher crystallization temperature than the SG-TiO2films but the temperature of the anatase-to-rutile phase transformation is much lower in MOD- (approximately 775 °C) as compared to SG-TiO2films (approximately 930 °C). The activation energy (Q) was estimated as 524 and 882 kJ/mol for the MOD- and SG-TiO2films, respectively. The lower transformation temperature and activation energy in MOD-TiO2films were due to smaller grain size and more potential nucleation sites existing in the un-transformed MOD-TiO2film structure, which can accelerate the rate of anatase-to-rutile
transformation.
I. INTRODUCTION
Titanium dioxide thin films have received great atten-tion in recent years because of their excellent optical and electronic properties.1–3The wet chemical route, includ-ing metalorganic deposition (MOD) and sol-gel methods, has been recognized to be technologically and economi-cally significant because they offer advantages over con-ventional techniques such as relatively low processing temperatures. In the sol-gel process, metal alkoxides Ti(OR)4(where R represents alkyl groups) are generally used as principal precursors. Further hydrolysis and po-lymerization cause the formation of a three-dimensional network structure with octahedral TiO6coordination.
4–8 In contrast to the sol-gel method, the MOD process typi-cally employs metal carboxylate precursors with long carbon chains such as titanium 2-ethylhexoxide, which is chemically stable and insensitive to water molecules. Po-lymerization of the MOD precursors seems inaccessible, and the formation of a three-dimensional network struc-ture is impossible. The coordination number of the Ti atom is maintained at 4 in the MOD solution. Therefore,
from a comparative viewpoint, the nature of ligand groups in titanium precursors should affect the final structure of the crystalline TiO2to a certain extent.
The TiO2 crystal has three modification phases, namely, anatase, rutile, and brookite; however, only the first two have received most attention. The rutile phase is a high-temperature stable phase (>700 °C), while the anatase is stable only at lower temperature.9,10Both crys-talline phases are composed of octahedral TiO6 where one Ti atom is coordinated with 6 oxygen atoms. The phase transformation of anatase-to-rutile (A → R) in TiO2is a research objective of considerable interest with respect to both powder and thin film. Even though the A →R phase transformation of TiO2powder derived from the hydrolysis of titanium alkoxides has been studied, many earlier works are mainly focused on the influence of hydrolysis kinetics.11–13 Furthermore, the lower-dimensional configuration of the thin-film form usually gives rise to an enhanced complexity in the phase trans-formation (and kinetics as well) by the constraint induced by the underlying substrate.14 Literature reports of the influence of the ligand group on the phase transformation as well as the microstructural evolution in the synthesis of TiO2thin films are not extensive.
a)
Address all correspondence to this author. e-mail: [email protected]
Therefore, we conducted a comparative study between sol-gel and MOD processes using Ti precursors with a significant difference in ligand nature. Both films were subjected to an identical heat treatment. We wish to understand (i) how the coordinated ligand groups affect the A → R phase transformation, (ii) the microstruc-tural evolution, and (iii) the activation energy of the A → R phase transformation for the sol-gel and MOD-TiO2 films.
II. EXPERIMENTAL PROCEDURE
A. Sol-gel and MOD solution preparation
Titanium isopropoxide Ti(OC3H7
i
)4(Alfa, 99.8%) was used as a titanium precursor in the sol-gel process. The reactivity of titanium isopropoxide toward water is first modified by acetic acid (TEDA, 99.9%) (molar ratio of Ti/HOAc ⳱ 1/10). Then 2-methoxyethanol (Merck, 99%) (Darmstadt, Germany) was added to adjust the vis-cosity and molar concentration of the mixture. The me-thoxyethanol not only acts as solvent but also reacts with unreacted acetic acid to form isopropyl acetate and water. This sol-gel solution with titanium molar concentration of approximately 0.47 M was vigorously stirred at room temperature for 10 h to ensure a sufficient degree of hydrolysis and polycondensation.
Titanium 2-ethylhexoxide Ti(C8H17O)4 (Alfa, 98%) was used as a titanium precursor in the MOD process. P-xylene was used as a solvent to reduce the viscosity of the titanium 2-ethylhexoxide for film fabrication. The molar concentration of titanium ions in MOD solution was about 0.93 M.
B. Fabrication of thin films
The thin films were fabricated by spin coating onto fused silica substrates at a rotation speed of 3000 rpm for 30 s. After each deposition, the coating film was dried on a hot plate (approximately 200 °C for 2 min) to remove the organic solvent and then pyrolyzed in air at 400 °C for 10 min with a heating rate of 5 °C/min to decompose organic species. For multiple coatings, the above-mentioned processes were repeated six times to obtain the resulting sol-gel and MOD-TiO2 films with a thick-ness of approximately 300 nm. For a phase transfor-mation study, the resulting films were directly annealed into a preheated furnace with temperatures between 500 and 1000 °C under an air environment for various time periods.
C. Film characterization
The phase evolution of sol-gel and MOD films was ex-amined by an x-ray diffractometer (MAC Science, M18X) (Tokyo, Japan) using Cu K␣ radiation. The thickness
of the films was measured using a surface profiler (Sloan, Dektak3ST). The xerogel powder scraped from the dried film on the substrate was mixed with KBr and then was die pressed to be a pellet for the Fourier transform infra-red (FTIR) transmission spectra measurement (with Perkin-Elmer 580 spectrometer). The microstructure of the films was examined using scanning electron micros-copy (SEM; Hitachi, S4000) (Tokyo, Japan). The aver-age grain size in the TiO2films after different annealing temperatures was estimated using linear intercepts on the SEM micrographs according to the technique developed by Mendelson et al.15
III. RESULTS AND DISCUSSION
A. Role of titanium precursors in phase evolution
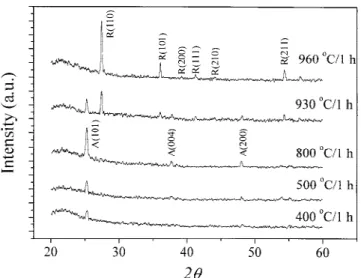
Figure 1 shows the XRD patterns of the sol-gel-derived TiO2films (designated as SG-TiO2). Crystalline anatase first appeared with a weak (101) peak at 400 °C. However, no rutile phase was detectable until a tempera-ture as high as 930 °C was attained where a characteristic reflection of the (110) peak appeared. It is interesting to note that the transformation temperature for the SG-TiO2 film is higher by approximately 300 °C than that of nanocrystalline TiO2powders, 650 –700 °C and sputtered TiO2 films, approximately 700 °C.16,17 On the other hand, an anatase phase with a strong (101) reflection appeared when the temperature reached 500 °C for the MOD-TiO2 films, as shown in Fig. 2. The formation temperature of rutile phase is about 750 –775 °C, which is lower by approximately 200 °C than that observed for SG-TiO2 films, and is only higher by approximately 50 °C than temperatures reported for the nano-powder TiO2.16 If we refer to this additional 50 °C as a corre-sponding extra energy required to overcome the substrate
FIG. 1. XRD patterns of SG–TiO2films annealed at different
constraint, then, on a comparative basis, more energy (i.e., the additional 250 °C increment) is required to trig-ger the phase transformation in the SG-TiO2films.
Since the only variable in the preparation of both films is the difference in the starting chemical precursors, this leads us to suggest a possible cause resulting from the difference in chemical reactivity between Ti(OC3H7
i
)4 and Ti(C8H17O)4. For the sol-gel process, the titanium isopropoxide can be first modified by acetic acid to pro-duce titanium isopropoxide acetate, which undergoes further hydrolysis and polycondensation to form a three-dimensional TiO6 network structure.4 – 6,18
The IR transmission spectrum of the dried SG-TiO2 film is analyzed and shown in Fig. 3. The broad band around 3500 cm−1 is due to O–H stretching vibrations
of the hydroxyls present in the system. Two bands as-signed as sym(COO) at 1455 cm
−1
and asym(COO) at 1560 cm−1are consistent with those defined as bidentate ligands.19–21Compared with the FTIR spectrum of tita-nium isopropoxide, the bands around 2960–2870 cm−1 corresponding to the stretching vibrations of the CH2and CH3in isopropoxy ligands does not appear.
5,22
In addi-tion, the band around 1030 cm−1 due to the Ti(O – C) stretching vibration of the isopropoxy groups bonded to titanium ions obviously weakened,5,22,23 implying the displacement of isopropoxy groups from titanium ions. The bands between 800 and 400 cm−1could be attributed to Ti–O–Ti bonds.5,22,24,25 Thus, these observations indicate that titanium isopropoxide moleculars have undergone hydrolysis/polymerization reaction and formed a three-dimensional network structure.
In contrast, the IR spectrum of the dried MOD-TiO2 film exhibits sharp bands around 2960–2870 cm−1 and 1475–1395 cm−1corresponding to the stretching and bonding vibrations of the CH2 and CH3 groups in 2-ethylhexoxy ligands, respectively. The bands around 1200 –1000 cm−1can be assigned as a result of stretching mode of Ti(O–C), indicating that Ti atoms still coordi-nated with 2-ethylhexoxy groups. As expected, no Ti–O–Ti bond was detected, suggesting that Ti atoms are still tetra-coordinated with four 2-ethylhexoxy ligands (i.e., titanium 2-ethylhexoxide did not undergo hydrolysis/condensation reaction, so the as-deposited MOD-TiO2 film still consists of titanium 2-ethylhexoxide monomers).
B. Phase crystallization and transformation
Comparing Figs. 1 and 2 shows that a lower crys-tallization temperature (Tcry) is obtained for the
SG-TiO2 (Tc r y ⳱ approximately 400 °C) than the
MOD-TiO2 (Tcry ⳱ approximately 500 °C) films. This phenomenon indicates that the chemical reactivity of the ligand groups initially coordinated with the Ti atom plays a decisive role in the subsequent crystallization process. When the as-deposited MOD-TiO2 film is pyrolyzed from room temperature to 400 °C, more energy must be consumed to break the organic bonds of titanium 2-ethylhexoxide monomers. Subsequently, both Ti and O atoms rearrange themselves to form a three-dimension network structure. On the other hand, since a disorder three-dimensional network structure has already formed in the as-deposited SG-TiO2 films, the less energy is required for the re-arrangement of the disorder structure to form a long-range order octahedral TiO6 network structure. Consequently, the anatase phase can be crys-tallized at a lower temperature for the SG- than MOD-TiO2films.
In addition, an appreciable difference in the tempera-ture (Ttran) for the A → R phase transformation was observed (i.e., Ttran⳱ 750 to 770 °C for the MOD-TiO2
FIG. 2. XRD patterns of MOD-TiO2films annealed at different
tem-peratures for 1 h.
film and Ttran⳱ 900 to 930 °C for the SG-TiO2 films, reflecting to a relatively higher energy for the SG-TiO2 films to initiate the A→R phase transformation than that for the MOD-TiO2 films). However, this finding is op-posite to that observed for the crystallization temperature mentioned above. This can be attributed to the fact that the as-pyrolyzed SG-TiO2film (i.e., the film was heat-treated at 400 °C for 1 h) has a better crystallinity (i.e., less lattice defects) than as-pyrolyzed MOD-TiO2 film.
The role of oxygen defects (vacancies) in the A→R phase transformation has been most-commonly re-ported.10,26,27Shannon et al.10introduced oxygen vacan-cies into TiO2crystals by using a hydrogen atmosphere. They believed that the oxygen vacancies promote the Ti–O bond rearrangement, which in turn enhances the A →R phase transformation rate. Their explanation may be applicable to the transformation currently ob-served. However, in addition to oxygen defects, the dif-ference in the rate of phase transformation between the SG- and MOD-TiO2films is also strongly related to grain size.16 This is further elucidated in terms of the mi-crostrutural evolution in the forthcoming discussion.
To understand the difference of A→ R phase trans-formations between the SG- and MOD-TiO2 films, we estimate the phase variation using the following equa-tion.16,28Although this equation is based on the A→R phase transformation of titania powder, it is also adopted in our films because the x-ray diffraction (XRD) patterns of polycrystalline anatase/rutile phase in SG- and MOD-films are similar to those of powdered samples with completely random crystal orientations. The trans-formed fraction of rutile phase ( y) is defined as Equa-tion (1),
y= 1
冋
1+0.8×IAIR
册
, (1)
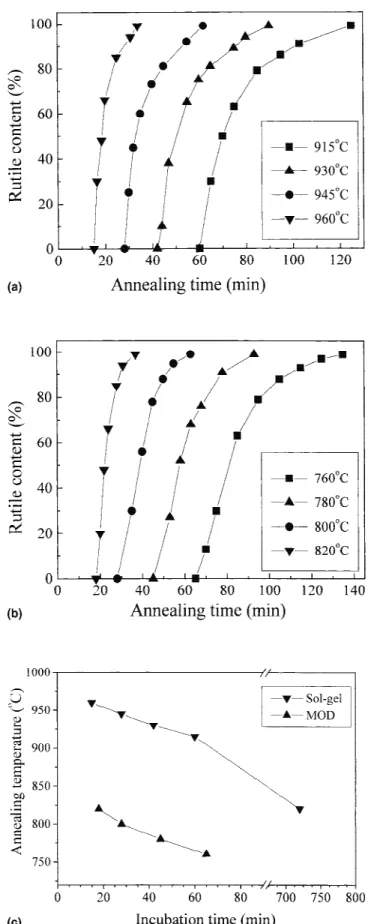
where IAⲐIRrepresent the x-ray integrated intensity ratio of the (101) reflection of the anatase and the (110) re-flection of the rutile. The resulting y is plotted in terms of annealing time (t) for both films. The relationship is shown in Figs. 4(a) and 4(b) where both films show a similar y-time sigmoidal curve for different annealing temperatures. In addition, there exists an annealing time period after which a measurable formation amount of rutile phase can be detected by XRD. The period is termed the incubation time and also related to precursor used. The pronounced sigmoidal relationship still signi-fies a nucleation-growth mechanism of the phase trans-formation that is consistent with previous observation on powdered TiO2 irrespective of factors such as the con-straint effect induced by the underlying substrate and the presence of an amorphous component (those two factors can cause a change in the rate of phase transfor-mation).10,29
FIG. 4. The transformed fraction of rutile phase for (a) SG-TiO2and
(b) MOD-TiO2films under different annealing temperatures and time
in air. (c) Incubation time as a function of annealing temperatures for the anatase to rutile phase transformation.
The incubation time of SG- or MOD-TiO2 films is much longer than that of powdered TiO2.
10
This phe-nomenon can be attributed not only to the substrate con-straint effect, but also to the amorphous-to-anatase (Am → A) transformation. Namely, the amorphous phase seems to first transform to an anatase phase, and then the anatase phase transforms to rutile. Furthermore, the MOD-TiO2films have much shorter incubation time, as compared to the SG-TiO2 films under identical an-nealing temperature [see Fig. 4(c)], indicating that a faster rate of nucleation and/or growth can be achieved for the MOD-TiO2film.
C. Microstructural evolution
The A → R phase transformation is a nucleation-growth process. Shannon et al.30 reported that the crys-tallography of the transformation using anatase TiO2 single crystals showed that the rutile phase was nucleated on the surface and then spread into to the anatase TiO2. The surface or grain boundaries nucleation in the nanocrystalline anatase TiO2for A→R phase transfor-mation was also observed by Kumar et al.31 and Ding
et al.16 Gribb et al.32 demonstrated that the rate of the polymorphic anatase to rutile transformation increases dramatically when the reacting anatase is very finely crystalline. Namely, the smaller anatase crystallite size possesses the more number of potential nucleation sites. So the rate of A→ R phase transformation will be ac-celerated. Therefore, it is believed that the SG- and MOD-TO2 films synthesized from different titanium
precursors should possess different numbers of potential nucleation sites, which can cause the obvious differences in A → R phase transformation between the SG- and MOD-TiO2 films. The distinct evolution of microstruc-tural morphology might provide clues for a better under-standing of the observed phase transformation.
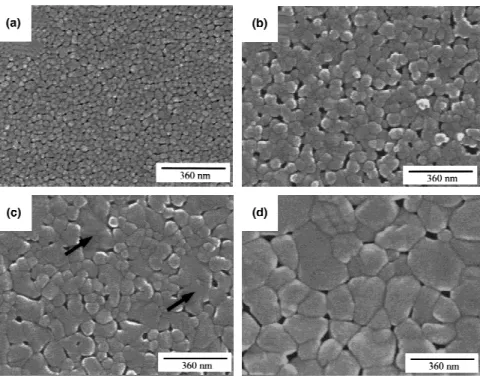
The SG-TiO2film exhibits a dense microstructure with an average grain size of approximately 35 nm at 700 °C, Fig. 5(a). The grains grew uniformly from 49 to 127 nm with increased annealing time at 930 °C, as shown in Figs. 5(b)–5(d). For the MOD-TiO2 film at 700 °C, a surface morphology similar to that of SG-TiO2 [Fig. 5(a)] is observed, but the grain size is smaller, i.e., approximately 27 nm, as shown in Fig. 6(a). However, a porous structure with a number of aggregated grains developed when the annealing temperature/time was in-creased to 780 °C/30 min [Fig. 6(b)], a temperature at which the phase transformation had not occurred. Further increase in annealing time causes aggregated grains to coalesce to form larger grains, as indicated by the arrows in Fig. 6(c), and an exaggerated grain growth was later observed, resulting in a bimodal grain size distribution [Fig. 6(d)].
As expected from the phase transformation aforemen-tioned, both films show an essentially different behavior of microstructural evolution. Because the number of po-tential nucleation sites is proportional to the specific sur-face area (SSA) of a crystalline grain, the number of potential nucleation sites will increase with decreasing grain size. Consequently, the transformation rate will be accelerated. In other words, the difference of the SSA
between the SG- and MOD-TO2 films will be used to estimate the occurring sequence of A →R phase trans-formation for the SG- and MOD-TO2films. The SSA is estimated by assuming a spherical grain to be 0.22 nm2/nm3 for the MOD-TiO2 films and 0.17 nm
2
/nm3 for the SG-TiO2films at 700 °C, suggesting a greater proportion of potential nucleation sites developed in the MOD-TiO2 films. This may explain a lower transformation tempera-ture observed for the MOD-TiO2 films; i.e., the phase transformation is accelerated. Additionally, the surface structure may be in a form of –Ti–O⭈ (unpaired oxygen) or –Ti–OH (hydroxyl groups), which are essentially highly active. A higher mobility of surface atoms is ex-pected, which facilitates further coalescence between grains at during the A→R phase transformation situa-tion. This coalescence phenomenon is potentially signifi-cant for smaller grains, and an Ostwald ripening mechanism33is expected to dominate the grain growth, leading to the formation of porosity [Fig. 6(b)] and bimodal grain size distribution [Fig. 6(d)] for the MOD-TiO2 films.
The grain size for both films was determined as a function of temperature shown in Fig. 7, where the rapid increase of grain size is observed with sintering tempera-ture after 780 °C for the MOD-TiO2film and 930 °C for the SG-TiO2film. This behavior could be illustrated by a mechanism termed phase-transformation-induced grain growth.34 These temperature ranges are approximately equal to that observed for the phase transformation (depicted in Fig. 1). This finding suggests the existence of a critical grain size to the A→R phase transformation
for both TiO2films. For the SG-TiO2 films, the critical grain size is about 75 nm and for the MOD-TiO2films, it is about 59 nm. We believe that the transformation kinetics of the MOD-TiO2 films or SG-TiO2 films is strongly dependent on the critical grain size.
D. Kinetics
From our viewpoint, we believe that the activation energy should be involved to overcome the effects of the substrate constrain and to lead to the amorphous-to-anatase (Am→A) transformation (i.e., crystallization),
FIG. 7. Dependence of grain size of SG- and MOD-TiO2films on
different annealing temperatures for 1 h.
FIG. 6. Microstructural evolution of MOD-TiO2 films annealed at (a) 700 °C/60 min, (b) 780 °C/30 min, (c) 780 °C/60 min, and (d)
rather than being supplied only for the anatase-to-rutile (A→R) phase transformation. A model, which has re-cently been proposed by Tagami et al.35,36 for phase transformation in a thin layer, was used to characterize the transformation kinetics of both films:
dy dt =Bt
n−1共1 −
y兲2−␥ , (2) where y is the fraction of rutile phase developed at a given time t, k is the reaction rate constant, and B is a model-dependent factor. The n is the time exponent, depending on the mechanism of nucleation/growth of an emerging phase. The explicit value of␥ is equal to 15/32 for growing spherical crystallites in three dimensions. After rearrangement and integration, Eq. (2) gives:
1.89
共1−y兲0.53=共kt兲
n
, (3)
a plot of ln [1.89/(1 − y)0.53] versus ln(t) with the slope equal to the exponent n and the intercept equal to ln(k). The activation energy (Q) for the transformation can then be obtained from the slope of a plot of ln(k) versus 1/T, assuming Arrhenius behavior [k⬀exp(−Q/ RT )]. The data presented in Fig. 4 were fit to Eq. (3), and the dependence of k on temperature (in Arrhenius from) is shown in Fig. 8. The Q values were estimated as 524 and 882 kJ/mol for MOD- and SG-TiO2 films, re-spectively. We note that the obtained Q values in TiO2 films are close to those Q (250–853 kJ/mol) reported for TiO2-based powders,10,29,37even though the as-prepared MOD- or SG-TiO2 films contain substrate constraint and an amorphous phase, which can cause a change in the rate of phase transformation. We also note that the
n values obtained for the MOD- and SG-TiO2films were 2.9 and 2.1, respectively, indicating diffusion controlled
growth, but with different nucleation rates.38This result is consistent with our suggestion that a faster rate of nucleation and/or growth can be achieved for the MOD-TiO2 film.
From the kinetic viewpoint, higher activation energy for the phase transformation means that a higher energy bar-rier needs to be overcome during the reaction. The fac-tors that affect the height of energy barrier should include the effect of substrate constraint, the breaking and rear-rangement of Ti–O bonds, and the grain size of un-transformed films. If it is assumed that the MOD- and SG-TiO2films have the same substrate constraint and the same bond strength to Ti–O, then the major difference in activation energy between MOD- and SG-TiO2films is primarily attributed to the grain size. Since the critical grain size in MOD-TiO2 film is smaller than SG-TiO2 film, the MOD-TiO2film has more surface/grain bound-aries nucleation sites to accelerate the A →R reaction. Therefore, MOD-TiO2 film has a lower phase transfor-mation temperature with smaller activation energy.
IV. CONCLUSIONS
(1) The anatase phase TiO2 film was completely transformed into single rutile phase in both SG- and MOD-TiO2 films at 700–1000 °C annealing.
(2) The chemical reactivity of the ligand groups, which are initially coordinated on the titanium precur-sors, plays a decisive role in structure evolution of SG- and MOD-TiO2films.
(3) MOD-TiO2films had a higher crystallization tem-perature than SG-TiO2 films but the transformation temperature of the anatase-to-rutile TiO2 phase is much lower in MOD- (approximately 775 °C) as compared to SG-TiO2films (approximately 930 °C).
(4) The lower activation energy (524 kJ/mol) in MOD-TiO2 films, as compared to that (882 kJ/mol) in SG-TiO2films is attributed to smaller grain size and more potential nucleation sites existing in the un-transformed MOD-TiO2film structure.
(5) MOD-TiO2 films consist of small aggregated particles and therefore tend to coalesce together to form an inhomogeneous microstructure during the A → R transformation. On the other hand, SG-TiO2films con-sist of uniform large particles that tend to grow homo-geneously.
ACKNOWLEDGMENTS
The authors would like to thank the National Science Council of the Republic of China, Taiwan, for financially supporting this research under Contract No. NSC-87-2218-E-009-016. Dr. D.M. Liu is appreciated for helpful discussions.
FIG. 8. Relationship of ln k versus 1/T for the SG- and MOD-TiO2
REFERENCES
1. G.P. Burns, J. Appl. Phys. 65, 2095 (1965).
2. F.B. Hadj, R. Sempere, and J. Phalippou, J. Non-Cryst. Solids 82, 417 (1986).
3. M.Gratzel, Coments Inorg. Chem. 12, 93 (1991).
4. G. Yi and M. Sayer, J. Sol-Gel Sci. Technol. 6, 65 (1996). 5. G. Yi and M. Sayer, J. Sol-Gel Sci. Tech. 6, 74 (1996). 6. C.J. Brinker and G.W. Scherer, Sol-Gel Science (Academic Press,
New York, 1990), p. 58.
7. F. Babonneau, S. Doeuff, A. Leaustic, C. Sanchez, C. Cartier, and M. Verdaguer, Inorg. Chem. 27, 3166 (1988).
8. C. J. Brinker and G.W. Scherer, Sol-Gel Science (Academic Press, New York, 1990), p. 46.
9. C.N.R. Rao, S.R. Yoganarasimhan, and P.A. Faeth, Trans. Fara-day Soc. 57, 504 (1961).
10. R.D. Shannon and J.A. Pask, J. Am. Ceram. Soc. 48, 391(1965). 11. E.E. Yoldas, J. Mater. Sci. 21, 1087 (1986).
12. S. Doueff, M. Henry, C. Sanchez, and J. Livage, J. Non-Cryst. Solids 89, 206 (1987).
13. J.F. Quinson, M. Chatelut, C. Guizard, A. Larbot, and L. Cot, J. Non-Cryst. Solids 121, 72 (1990).
14. Y.J. Kim and L.F. Francis, J. Mater. Sci. 133, 4423 (1998). 15. M.I. Mendelson, J. Am. Ceram. Soc. 52, 443 (1969). 16. X.Z. Ding and X.H. Liu, J. Mater. Res. 13, 2556 (1998). 17. J.D. DeLoach, G. Scarel, and C.R. Aita, J. Appl. Phys. 85, 2377
(1999).
18. F. Babonneau, A. Leaustic, and J. Livage in Better Ceramics
Through Chemistry III, edited by C.J. Brinker, D.E. Clark, and
D.R. Ulrich (Mater. Res Soc. Symp. Proc. 121, Pittsburgh, PA, 1988), p. 310.
19. K. Nakamoto, Infrared and Raman spectra of Inorganic and
Coordination Compounds, 3rd ed. (Wiley, New York, 1978).
20. J. Catterick and P. Thornton, in Advanced Inorganic Chemistry
and Radio Chemistry, edited by H.J. Emeleus and A.G. Sharpe
(Academic Press, New York, London, 1977), Vol. 20, p. 291. 21. K.H. Von Thiele and M. Panse, Z. Anorg. Allg. Chem. 441, 23
(1978).
22. S. Doeuff, M. Henry, C. Sanchez, and J. Livage, J. Non-Cryst. Solids 89, 206 (1987).
23. D.C. Eradley, R.C. Mehrotra, and D.P. Gaur, Metal Alkoxide (Academic Press, New York, 1978), p. 118.
24. M.L. Calzada and L.D. Olmo, J. Non-Cryst. Solids 121, 416 (1990).
25. S.B. Amor, G. Baud, J.P. Besse, and M. Jacquet, Mater. Sci. Eng. B47, 110 (1997).
26. R. Debnath and J. Chaudhuri, J. Mater. Res. 7, 3348 (1992). 27. J.A. Gamboa and D.M. Pasquevich, J. Am. Ceram. Soc.75, 2934
(1992).
28. R.A. Spurr and H. Myers, Analytical Chemistry 29, 760 (1957). 29. J.H. Jean and S.C. Lin, J. Mater. Res. 14, 2922 (1999). 30. R.D. Shannon and J.A. Pask, Am. Mineralogist 49, 1707 (1964). 31. K.P. Kumar, K. Keizer, and A.J. Burggraaf, J. Mater. Chem. 3,
917 (1993).
32. A.A. Gribb and J.F. Banfield, Am. Mineralogist 82, 717 (1997). 33. M. Barsoum, Fundamentals of Ceramics (McGraw-Hill, New
York, 1997), p. 364.
34. K.P. Kumar, K. Keizer, A.J. Burggraaf, T. Okubo, H. Nagamoto, and S. Morooka, Nature (London) 358, 48 (1992).
35. T. Tagami and S.I. Tanaka, Acta Mater. 45, 3341 (1997). 36. T. Tagami and S.I. Tanaka, J. Mater. Sci. 34, 355 (1999). 37. J. Yang and J.M.F. Ferreira, Mater. Res. Bull. 33, 389 (1998). 38. J.W. Christian, The Theory of Transformations in Metals and