科技部補助專題研究計畫成果報告
期末報告
私募基金與高收益債券長期績效(第2年)
計 畫 類 別 : 個別型計畫 計 畫 編 號 : MOST 102-2410-H-004-026-MY2 執 行 期 間 : 103年08月01日至104年10月31日 執 行 單 位 : 國立政治大學財務管理學系 計 畫 主 持 人 : 湛可南 計畫參與人員: 博士班研究生-兼任助理人員:楊曉琳 報 告 附 件 : 移地研究心得報告 處 理 方 式 : 1.公開資訊:本計畫可公開查詢 2.「本研究」是否已有嚴重損及公共利益之發現:否 3.「本報告」是否建議提供政府單位施政參考:否中 華 民 國 105 年 01 月 25 日
中 文 摘 要 : 公司收高益債券是私募基金進行融資購併交易時主要的資金來源。 本研究使用Bessembinder et al. (2009)提出的方法檢測公司債券 的超額報酬,發現私募基金債券之績效普遍不佳,此現象尤以信用 評等Ba以下以及於熱市發行之私募基金債券為最。本研究也發現私 募基金成立愈久,其債券績效愈差。投資銀行相關之私募基金債券 績效也顯著劣於一般私募基金債券。本研究為機構投資人與私募基 金管理者提供了債市的新觀點。 中 文 關 鍵 詞 : 債券、績效、私募基金、融資購併、信用評等
英 文 摘 要 : The bond market provides an important source of financing for Private Equity (PE) sponsored transactions. Using the methodology suggested by Bessembinder et al. (2009), we find that PE-sponsored bonds underperform comparable benchmarks. This is especially true for bonds with credit ratings below Ba or bonds issued in hot bond markets. Furthermore, bonds sponsored by more experienced PE groups underperform bonds associated with less experienced PE groups, while bonds backed by investment bank-affiliated PE groups underperform bonds sponsored by other PE groups. These findings provide new insights for institutional investors and policy makers about PE’s role in the bond market.
英 文 關 鍵 詞 : Bonds, Performance, Private Equity, Leveraged buyouts, Credit Rating
The performance of bonds sponsored by private equity firms
Jerry Cao
Lee Kong Chian School of Business Singapore Management University
[email protected] +65-6828-0273
Konan Chan
Department of Finance National Chengchi University
[email protected] +886-2-29393091 ext. 81239
Kathleen M. Kahle
Eller College of Management University of Arizona [email protected]
(520) 621-7489
October 2015
* We thank Shrikant Jategaonkar, Inmoo Lee, and seminar participants at the National Taiwan University and University of Hong Kong for helpful comments, and Jodie Hu, Yu-Ching Li and Pei-Shan Tung for research assistance. Chan acknowledges the financial support from the Ministry of Science and Technology, Taiwan (NSC 102-2410-H-004-026-MY2). Jerry Cao acknowledges a SMU internal grant for supporting this research.
The performance of bonds sponsored by private equity firms
Abstract
The bond market provides an important source of financing for Private Equity (PE) sponsored transactions. Using the methodology suggested by Bessembinder et al. (2009), we find that PE-sponsored bonds underperform comparable benchmarks. This is especially true for bonds with credit ratings below Ba or bonds issued in hot bond markets. Furthermore, bonds sponsored by more experienced PE groups underperform bonds associated with less experienced PE groups, while bonds backed by investment bank-affiliated PE groups underperform bonds sponsored by other PE groups. These findings provide new insights for institutional investors and policy makers about PE’s role in the bond market.
Keyword: Bonds, Performance, Private Equity, Leveraged buyouts, Credit Rating
1. Introduction
The credit boom and easy access to cheap debt fueled a record $1.4 trillion in leveraged buyouts (LBOs) in 2006 and 2007, followed by huge losses on subprime mortgages in the financial crisis that led to a flight to safety by money managers. The center of the concerns is the high pricing at issuance. For example, a Bloomberg article by Sridhar Natarajan on March 15, 2013 quotes a statement by a fund manager “Most bonds are trading at a pretty high premium and could face significant price erosion.” The article further raises a warning sign by stating the following: “Investors holding almost $1 trillion of the lowest-rated U.S. investment-grade corporate bonds are at a greater risk of losses as the pace of buyouts surges to the fastest pace in six years because the debt offers few protections.” Despite the economic significance of the high-yield bond market for private equity sponsored transactions, little research has systematically examined the post-issue performance of bonds to finance LBOs.
One exception is a clinical study by Dammon et al. (1993) that documents a pattern of large and persistent mispricing in the three high-yield bonds of RJR Nabisco after it was acquired by KKR during the peak of the junk bond market in the late 1980s. Our research is thus the first study to systematically examine the long-run returns of bonds issued by PE-sponsored companies. The post-issue performance of these high-yield bonds is of high relevance since many are issued at the market peak and they are often held by institutional investors such as pension funds, partially due to the lack of active secondary markets and partially due to the high risk.
Several studies (e.g., Harford and Kolasinki, 2014; Hotchkiss et al., 2014; Huang et al., 2015) raise a debate that PE sponsors may benefit themselves by expropriating other stakeholders such as debt investors via wealth transfer events such as special dividend payout, financial distress and cheap debt.1 Different from the extant literature, our research directly addresses this important question by studying performance of PEG-backed bonds. The earlier literature provides some evidence that LBO transactions acted as bad news for debt investors. For example, Kaplan and Stein (1990) suggest that debtholders were not adequately compensated for the risk they bore in leveraged
1 Guo et al. (2011) find that risk-adjusted return on total capital is high but they do not study bond return issued by PE-sponsored companies.
recapitalizations of 31 public companies in the 1980s. Asquith and Wizman (1990) find that pre-buyout bond investors suffer losses when their bonds have no covenants. Warga and Welch (1993) find that incumbent bondholders of target firms suffer significant losses when LBOs are announced. Recently Huang et al. (2015) find that PE-backed IPO firms have lower yield spreads on bonds issued after they go public. None of these papers systematically examine bond performance related to PEG-backed deals.
The lack of systematic studies on PEG-backed bonds is mainly due to data constraints and the difficulty of assessing bond returns. Unlike stock data, bond information is hard to find since many issuers are privately-held after being delisted through LBO transactions. We solve this data problem using two procedures: First, we collect data from Capital IQ on PEG-sponsored bond issuances and second, we merge it with bond pricing data from Lehman Brothers Bond Database (LBBD). We also try to enlarge our sample by including TRACE data but do not succeed because of the difference between LBBD and TRACE. To assess bond performance, our research follows the recommendations in Bessembinder et al. (2009) to calculate bonds’ abnormal returns.2 Our research is therefore the first to provide a comprehensive analysis of post-LBO bond (abnormal) performance for U.S. companies backed by Private Equity Groups. Compared to the sample period from 1993-2001 in Harford and Kolasinski (2014), our sample period is from 1991-2006. The financial crisis period is excluded in our sample. The 2006 cut-off year is chosen because the sample requires 3 or 5 years post-issuance bond return data.
We examine several hypotheses regarding the performance of the PEG-sponsored bonds. It is an empirical question whether private equity sponsors bring value to high-yield investors or they raise bond capital cheaply. Hotchkiss et al. (2014) find that PE-sponsored companies are no more likely to default than other high-yield issuers and conditional on default they conduct faster and cheaper debt restructurings. Our research thus compliments their study by examining post-issue performance of high-yield bonds issued by PE-sponsored companies. As most LBO-related bonds have junk bond credit
2 Bessembinder et al. (2009) provide a caveat that the possibility of detecting a moderate price shock for a
noninvestment grade company is extremely low unless the sample size approaches to 500 companies. This small sample issue works against our findings. Our result thus provides the lowest-bound evidence on the underperformance of PEG-sponsored bonds.
rating and they cannot easily be traded, what really matters to institutional investors who hold them is their long-run performance. Following Dammon et al.’s (1993) anecdotal study of bonds in RJR Nabisco, our research is the only work that systematically examines the post-issuance performance of bonds sponsored by PEGs.
We hypothesize that private equity groups are able to raise funds especially highly-risky bonds with low cost of debt capital. Empirically we test this hypothesis by examining whether PE-sponsored bond underperform other bonds with similar risk profile in general and also whether PE-sponsored bond underperformance is more apparent in bonds with lower credit ratings. Our second hypothesis is the market timing hypothesis, which states that PEGs are more likely to issue bonds when the market is hot and thus overpay for the bonds. Our third hypothesis is the PEG reputation hypothesis, which states that more reputable PEGs issue better-performing bonds. Finally, we posit that bonds sponsored by investment bank-affiliated PEGs underperform than other bonds since they can raise even cheaper bond capital.
We find that PEG-sponsored bonds on average have negative abnormal returns: they underperform comparable benchmarks following issuance, especially in the first post-issue year.3 We thus provide solid evidence that high-yield bonds sponsored by PEGs are associated with overpricing. The findings suggest that PE can raise bonds with a cheaper financing cost. This evidence is consistent with the concerns that bond investors are concerned with great risk of losses related to buyout bonds.4 Such empirical evidence of mispricing is also consistent with general theories that the market does not eliminate mispricing due to limits of arbitrage (Shleifer and Vishny, 1997) or investor’s sentiment in high-yield bond markets (Nayak, 2010).
Consistent with the first hypothesis, we further find that bonds with ratings below Ba perform worse in the post-issuance period compared to bonds with a Ba rating. Our evidence suggests that the enduring power of private equity in LBOs is their ability to issue highly risky bonds with low returns for bondholders. This is consistent with Kaplan and Stein (1993) in the sense junk bonds investors misprice their debt by focusing too
3 In Table 2, the risk-adjusted mean returns show consistent underperformance while median returns do not.
This is probably due to the fat tail distribution of the bond returns. In the multivariate analysis, the underperformance result is robust.
4 A recent article by Bloomberg on Mar 15, 2013 is titled “LBOs imperil $900 billion of US company
much on stated yields and past buyout successes, and pay too little attention to subtle capital structure details of the deals. Our new evidence confirms that most of the bad performance of buyout-related bonds is caused by those with lower credit ratings.
We find evidence to support our market timing hypothesis. PE-sponsored bonds issued during hot market periods perform worse than bonds issued during cold market periods. In this analysis, we sort each calendar month in our sample period into Cold or Hot bond markets based on the number of bond issues in our sample. Months with above median numbers are classified as hot markets, while those with below median are classified as cold markets. The results suggest that PE sponsors are good at exploiting windows of opportunity and sell bonds when there is a larger demand in the bond market. Bonds issued in these hot bond market periods then subsequently underperform.
We do not find evidence to support the PEG reputation hypothesis. Bonds sponsored by more reputable PE firms actually underperform those sponsored by less experienced PE firms. This is consistent with Demiroglu and James (2010), who find that borrowing costs are lower for buyouts sponsored by high reputation PE groups. Our results suggest that larger and older PEGs take advantage of institutional investors to raise cheaper bonds to finance LBOs especially when debt market is favorable, consistent with Axelson et al. (2013)’s conclusion that PEGs are able to borrow cheap.
Finally, our evidence is consistent with Ivashina and Kovner’s (2011) finding that bank relationships formed through repeated interactions reduce inefficiencies from information asymmetry and allow private equity groups to receive favorable loan terms in financing LBOs. In addition, we divide PE sponsors according to their affiliation following Fang et al. (2013) and we find that bonds sponsored by investment-bank affiliated PEGs or independent PEGs under-perform bonds sponsored by commercial bank-affiliated PEGs.
The rest of the paper is organized as follows. Section 2 introduces the background of private equity activity, LBOs, and bond market related to LBOs. Section 3 describes our data selection and defines the variables used. Section 4 discusses the empirical findings, and Section 5 concludes the paper.
Private Equity Groups (PEGs) such as KKR depend heavily on junk bond issuance to finance LBOs through “bootstrap debt financing.” In bootstrap debt financing, PEGs first set up a new acquisition subsidiary to issue bonds or other debt instruments backed by the targets’ assets and future cash flows, and then finance an acquisition of the target firms through a takeover. To complete LBO transactions, PEGs merge the targets with the indebted acquisition conduits so that the target companies become portfolio firms.
Private equity or LBO firms typically seek out equity investors such as pension funds or university endowments to fund approximately 30 percent of the cost of leveraged buyouts (LBOs), according to the Global Private Equity Report 2011 by Bain & Company. Typically, these funds raise equity from investors at the time the fund is formed. Additional, deal-level capital is raised in the form of high-yield debt and syndicates loans at the time of a specific transaction such as a leveraged buyout; these loans are in the target company's name. This debt almost always includes a portion that is senior and secured such as bank debt, and often includes a junior unsecured portion, such as high-yield bonds or “mezzanine debt” (see Kaplan and Stromberg (2009) for a more detailed view of the private equity market). Institutional investors are typically the major investors in these risky (junk) bonds or leveraged loans backed by Private Equity. These LBO-related or private equity backed bonds are often traded at a large discount5 of 20-40%, hence attracting many yield-oriented hedge funds and institutional investors.
The LBO market in the U.S followed several waves. KKR’s $25 billion hostile takeover of RJR Nabisco in 1987 marked the peak of the first LBO boom. After the collapse of Drexel Burnham Lambert and the crash of the junk bond market, leveraged buyouts almost disappeared after 1988. Andrade and Kaplan (1998) report that approximately 29% of 136 MBOs and leveraged recaps done in 1980s later failed. Although buyout activity was very low in the early 1990’s, it recovered in the later part of the 1990’s and reached record volume during the credit boom in 2006-2007, only to come to an abrupt end with the credit crisis in late 2007. While the earlier U.S. buyout industry was composed of a relatively small number of organizations, the LBO market
5 For example, according to Trace, the bond-price reporting system of the Financial Industry Regulatory
Authority, First Data’s $2.4 billion of 11.25 percent notes due in 2016 fell 18.25 cents to 66 cents on the dollar on May 21, 2010.
underwent tremendous growth in both size and number of transactions in the 2000s. Large LBO funds and large deals started to emerge. Some of the largest transactions include purchases such as: Harrah’s Entertainment ($27.4 billion) by Apollo and Texas Pacific; Freescale SemiConductor ($17.6 billion) by Blackstone, Carlyle, Permira, and Texas Pacific; and Hertz ($15 billion) by Carlyle, Clayton Dubilier & Rice, and Merrill Lynch. First Data Corp. is reported to issue up to $8 billion of junk bonds as part of $24 billion in debt financing for its leveraged buyout by Kohlberg Kravis Roberts & Co. According to the Private Equity Council6, in 2007 alone private equity groups raised more than $516 billion in capital for LBO funds and completed 2,238 acquisitions and/or investments for a record $721 billion.
Credit Suisse in its 2006 Global Trend Report states that:
[D]ebt-financed corporate takeovers bring with them considerable risks, not least for owners of "old" bonds. An LBO is a problem for an existing or "old" bond because it involves a higher level of debt for the company taken over, and thus typically leads to falls in bond prices. Unless, that is, such takeovers come with a degree of protection offered by legally binding bond clauses or so-called "bond covenants". Moreover, these bonds are typically transferred to a holding company. By contrast, the newly issued securities aimed at financing the acquisition are placed at the level of the operationally active company. As a result, existing bonds find themselves structurally disadvantaged (subordinated). This in turn causes the credit rating to fall, perhaps even as far as the speculative rating category, where the price of affected bonds falls significantly.
Aside from the anecdotal evidence supplied by Dammon et al. (1993) on the mispricing of RJR Nabisco bonds after the KKR acquisition, little is known about the performance of PEG-sponsored bonds issued at or after LBOs. Recent studies such as Shivdasani and Wang (2011) suggest that LBO markets overheated due to the rapid growth of securitization of loans. In contrast, buyout-related junk bond market attracts little academic attention, despite the fact that high-yield bonds related to PEG-sponsored LBOs have great volume and are important to institutional investors such as insurance firms, pension funds or hedge funds.
3. Methodology
3.1 Firms with multiple bonds
Bessembinder et al (2009) note that in their sample, the majority of firms have a single bond outstanding. They advocate the firm-level approach to examine bond returns by treating each firm as a portfolio of bonds issued. This mitigates the primary concern with the bond-level approach, namely that results may be driven by a handful of firms with multiple bonds. However, PEGs manage a portfolio of firms with each firm issuing their own bonds. In general the level of debt in these firms is substantially higher than in other leveraged transactions. At the PE sponsor level, the average PE firm in our sample sponsors 8.7 public bonds in 3.3 different target companies. The average (median) LBO firm in our sample has 2.65 (2) public bonds outstanding. Since we examine sub-samples based on bond characteristics and since bonds can be issued at different points in time even for the same target firm, using the firm-level approach seems less appropriate. Consequently, we rely on the bond-level approach in our main analysis but also do robustness checks on our results at the firm level.
To evaluate bond performance at the firm level, we follow Bessembinder et al. (2009) and treat each target firm as a value-weighted portfolio. We employ both event time and calendar time approaches to compute the value-weighted average returns. In the event-time approach, as shown in equation (1), we first compute the average monthly return over the holding horizon H (H = 12, 24, or 36 months) for each bond from the event month 1 and then calculate the weighted average return across bonds within a firm, where the weight is inflation-adjusted market value of bond at the end of event month 0 or at the first available month-end, whichever is later. This approach is designed to put bonds in the event-time framework, a method similar to buy-and-hold returns in stocks. In the calendar-time approach, for each calendar month, we compute the firm-level bond returns using all bonds issued by the same firm with available returns in that month, where the weight is the market value of bonds in the prior month. For bonds eventual ending with default, we will include them until their return is not available. We then average the monthly firm-level returns over the sample period, as in equation (2), as long as there are bonds still within the holding horizon (12-, 24-, 36-months). This approach implicitly assumes a trading strategy based on bonds issued by the firm. As we employ a
value-weighting scheme, the investment strategy here is less subject to the concern of large transaction costs involved in returns.
N i it H t i H BR w FR 1 1 (1)
T t N i witBRit T FR 1 1 1 (2) where FR is the firm-level return and BR is the bond-level return.3.2 Measuring abnormal bond performance
We mainly follow the literature, especially Bessembinder, Kahle, Maxwell, and Xu (2009), to measure abnormal bond returns. Three approaches employed in our paper are the mean-adjusted model, the risk-adjusted model (or matching portfolio model), and the factor model.
The most popular approach in the literature to estimate abnormal bond returns is the mean-adjusted model. The abnormal return (AR) is the difference between the bond excess return (ER) and the expected excess return (EER). The bond excess return is the bond total return (BR) minus the return on a matched Treasury security (TR), and the expected excess return is the average of the historical excess returns. That is,
ARt = ERt – EERt (3)
where ERt = BRt – TRt, and EER
k ER
ky t y
t
1 We follow Bessembinder et al. (2009) and use a six-month window to estimate the expected excess return. We require at least three non-missing monthly returns during this six-month window.
The second approach we use to measure abnormal bond returns is the risk-adjusted model. This method aims to control for the major risk components of bonds with matching portfolios. We form matching portfolios on the dimensions of credit rating and time-to-maturity in order to control for default risk and maturity risk. We take all non-investment grade bonds with available data from the bond database and classify them into four rating categories (Ba, B, Caa, Ca) and three maturity groups, totaling 12 portfolios. The maturity cutoffs for ratings Ba and B are 0 to 6 years, +6 to 9 years, and +9 years.
For ratings below B, the maturity cutoffs are 0 to 5 years, + 5 to 8 years, and +8 years. We choose these cutoffs to generate portfolios with roughly equal numbers of bonds. In forming the benchmark for the risk-adjusted model, we apply both the equal- and value-weighted schemes to compute portfolio returns, since bond size might affect liquidity risk. The abnormal return is the sample bond return minus the return of the matching portfolio in the same month.
For the factor model, we rely on the four-factor model developed by Elton et al. (1995) and revised by Bessembinder et al. (2009) as follows:
t t t t bond t f t m t f t b R R R R DRP Term e R , , 1( , , )2 , 3 4 (4)
where Rb is the bond portfolio return, Rm is the CRSP value-weighted stock index return,
Rbond is the Lehman corporate bond index return, DRP is the default risk premium, and
Term is the term premium. We form calendar time bond portfolios by including sample
bonds that were issued in the past 1, 2, or 3 years, and then regress the time-series regressions as in equation (4). The abnormal return is measured by the regression intercept. To prevent smaller bond issues from dominating the regression estimations, we examine both equal-weighted and value-weighted bond portfolio returns. Moreover, since our sample bonds are not evenly distributed in time, the typical ordinary least square (OLS) regressions may assign inappropriately heavy weights to calendar months with few bond issues. This will generate a low power test (Loughran and Ritter, 2000). To correct this potential bias, we also report results based on weighted least square (WLS) regressions, where the weight is the number of bonds in the portfolio in a given month.
Among the three models we use to gauge abnormal bond returns, the risk-adjusted model with value-weighting (VW) scheme exhibits the best statistical features (Bessembinder et al. (2009)). In particular, the risk-adjusted model with the VW benchmark generates well-specified test statistics and higher power to detect abnormal returns compared to other models. While the mean-adjusted model is popular in the literature, it tends to over-reject in the lower tail of the distribution. The factor model tends to be well-specified, but has much lower power to detect abnormal returns.
The mean-adjusted model requires at least three non-missing monthly returns during the prior six-month window to estimate abnormal returns. However, the risk-adjusted model and the factor model do not rely on prior returns. As such, there exists an
inconsistency in the investment horizon between the mean-adjusted model and other two methods. Consequently, to ensure these three methods capture the abnormal performance over the same period, we define the one-year return as the return from month 4 to month 15 after bond issuance (i.e. the event month 1 in our return calculations is the fourth month after issuance), and the two-year and three-year returns as the returns over the post-issue month 4 to month 27 and month 4 to month 39, respectively.7 To enlarge our sample size, we do not impose the prior three month return requirement on the sample bonds, except for the mean-adjusted model. However, our results for the risk-adjusted model and the factor model are very similar when the prior three month return requirement is imposed.
4. Data
4.1 Bond return data
Our bond data are obtained from the Lehman Brothers Bond Database (LBBD).8 LBBD offers month-end information on price, yield to maturity, credit rating, and returns for a comprehensive set of publicly traded corporate bonds. Bessembinder et al. (2009) show that LBBD contains very similar information compared with TRACE month-end transaction data. Elton et al. (2001) also find that bond pricing in LBBD is comparable to CRSP in accuracy.
We require that each corporate bond have available information on bond rating, issue size, issue date, maturity date, and coupon rate over the period of 1991 to 2006.9 We drop zero-coupon bonds as well as puttable bonds due to the unique feature of
7 Our event window starts with the fourth month after issuance due to the requirement of at least three
non-missing monthly returns to compute the expected excess return in the mean-adjusted model (see equation (3)). For example, for the post-issue month 4, the expected excess return is the average of excess returns over post-issue months 1 to 3. For the post-issue month 5, the expected excess return is the average of excess returns over post-issue months 1 to 4. For the post-issue month 6, it’s the average of excess returns over post-issue months 1 to 6. For the post-issue month 7 and onwards, the expected excess return is the average of excess returns in the prior 6 months.
8 See Bessembinder, Kahle, Maxwell, and Xu (2009) for a comprehensive list of research in using LBBD.
Although daily TRACE data has become increasingly popular, TRACE is unavailable for most of our sample period.
9 Our return data stop in 2006 as this is the most recent data we can get from LBBD. However, LBO
activity also declined significantly after 2006 due to the effects of the financial crisis and the drastic increase in spreads on high-yield bonds. For example, PE related deal flow fell from 24% of M&A activity during the peak of the PE boom in 2006 to 3% in 2009 (“Private Equity feeds on bite sized deals,” Megan Davies and Simon Meads, Reuters, June 23, 2011).
convertibility10. Following Elton et al. (2001) and Bessembinder et al. (2009), we eliminate monthly observations with large return reversals where a 20% or higher return is followed by a 20% or larger return of the opposite sign. We further drop bond-months without bond market values and bond-months with zero total returns.
4.2 The sample
Our sample of bond issuances is obtained from Capital IQ, a Standard & Poor’s subsidiary for financial data. Capital IQ provides comprehensive bond issuance information from U.S. companies that have financial sponsors after 1990. We define a bond issue as a PEG-sponsored bond based on the Capital IQ deal synopsis, which classifies deals according to the type of leading equity investor. We only keep those bonds issued in 2006 or earlier by firms that are sponsored by private equity groups, including LBOs, leveraged recapitalizations, and reverse LBOs that are backed by private equity. We keep only bond issuances with deal values greater than 5 million U.S. dollars to avoid the potential outlier effect due to small bond deals. Our sample is fairly consistent with other studies examining LBOs in terms of firm number or firm size (Axelson et al. (2013)). We match the monthly bond return data from LBBD with this sample of bond issues backed by private equity from Capital IQ. To ensure our sample bonds are not close to default, we eliminate bonds with credit ratings of C or below.11 We further drop bonds where the issuance date is prior to the LBO transaction date; thus unlike Warga and Welch (1993), we are not examining the impact of the LBO on target firms’ existing bondholders. This leaves us a final sample of 697 bonds issued by 312 firms. These 312 firms are sponsored by 96 different PE sponsors.
Table 1 reports the sample distribution and summary statistics. Consistent with the buyout market boom after 2000, our sample bond issuance clusters in the early 2000s, with 49% of our full sample issuance occurring in 2002-2004.12 Approximately 75% of
10 When they are included, our findings remain similar.
11 Our results are very similar with the inclusion of C-rated bonds.
12 Although the aggregate capital invested in LBOs peaks in 2006-2007, the number of observations in our
sample declines in 2005 and 2006. There are two reasons for this. First, transactions completed in 2005 and 2006 will not be in our sample if there are no LBBD pricing data until after 2006. Second, as shown in Table 2 of Demiroglu and James (2009) and discussed in Shivdasani and Wang (2011), a substantial portion of financing during the LBO boom came from CLOs rather than corporate bonds. We find a similar decline in the number of bonds issued in 2005-2006 in the high-yield bond universe from LBBD.
the sample bonds are rated B at issuance. PEG age, defined as the difference between the PEG founding year and the bond issuance year, varies across bond issues. Most of bonds in our sample are sponsored by PE groups with an age ranging from 6 to 25 years. There are very few bond issues by very young or old PEs. The average bond issue size is about 285 million, with average 8.3 years to maturity and a 9.4% annual coupon rate.
5. Empirical Results
5.1 Long-run bond returns to PEG-sponsored bonds
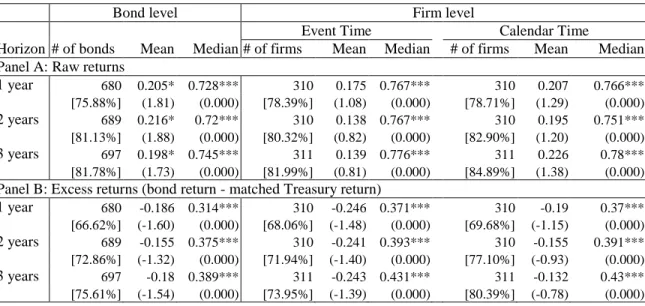
In Table 2, we report the long-run returns of bonds sponsored by private equity groups. We analyze the long-run bond returns by examining cross-sectional bond-level returns, firm-level event-time returns, and firm-level calendar-time returns. Panel A reports the summary statistics for raw returns, Panel B the excess returns, Panel C the mean-adjusted returns, Panel D the returns adjusted by the equal-weighted portfolio matched on maturity and credit rating matching, and Panel E the returns adjusted by the value-weighted portfolio matched on maturity and credit rating matching. We report one year, two year, and three year post-issuance returns.
Across all bonds, PEG-sponsored bonds have a mean (median) monthly return of 0.20% (0.75%) in the three years post issuance. When we aggregate bonds at the firm level in event time (calendar time), PEG-sponsored bonds have a similar average return of 0.14% (0.23%) and a similar median return of 0.78% (0.78%). When PEG-sponsored bond returns are adjusted by the treasury rate in Panel B, mean excess returns are negative but insignificant while median returns are positive and significantly greater than zero. However, when PEG-sponsored bond returns are adjusted by mean historical excess returns (Panel C), their abnormal returns are negative and significant at the bond level. For example, the average (median) monthly mean-adjusted three-year return is -0.25% (-0.02%), which is significant at the 1% (10%) level. At the firm level, the mean returns are negative and significant, while the medians are generally insignificant. Since many bonds have different credit ratings or maturities, examining mean-adjusted returns may not fully control for the risks in these bonds. We therefore match PEG-sponsored bonds with the corresponding credit rating and maturity matched portfolios in Panels D and E, following the procedure in Bessembinder et al. (2009). Panel D reports abnormal returns
based on an equal-weighted benchmark while Panel E uses a value-weighted benchmark. The mean abnormal bond returns are consistently negative and significant regardless of whether they are calculated at the bond level or at the target firm level. The median returns are significantly negative in the first year at the bond level, but generally small in magnitude and not significant over longer horizons and at the firm level.
The cross-sectional analysis above shows that on average, PEG-sponsored bonds have significantly negative mean returns. The medians tend to be slightly negative and significant at the bond level, but insignificant at the firm level. PEG-sponsored bonds underperform bonds with similar credit rating & maturity profiles. As the mean returns may be sensitive to outliers, in Panel F we report the results by first winsorizing the monthly returns at the top and bottom 1% levels before summarizing these monthly returns. We find that mean returns are still negative and significant over the different horizons. These results suggest that the underperformance of PEG-sponsored bonds is not driven simply by a few outliers.
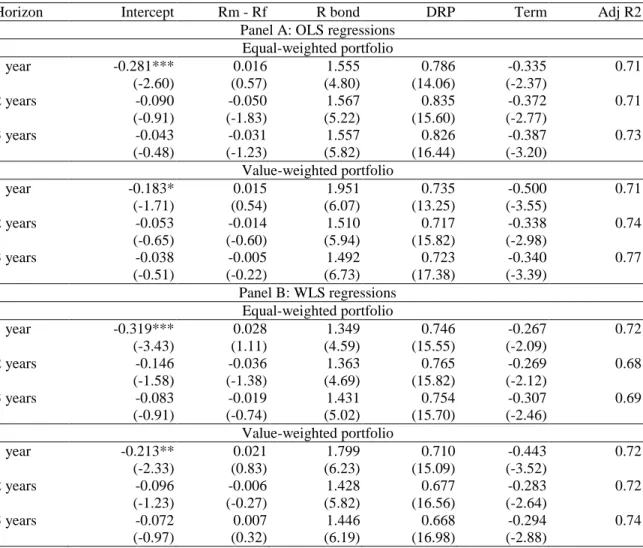
Table 3 presents the calendar-time portfolio regression analysis by forming calendar-time portfolios for the one year, two years and three years post issuance. The factor-adjusted analysis in the OLS regressions indicates that PEG-sponsored bonds underperform in the first year after issuance; the performance in the post-issue two and three years is negative but not significant. As the OLS regressions assign equal weights to both heavy and light issuance months and thus under-estimate the abnormal performance of bonds, we also show the results based on WLS regressions in which the weight is proportional to the number of bonds in a given month. The alphas, or intercepts of the regressions, are all negative and larger in magnitude than those in OLS regressions. The first year underperformance is statistically significant and robust across different weighting schemes and regression methods. Overall our results show that PEG-sponsored bonds exhibit poor long-run performance, suggesting no value creation for bond investors to finance PEG-sponsored transactions.
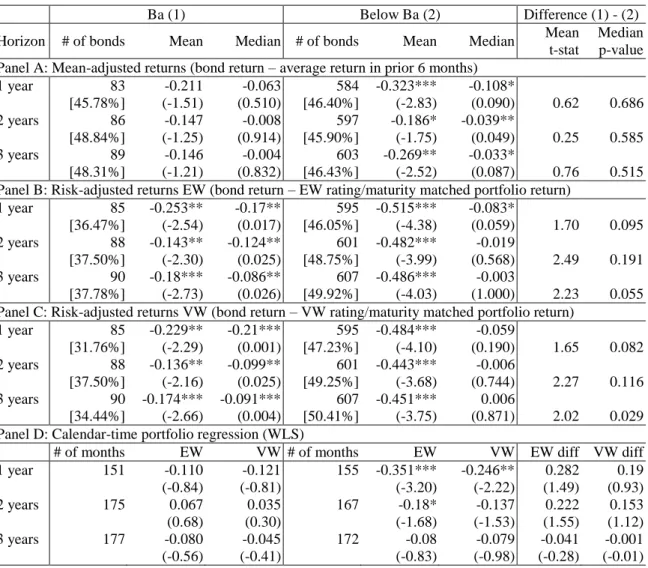
5.2 Univariate Results by bond, PEG, and credit market characteristics 5.2.a Bond Ratings
The prior analysis treats all bonds as homogenous, while in reality the performance of bonds may differ across bonds with different characteristics. For example, bonds with low credit ratings may behave very differently from those with high credit ratings. Therefore we divide the whole bond sample into two subsamples, bonds with ratings of Ba and bonds with ratings below Ba, since most PEG-sponsored bonds have ratings below Ba.
Panel A of Table 4 examines the mean-adjusted returns. The mean and median of the mean-adjusted returns for Ba bonds are negative but not significant. In contrast, bonds with below Ba ratings display significantly negative performance across all three post-issue periods; the medians are significantly negative in the one, two, and three years post issuance. The differences between the Ba and below Ba returns are not significant however.
Panels B and C show the risk-adjusted EW and VW returns, respectively. Both the EW and VW mean returns are negative and significant for both Ba and below Ba bonds, although the magnitude of the underperformance is more than twice large for the below Ba bonds. The differences in the mean abnormal returns between the Ba and below Ba groups are significant in the one, two and three post-issue years. Interestingly, the median returns are insignificantly negative for below Ba bonds, suggesting that a few of below Ba bonds severely underperform.
In the calendar-time portfolio analysis reported in Panel D, bonds with ratings of Ba that are sponsored by PE groups have insignificant alphas, while those with below Ba ratings have negative and significant alphas over the one and two years horizons.
In untabulated results, we examine alternative measures of credit risk, such as the spread between BAA and AAA bond returns, the spread between high yield bonds and the one month LIBOR rate, and the credit tightening variable (measured as the net percentage of domestic banks reporting a tightening of standards for commercial & industrial loans in the quarter prior to the bond issue). Bonds issued in the Low (High) credit spreads are assumed to have less (more) risk. We find that bonds issued when credit spreads or the credit tightening variable are high exhibit significantly negative performance. The median performance of bonds issued when credit spreads are high is
significantly more negative than the median performance of bonds issued when spreads are low. This is consistent with riskier bonds earning lower returns.13
5.2.b PEG reputation
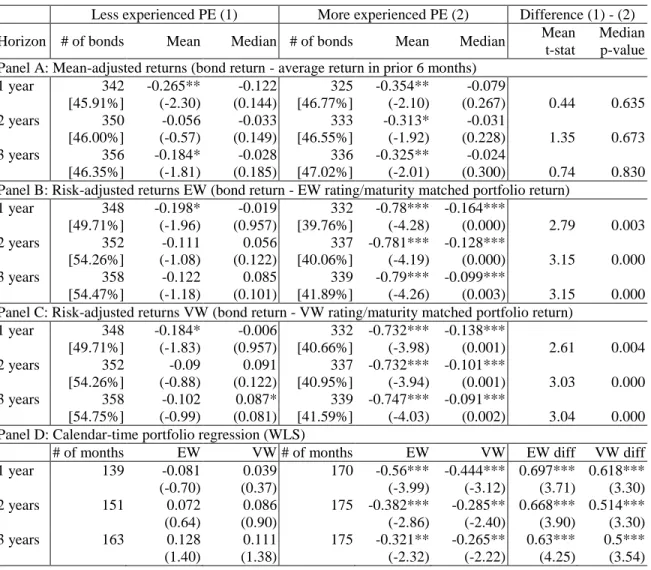
Our PEG reputation hypothesis suggests that reputation is an important factor in determining performance or raising funds. Following Cao and Lerner (2009), we use PEG age to proxy for experience. We divide the sample of PEG-sponsored bonds into two subsamples, those with more experienced PE sponsors and those with less experienced sponsors, based on a cutoff of 15 years. The results are reported in Table 5.14
Overall, bonds sponsored by more experienced PE groups exhibit significantly lower risk-adjusted returns than those backed by less experienced PE groups, which is inconsistent with our reputation hypothesis.15 Both the means and medians of risk-adjusted abnormal returns, using either the equal- or value-weighted benchmark returns, are significantly lower for the more experienced PE sponsors. This underperformance of bonds backed by more experienced PEGs persists for one, two, and three post-issuance years. For example, the mean (median) abnormal returns of bonds issued by more experienced PE firms are -0.75% (-0.09%), while the mean (median) abnormal returns of bonds backed by less experienced PE groups are -0.10% (0.09%) for the three post-issuance years (see Panel C of Table 5). Similar results are obtained when we examine equal- and value-weighted calendar time portfolio regressions. This new and important result suggests that more experienced PE sponsors may have the advantage of raising cheaper bonds to finance their investment activities, which has important implications for capital market and policy makers.
13 The results on spreads are inconsistent with the argument in Axelson et al (2013) that firms tend to
borrow when the credit spread is low. To further examine this issue, we sort by both PEG age and by credit spread or tightening percentage. When using the BAA-AAA spread or tightening percentage, underperformance is driven by the older, more experienced PEG sponsors. This finding seems to suggest that when credit is easy, market timing does not matter. It is most relevant when credit is tight. Older PEGs seem to have an advantage in this.
14 As in Cao and Lerner (2009), we also examine total capital raised by the PEG prior to the LBO date as a
proxy for reputation, and find that firms with higher capital perform worse. The detailed results are reported in Appendix Table A1.
15 It is also seemingly inconsistent with Demiroglu and James (2009), who find that reputable PEs are more
active when credit spreads are low. However, Demiroglu and James also find that reputable PEs use less traditional bank debt but more overall debt. They suggest this is consistent with reputable PEs having less need for monitoring. It could also allow more experienced PEs to take advantage of bondholders to benefit stockholders.
5.2.c. Hot vs. cold bond markets
We next examine the market timing hypothesis. To do so, we sort each calendar month during our sample period into Cold or Hot bond markets based on the number of issuances of sample bonds.16 Months with above median numbers are classified as hot
markets, while those with below median are classified as cold markets. Bonds issued in a Cold (Hot) month are classified as the Cold (Hot) bond portfolio.
Table 6 shows that bonds issued during hot markets generate low returns.17 In each method examined (mean-adjusted, risk-adjusted EW, and risk-adjusted VW), abnormal returns for bonds in the Hot portfolio are consistently negative and statistically significant. On the contrary, bonds issued during cold bond market periods do not suffer significantly negative abnormal returns; median abnormal returns are even positive, albeit insignificant. The differences in the risk-adjusted VW returns are significant for both means and medians and for all horizons we examine. These results suggest that PE sponsors exploit windows of opportunity and sell bonds when there is a larger demand in the bond market. Bonds issued in these hot bond market periods then subsequently underperform. These results are consistent with the model presented in Axelson et al. (2009) that PE sponsors are able to raise cheaper debt in hot bond market.
5.2.d PEG affiliation
Fang et al. (2013) examine whether PEGs with a bank affiliation may have certain advantages over other PEGs in investment due to superior information; their findings suggest that there are certain downsides or risks for investors in combining banking and PEG investing. We therefore ask a natural question in the context of bonds sponsored by PEGs, that is, whether bank-affiliated PEGs have an advantage in raising bond financing. To do so, we use Table II of Fang et al. (2013), which provides a list of 14 PEGs that are
16 We also use prior bond market returns as an alternative way to classify Hot versus Cold bond markets.
We find that bonds issued in the Hot market periods have lower long-run bond returns. The results are presented in Appendix Table A2.
17 We also try calendar time regressions. The results for individual bond portfolios are similar. However,
we sort into hot and cold groups based upon the month the bond was issued and these months tend to cluster together (i.e., hot market period is followed by hot market period). As a result, there are very few months with both ‘hot’ and ‘cold’ bonds in the same month so we lose half the sample in this approach. The difference between hot and cold bonds is much less meaningful.
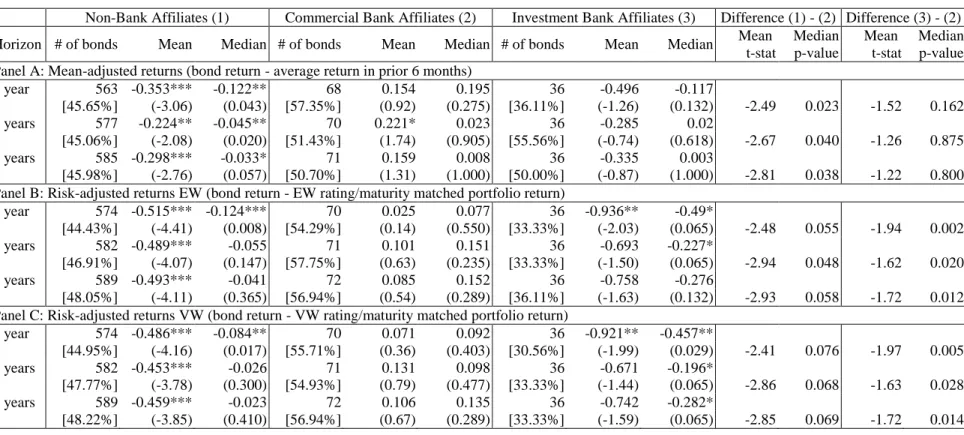
bank-affiliated and 6 PEGs that are investment bank-affiliated.18 We match those 20 bank-affiliated PEGs to our sample. When bonds have multiple sponsors, we define the bond as sponsored by a bank-affiliated PEG if their sponsors include one or more of those bank-affiliated PEGs; we divide bank-affiliated PEGs into the commercial and investment bank-affiliated groups. PEGs that are not bank-affiliated are classified as independent PEGs. We divide the sample of bonds into three sub-groups according to PEG affiliation, and report the performance in Table 7.19
We find that bonds sponsored by PEGs with commercial bank affiliation outperform bonds sponsored by independent PEGs. The difference in performance is robust to various measure benchmarks or estimation methods. Bonds sponsored by PEGs with investment bank affiliations significantly underperform bonds backed by PEGs with commercial bank affiliation. Among these three groups, the bonds sponsored by PEGs with investment bank affiliations have lowest performance. Since section 5.2.a finds that lower rated bonds perform worse, we compare bond ratings for the three bank-affiliation groups. Bonds sponsored by PEGs with commercial bank affiliations actually have slightly lower ratings than bonds sponsored by banks with investment-bank affiliations, so differences in bond ratings are not driving the results. This is consistent with Fang et al. (2013) that some risk has been under-estimated in bonds issued by investment bank-affiliated PEGs.
5.4 Regression analysis
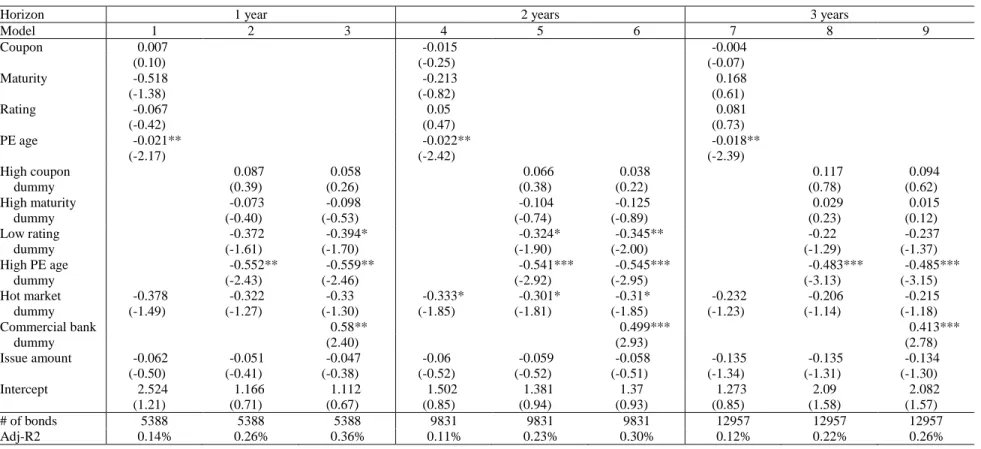
We also use cross sectional regressions to analyze the bond returns. We pool all monthly observations from 1992 to 2006 to run regressions, and adjust t-statistics for the double clustering effect based on Petersen (2009). The dependent variable is the monthly risk-adjusted bond return using the VW benchmark matched on credit ratings and time-to-maturity. The independent variables include issue size, coupon rate, maturity, credit rating, PEG age, a dummy equal to one if the bond market is hot, and bank affiliation. The results are reported in Table 8. We also use alternative proxies of bond market
18 Fang et al. (2013) define the following six PEs as investment bank-affiliated: Goldman Sachs Capital
Partners, Lehman Brothers Merchant Banking, Merrill Lynch Capital Partners, Morgan Stanley Private Equity, DLJ Merchant Banking, and Wasserstein & Co.
19 As the number of bonds sponsored by bank-affiliated PEGs, especially PEGs with investment bank
conditions (e.g., prior bond market returns) and PEG reputation (e.g., PEG capital), and similar but slightly weaker results are documented.
The regressions give negative and significant coefficients for both PE age and a dummy for above median PEG age. Specifically, when bonds are sponsored by more experienced PE groups, the monthly bond returns are 0.49% lower over the 36-month post-issue period (Model 9). The low rating dummy (a dummy variable equal to one if bonds are rated B or below) is negatively associated with bond returns, especially in returns within the post-issue one-year and two-year windows. The hot bond market return dummy is consistently negatively associated with bond returns and significantly so in the two-year horizon.
The regression results suggest that PEG-sponsored bond returns are decreasing in lower credit rating, PEG age, and hot bond market. More experienced PE sponsors are actually generating lower (abnormal) returns for institutional investors who are major players in investing in LBO related bonds. Our evidence also suggests that institutional investors who are typically attracted by the high yields should think twice before investing in PEG-sponsored bonds with very poor credit ratings issued during the market peak, especially if the PE firm is affiliated with an investment bank. In untabulated results, we also add high credit spread and high credit tightening dummies to the analysis. The coefficients are negative but insignificant in general.
5.5 Robustness tests
Kaplan and Stein (1993) suggest that the drop in the LBO activity during early 1990s was due to poor performance of the deals made during latter part of 1980s. Since Table 1 shows that our sample is concentrated in 2002-2004, in untabulated results we separately examine deals issued during this period to see if the performance of bonds issued in these years drives our results. When we do so, both the bonds issued during 2002-2004 and the bonds issued in other years exhibit significant underperformance. The mean underperformance of the bonds issued in 2002-2004 is slightly worse, but the differences are not significant. The median underperformance of the bonds issued in 2002-2004 is significantly lower than that of bonds issued in other years, however. Consequently, we rerun the regressions in Table 8 after including a dummy equal to one
for bonds issued in 2002-2004. The coefficient on the dummy is negative but insignificant, indicating that after controlling for other determinants of bond returns, bonds issued between 2002-2004 do not perform worse than other bonds.
6. Conclusions
Bond market financing for LBOs or private equity related transactions is important. Institutional investors are important buyers of the “LBO bonds” or PEG-sponsored bonds. Most of these bonds are risky and carry “junk” credit ratings of below BB since LBOs are highly leveraged. Institutional investors increase their investment in these low rated bonds in return for high potential yields. Prior research has not provided empirical evidence on whether these investments are worthwhile. This research therefore fills the void by systematically studying the post-issuance performance of bonds backed by private equity in the US.
Following the new empirical methods on evaluating bond performance suggested by Bessembinder et al. (2009), we find that PEG-sponsored bonds actually underperform comparable bonds, both statistically and economically. Such underperformance is robust to cross-sectional analysis and also to calendar-time portfolio analysis. Most of the underperformance comes from bonds with credit ratings below Ba, bonds sponsored by more experienced PE groups, bonds by investment bank-affiliated PEGs, and bonds issued in hot bond market periods. Multivariate regressions also confirm such patterns.
The empirical evidence from this research suggests that institutional investors may not be able to fully incorporate the risks associated with PEG-sponsored bonds, especially those junk bonds with lower credit ratings. Investments in these PEG-sponsored bonds deliver poor long-run performance on average. This underperformance can be attributed to the ability or experience of PE groups who are better able to time the bond market. Alternatively, institutional investors may invest in these bonds for relationship purposes and they are subsequently compensated by other business from PE groups. Private equity sponsors seem to raise “cheaper” bonds to finance their LBOs or post-LBO transactions, consistent with the view that private equity has enduring power of financing deals with cheap debt. Our research thus provides new insights on the
performance of LBO bonds that are important for policy makers and institutional investors.
Our findings also suggest that there exists large and persistent mispricing or overpricing in high-yield bonds sponsored by PEGs, and also indicates there may be wealth transfer from bond investors to private equity sponsors. However, given that firms sponsored by PEGs are not public, there is no price information to directly test the wealth transfer story, which we will leave for future research.
References
Aker, T., Tuttle, M., Juliano, B., 2006. Leveraged loans: capturing investor attention,"
Prudential Investment Management-Fixed Income, July.
Altman, E. 1989. Measuring corporate bond mortality and performance. Journal of
Finance 44, 909–922.
Altman, E. 2000. High yield bond market: a decade of assessment, comparing 1990 with 2000. NYU Stern Working Paper.
Andrade, G., Kaplan, S., 1998. How costly is financial (not economic) distress? Evidence from highly leveraged transactions that became distressed. Journal of Finance 53, 1443– 1193.
Asquith, P., Wizman, T. A., 1990. Event risk, covenants, and bond returns in leveraged Buyouts. Journal of Financial Economics 27, 195-213.
Axelson, U., Stromberg, P., Weisbach, M., 2009. Why are buyouts levered? The financial structure of private equity funds. Journal of Finance 64, 1549 - 1582.
Axelson, U., Jenkinson, T., Stromberg, P., Weisbach, M., 2013. Borrow cheap, buy high? The determinants of leverage and pricing in buyouts. Journal of Finance 68, 2223-2268. Bessembinder, H., Kahle, K.M., Maxwell, W.F., Xu, D., 2009. Measuring abnormal bond performance. Review of Financial Studies 22, 4219-4258.
Cao, X. J., Lerner, J., 2009. The performance of reverse leveraged buyouts. Journal of
Financial Economics 91, 139-157.
Dammon, R.M., Dunn, K.B., Spatt, C.S., 1993. The relative pricing of high-yield debt: the case of RJR Nabisco Holdings Capital Corporation. American Economic Review 83 (5), 1090–1111.
Demiroglu, C, James, C., 2010. The role of private equity group reputation in LBO financing. Journal of Financial Economics 96, 306 - 330.
Diamond, D. W. 1984. Financial intermediation and delegated monitoring. Review of
Financial Studies, 62: 393–414.
Diamond, D. W., 1989. Reputation acquisition in debt markets. Journal of Political
Economy 97, 828-862.
Elton, E., Gruber, M., Blake, C., 1995. Fundamental economic variables, expected returns, and bond fund performance. Journal of Finance 50, 1229-1256.
Elton, E., Gruber, M., Agrawal, D., Mann, C., 2001. Explaining the rate spread on corporate bonds. Journal of Finance 56, 247–77.
Fama, E., MacBeth, J., 1973. Risk, return, and equilibrium: empirical tests. Journal of
Political Economy 81, 607-636.
Fang, L., Ivashina, V., Lerner, J., 2013. An unfair advantage? Combining banking with private equity investing. Review of Financial Studies 26, 2139-2173.
Harford, J., and Kolasinki, A., 2014. Do Private Equity Returns Result from Wealth Transfers and Short-termism? Evidence from a Comprehensive Sample of Large Buyouts and Exit Outcomes. Management Science, 60, 888-902.
Hotchkiss, E. S., Smith, D. S., and Stromberg, P., 2014. Private Equity and the Resolution of Financial Distress. NBER working paper.
Huang, R., Ritter, J. R., Zhang, D., 2015. Private Equity Firms’ Reputational Concerns and the Costs of Debt Financing. Journal of Financial and Quantative Analysis, forthcoming.
Guo, S, Hotchkiss, E., Song, W., 2011. Do buyouts (still) create value? Journal of
Finance 56, 479-517.
Ivashina, V., Kovner, A., 2011. The private equity advantage: Leveraged buyout firms and relationship banking. Review of Financial Studies 24, 2462-2498.
Kaplan, S. N., 1991. The staying power of leveraged buyouts. Journal of Financial
Economics 29, 287-314.
Kaplan, S. N., Stein, J. C. 1990. How risky is the debt in highly leveraged transactions?
Journal of Financial Economics, 27, 215- 245.
Kaplan, S. N., Stein, J. C., 1993. The evolution of buyout pricing and financial structure in the 1980s. Quarterly Journal of Economics 108, 313-357.
Kaplan, S. N., Stromberg, P. J., 2009. Leveraged buyouts and private equity. Journal of
Economic Perspectives 23, 121 - 146.
Loughran, T., Ritter, J.R., 2000. Uniformly least powerful tests of market efficiency.
Journal of Financial Economics 55, 361-389.
Nayak, S., 2010. Investor sentiment and corporate bond yield spreads. Review of
Behavioral Finance 2, 59 - 80
Petersen, M. A., 2009. Estimating standard errors in finance panel data sets: Comparing approaches. Review of Financial Studies 22, 435-480.
Shivdasani, A., Wang, Y. H., 2011. Did structured credit fuel the LBO boom? Journal of
Finance 66, 1291-1328.
Shleifer, A., Summers, L., 1988, Breach of Trust in Hostile Takeovers, in Alan J. Auerbach, editor, Corporate Takeovers: Causes and Consequences. Chicago: University of Chicago Press,
Shleifer, A., Vishny, R.W., 1997. The limits of arbitrage. Journal of Finance 52 (1), 35– 55.
Warga, A., Welch, I., 1993. Bondholder losses in leveraged buyouts. Review of Financial
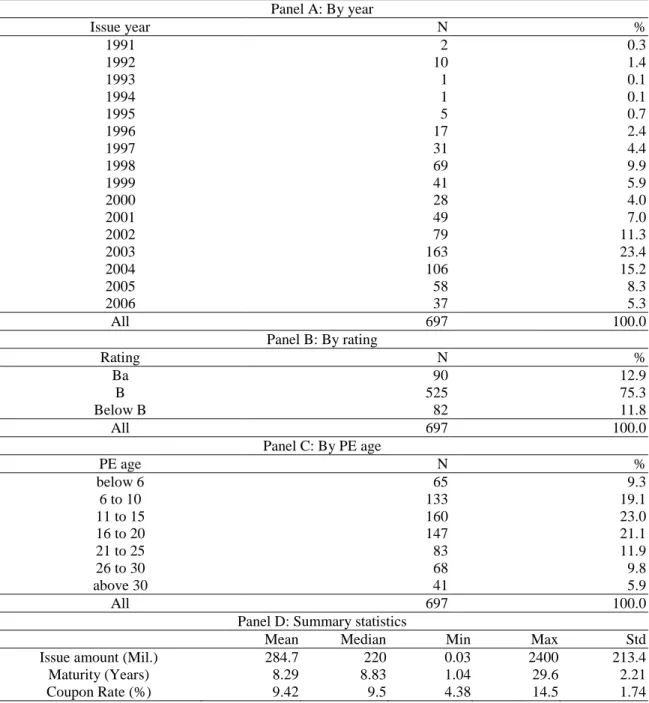
Table 1. Sample distribution and summary statistics
This table reports the distribution and summary statistics of sample bond issues. We collect bond issues from Capital IQ, and select bonds from firms that have private equity groups as their financial sponsors in US from 1991. We drop bonds with deal value less than 5 million. We require bonds with available maturity date, bond rating, issue size, coupon rate, and monthly returns from Lehman Brothers Bond Database. We further drop puttable bonds, zero coupon bonds, bonds with ratings of C or below, and bonds with big return reversals. Rating reflects the ratings from either Moody’s or S&P. PE age is the number of years between PE founding year and bond issue year. Issue amount is the face value of bonds, expressed in millions. Maturity is the time-to-maturity in years. To be consistent with our return calculation, we report the ratings, maturity, and coupon rate at the fourth month after bond issuance month.
Panel A: By year Issue year N % 1991 2 0.3 1992 10 1.4 1993 1 0.1 1994 1 0.1 1995 5 0.7 1996 17 2.4 1997 31 4.4 1998 69 9.9 1999 41 5.9 2000 28 4.0 2001 49 7.0 2002 79 11.3 2003 163 23.4 2004 106 15.2 2005 58 8.3 2006 37 5.3 All 697 100.0 Panel B: By rating Rating N % Ba 90 12.9 B 525 75.3 Below B 82 11.8 All 697 100.0 Panel C: By PE age PE age N % below 6 65 9.3 6 to 10 133 19.1 11 to 15 160 23.0 16 to 20 147 21.1 21 to 25 83 11.9 26 to 30 68 9.8 above 30 41 5.9 All 697 100.0
Panel D: Summary statistics
Mean Median Min Max Std
Issue amount (Mil.) 284.7 220 0.03 2400 213.4
Maturity (Years) 8.29 8.83 1.04 29.6 2.21
Table 2. Long-run raw and abnormal monthly bond returns (%)
This table shows the long-run raw and abnormal average monthly returns for bonds backed up by private equity groups. Bond level means that all returns are first averaged across time for each bond, then summarize across bonds. Firm level returns treat each firm (not each bond) separately. Firm level – Event
Time is obtained by first computing the average monthly return for each bond, then calculating the
value-weighted return of bonds issued by the same firm where the weight is inflation-adjusted market value of bond at post-issuance month 3 or at the first available month-end, whichever is later. Firm level – Calendar
Time is obtained by first computing the value-weighted monthly return for each firm with multiple bonds in
each calendar month, and then averaging the monthly firm-level bond return over time. Numbers in parentheses are t-value for mean tests and p-values for median tests. All returns are in %. The detailed methods to measure abnormal returns are explained in the text. To ensure the three methods measure the abnormal performance over exactly the same period, we define the one-year return as the return from month 4 to month 15 after bond issuance (i.e. the event month 1 in our return calculations is the fourth month after issuance), and the two-year and three-year returns as the returns over the post-issue month 4 to month 27 and month 4 to month 39, respectively. To enlarge our sample size, we do not impose prior three month return requirement on sample bonds, except for the mean-adjusted model. ***, **, and * denote the significance level of 1%, 5%, and 10%, respectively. The numbers in brackets are the percentages of bonds (or firms in the event time approach) with positive returns.
Bond level Firm level
Event Time Calendar Time
Horizon # of bonds Mean Median # of firms Mean Median # of firms Mean Median Panel A: Raw returns
1 year 680 0.205* 0.728*** 310 0.175 0.767*** 310 0.207 0.766*** [75.88%] (1.81) (0.000) [78.39%] (1.08) (0.000) [78.71%] (1.29) (0.000) 2 years 689 0.216* 0.72*** 310 0.138 0.767*** 310 0.195 0.751*** [81.13%] (1.88) (0.000) [80.32%] (0.82) (0.000) [82.90%] (1.20) (0.000) 3 years 697 0.198* 0.745*** 311 0.139 0.776*** 311 0.226 0.78*** [81.78%] (1.73) (0.000) [81.99%] (0.81) (0.000) [84.89%] (1.38) (0.000)
Panel B: Excess returns (bond return - matched Treasury return)
1 year 680 -0.186 0.314*** 310 -0.246 0.371*** 310 -0.19 0.37*** [66.62%] (-1.60) (0.000) [68.06%] (-1.48) (0.000) [69.68%] (-1.15) (0.000) 2 years 689 -0.155 0.375*** 310 -0.241 0.393*** 310 -0.155 0.391*** [72.86%] (-1.32) (0.000) [71.94%] (-1.40) (0.000) [77.10%] (-0.93) (0.000) 3 years 697 -0.18 0.389*** 311 -0.243 0.431*** 311 -0.132 0.43*** [75.61%] (-1.54) (0.000) [73.95%] (-1.39) (0.000) [80.39%] (-0.78) (0.000)
Table 2 (continued).
Bond level Firm level
Event Time Calendar Time
Horizon # of bonds Mean Median # of firms Mean Median # of firms Mean Median Panel C: Mean-adjusted returns (bond return – average return in prior 6 months)
1 year 667 -0.309*** -0.091* 310 -0.238*** -0.026 310 -0.187** 0.03 [46.33%] (-3.05) (0.063) [49.03%] (-2.58) (0.776) [51.29%] (-2.10) (0.691) 2 years 683 -0.181* -0.032* 310 -0.195** -0.037 310 -0.172** -0.023 [46.27%] (-1.93) (0.056) [46.13%] (-2.13) (0.191) [46.77%] (-2.10) (0.281) 3 years 692 -0.253*** -0.024* 311 -0.215** -0.043 311 -0.177** -0.002 [46.68%] (-2.68) (0.087) [45.98%] (-2.37) (0.173) [49.84%] (-2.15) (1.000)
Panel D: Risk-adjusted returns EW (bond return - EW rating/maturity matched portfolio return)
1 year 680 -0.482*** -0.117*** 310 -0.456*** -0.047 310 -0.404*** 0.014 [44.85%] (-4.66) (0.008) [47.42%] (-3.14) (0.394) [51.29%] (-2.78) (0.691) 2 years 689 -0.438*** -0.046 310 -0.465*** 0.021 310 -0.379** 0.062 [47.31%] (-4.14) (0.170) [50.97%] (-3.07) (0.776) [54.52%] (-2.57) (0.125) 3 years 697 -0.447*** -0.025 311 -0.437*** 0.009 311 -0.335** 0.059** [48.35%] (-4.24) (0.405) [50.80%] (-2.84) (0.821) [56.27%] (-2.25) (0.031)
Panel E: Risk-adjusted returns VW (bond return - VW rating/maturity matched portfolio return)
1 year 680 -0.452*** -0.082** 310 -0.437*** -0.041 310 -0.375** 0.042 [45.29%] (-4.35) (0.016) [48.39%] (-2.98) (0.609) [51.94%] (-2.56) (0.532) 2 years 689 -0.404*** -0.027 310 -0.432*** 0.048 310 -0.34** 0.095* [47.75%] (-3.83) (0.253) [51.61%] (-2.85) (0.609) [55.16%] (-2.30) (0.078) 3 years 697 -0.416*** -0.023 311 -0.411*** 0.056 311 -0.303** 0.093*** [48.35%] (-3.95) (0.405) [52.09%] (-2.67) (0.496) [57.88%] (-2.04) (0.006)
Panel F: 1% winsorized risk-adjusted returns VW
1 year 680 -0.404*** -0.082** 310 -0.371*** -0.041 310 -0.324*** 0.042 [45.29%] (-4.63) (0.016) [48.39%] (-3.22) (0.609) [51.94%] (-2.74) (0.532) 2 years 689 -0.352*** -0.027 310 -0.386*** 0.048 310 -0.304** 0.095* [47.75%] (-3.99) (0.253) [51.61%] (-3.11) (0.609) [55.16%] (-2.45) (0.078) 3 years 697 -0.366*** -0.023 311 -0.358*** 0.056 311 -0.262** 0.093*** [48.35%] (-4.13) (0.405) [52.09%] (-2.81) (0.496) [57.88%] (-2.08) (0.006)
Table 3. Calendar-time portfolio regressions
This table reports long-run monthly abnormal returns (in %) based on calendar-time bond portfolio regressions. The abnormal return is measured by the regression intercept. We use Elton, Gruber, and Blake (1995) factor model excluding the unexpected change in GDP and the unexpected change in consumer price index. Rm–Rf is the excess CRSP value-weighted stock index return, R bond is the return on the Lehman Corporate bond index, DRP is the default risk premium, and Term is the term premium. To avoid that smaller bond issues dominating the regression estimations, we examine both equal-weighted and value-weighted bond portfolio returns. Moreover, the regressions are conducted in both the ordinary least square (OLS) approach that assigns an equal weight to each calendar month and the weighted least square (WLS) approach that assigns the number of bonds in a given month as the weight. For OLS regressions, we require at least five observations in each month. ***, **, and * denote the significance level of 1%, 5%, and 10%, respectively.
Horizon Intercept Rm - Rf R bond DRP Term Adj R2
Panel A: OLS regressions Equal-weighted portfolio 1 year -0.281*** 0.016 1.555 0.786 -0.335 0.71 (-2.60) (0.57) (4.80) (14.06) (-2.37) 2 years -0.090 -0.050 1.567 0.835 -0.372 0.71 (-0.91) (-1.83) (5.22) (15.60) (-2.77) 3 years -0.043 -0.031 1.557 0.826 -0.387 0.73 (-0.48) (-1.23) (5.82) (16.44) (-3.20) Value-weighted portfolio 1 year -0.183* 0.015 1.951 0.735 -0.500 0.71 (-1.71) (0.54) (6.07) (13.25) (-3.55) 2 years -0.053 -0.014 1.510 0.717 -0.338 0.74 (-0.65) (-0.60) (5.94) (15.82) (-2.98) 3 years -0.038 -0.005 1.492 0.723 -0.340 0.77 (-0.51) (-0.22) (6.73) (17.38) (-3.39) Panel B: WLS regressions Equal-weighted portfolio 1 year -0.319*** 0.028 1.349 0.746 -0.267 0.72 (-3.43) (1.11) (4.59) (15.55) (-2.09) 2 years -0.146 -0.036 1.363 0.765 -0.269 0.68 (-1.58) (-1.38) (4.69) (15.82) (-2.12) 3 years -0.083 -0.019 1.431 0.754 -0.307 0.69 (-0.91) (-0.74) (5.02) (15.70) (-2.46) Value-weighted portfolio 1 year -0.213** 0.021 1.799 0.710 -0.443 0.72 (-2.33) (0.83) (6.23) (15.09) (-3.52) 2 years -0.096 -0.006 1.428 0.677 -0.283 0.72 (-1.23) (-0.27) (5.82) (16.56) (-2.64) 3 years -0.072 0.007 1.446 0.668 -0.294 0.74 (-0.97) (0.32) (6.19) (16.98) (-2.88)