The Lasing Characteristics of GaN-based Two-dimensional Photonic
Crystal Surface Emitting Lasers
S. W. Chen, T. T. Kao, T. T. Wu, T. C. Lu
(a), H. C. Kuo, and S. C. Wang
Department of Photonics and Institute of Electro-Optical Engineering,
National Chiao-Tung University, 1001 Ta Hsueh Rd., Hsinchu 30050, Taiwan
1. ABSTRACT
GaN-based photonic crystal surface-emitting lasers(PCSELs) with AlN/GaN distributed Bragg reflectors were fabricated and analyzed. Different lasing characteristics of GaN-based PCSEL has been determeined and demonstrated by the PC lattice constants. The laser emission behavior covered the whole PC patterns of 50 μm in diameter. Under the optical pumping at room temperature, the PCSEL with PC lattice constant of 230nm shows a threshold energy density of about 2.7 mJ/cm2. Above the threshold, one dominated peak emits at 420.11 nm with a linewidth of 1.1 Å. The lasing
wavelength emitted from PC lasers with different lattice constants occurs at the calculated band-edges provided by the PC patterns which further shows different polarization angles due to the light diffracted in specific directions, corresponding exactly to Г, K, and M directions in the K-space. The PCSEL also shows a characteristic temperature of 148K and a spontaneous emission coupling efficiency β of about 5x10⁻³.Besides, the coupled-wave model in the PC
hexagonal-lattice is applied to distinguish the discrepancy in threshold power and the corresponding coupling coefficient. The results show the lasing actions within Г, K, and M modes have the substantial relation between the threshold energy density and the coupling coefficient.
KEYWORDS: GaN, photonic crystal, surface emitting laser
2. INTRODUCTION
During the past decade, two dimensional (2D) photonic crystals (PC) attract many attentions and achieved great photon confinement which has been applied to many optical devices in recent years [1-3]. In general, the PC lasers have been reported in two types call photonic crystal surface emitting lasers (PCSELs). The first type is the PC defect laser which formed a resonant cavity and the lasing actions accured at the high Q cavity with a small modal volume. This type can achieve strong Purcell effect and low-threshold lasing behavior [4-5]. However, the second type of 2D PC structures distributed feedback laser operates at the band gap edge called the PC band edge laser. These PCSEL structures usually composed of a perfect photonic crystal lattice and the laser action would happen in those band edge points in the photonic band diagram by satisfying the Bragg condition. The PC laser have been reported in different material systems including InP, organic, and GaN [6-9], but some properties of PCSELs have not been reported in details such as emission modes, polarization, characteristic temperature and spontaneous coupling efficiency. In this article, the band edge PCSEL with distributed Bragg reflector (DBR) were fabricated and demonstrated which consisted of 29 pairs of AlN/GaN DBR, n-type GaN, multi-quantum wells (MQWs), and p-type GaN grown by metal-organic chemical vapor deposition system. Under the optical pumping conditions, the optical characteristics of the PC lasers with different PC lattices such as the threshold energy densities, characteristic temperature, the transition behavior from spontaneous emission to stimulated emission, laser polarization, and spontaneous emission coupling factors were obtained. Besides, the lasing wavelength emitted from GaN-based PC lasers with different lattice constants occurred at the calculated band-edges, showing different polarization angles indicated different lasing modes corresponding to Γ, K, and M Brillouin-zone boundaries [10]. Furthermore, the calculation of the coupled-wave model in 2D hexagonal-lattice can explain the discrepancy in threshold power with a TE-like mode by considering higher components of Bloch modes and
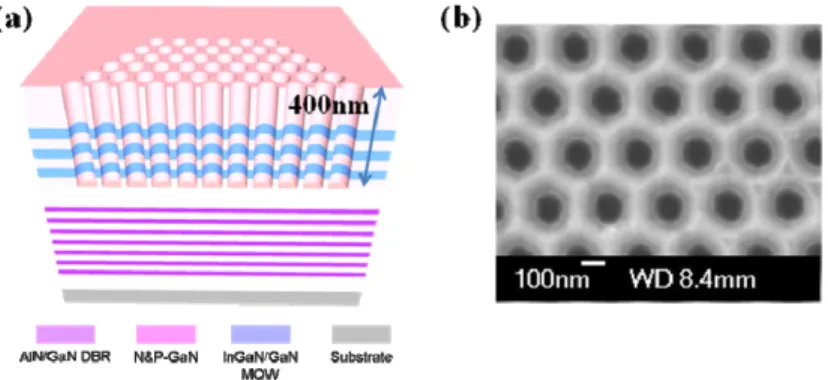
Fig. 1 (a). Schematic diagram of the overall PCSEL structure; (b) Top view SEM images of PC pattern with Hexagonal lattices.
the corresponding coupling coefficients [11]-[13]. The GaN-based PCSELs which has characteristics of small divergence angle, large area and single mode emission show great potential in high output power emitter applications.
3. EXPERIMENT
Fig.1 (a) shows the GaN-based PCSEL structure grown on a sapphire substrate by low pressure metal-organic chemical vapor deposition (MOCVD) system structure. The Trimethylindiuim, TrimethylGallium, TrimethylAluminum and gaseous NH3 were used as the reactant source materials for In, Ga, Al and N. The 35 pairs quarter-wave GaN/AlN
DBR was grown on 2um, a 560 nm-thick n-type GaN cladding layer, a ten-pair In0.2Ga0.8N multi-quantum well (MQW),
and a 200 nm thick p-type GaN cladding layer. Then, the as-grown sample was deposited a SiNx layer of 200 nm by PECVD and followed by a PMMA layer of 150 nm. We defined a hexagonal PC patterns with the lattice constant a ranging from 175 nm to 265 nm on the PMMA layer by E-beam lithography and the sample was etched down about 400 nm deep by ICP-RIE. The whole PC pattern was of a circular shape with a diameter of 50 μm., The Si3N4 and PMMA
layers were removed by acetone and buffered oxides etch (BOE) solutions . The top view and cross section of the hexagonal PC pattern on the GaN-based structure thus created was shown in Fig. 2.
The emission spectrum of the GaN-based PC surface-emission structure was measured using a microscopy system (WITec, alpha SNOM). The optical pumping was performed by a Nd:YVO4 355 nm pulsed laser with a pulse width of ~
0.5 ns at a repetition rate of 1 KHz. The pumping laser beam, with a spot size of 50 μm, was normally incident onto the sample surface and covered the whole PC pattern area. A 15X objective lens with a numerical aperture of 0.32 was placed normally to the sample to collect the light emission from the top of the photonic crystal pattern. The light was then collected by through a fiber with a 600 μm core, and coupled into a spectrometer with a charge coupled device (CCD). The spectral resolution is about 0.1 nm for spectral output measurement. The GaN-based PCSELs were placed in a cryogenics controlled chamber for obtaining the characteristic temperature. The temperature of the chamber can be controlled from room temperature 300K down to 100K using the liquid nitrogen.
4. RESULTS AND DISCUSSION
Fig. 2 indicates the pumping energy density of dependence on the output emission intensity from the sample with PC lattice constant of 230 nm. The threshold characteristic was occurred at the threshold pumping energy density of 2.7 mJ/cm2 obviously. The laser output increases abruptly with the excitation energy density beyond the threshold. Fig. 3
shows the excitation energy density versus emission spectra. The transition behavior from spontaneous emission to stimulated emission with a single dominant peak shows in these spectra clearly. Above the threshold, we can observe only one wavelength of about 420.1 nm with a full width at half maximum (FWHM) of 0.11 nm limited by our measurement.
1 2 3 4 5 0 1 2 3 4 5
Intensity(arb. unit)
Pumping energy density(mJ/cm
2)
In order to comprehend the spontaneous coupling factor β of the GaN-based PCSELs, we replotted the laser emission intensity varied with pumping energy from Fig. 4 in logarithmic scale as shown in Fig. 4(a), and then calculated the difference between the heights of the emission intensities below and above the threshold, corresponding roughly to the value of β. The β value of PCSEL was calculated about 5×10⁻³. Obviously, this β value is smaller than the GaN-based
vertical cavity surface emitting lasers [14], but the β factor is still higher than the typical edge emitting lasers about 2 orders of magnitude meaning the spontaneous emission was coupling into a lasing mode. Figure 5(b) shows the semi natural-logarithm scale of the threshold pumping energy (
ln
( )
E
th ) versed the operation temperature (To). The threshold energy gradually increased as the operation rose from 100 to 300K. The relationship between the threshold energy and the operation temperature could be characterized by the equation: T Too
th
E
e
E
=
×
/, where To is the characteristic temperature and Eo is a constant. Therefore, we obtain a characteristic temperature of about 148K by linear fitting of the experiment data, which is close to the value reported for GaN-based edge emitting lasers [15].
Fig. 4. (a) Spontaneous coupling factor and (b) characteristic temperature of PCSELs Fig. 2. Measured output intensity versus input
excitation energy density from the GaN-based two-dimensional PCSEL with bottom AlN/GaN distributed Bragg reflectors at room temperature.
Fig. 3. Emission spectra under varied excitation energy density from the GaN-based two-dimensional PCSELs with bottom AlN/GaN distributed Bragg reflectors at room temperature. 414 416 418 420 422 424 Intensity(arb. unit) Wavelength(nm) 420.11nm 0.11nm
5.
SIMULATION AND CALCULATION
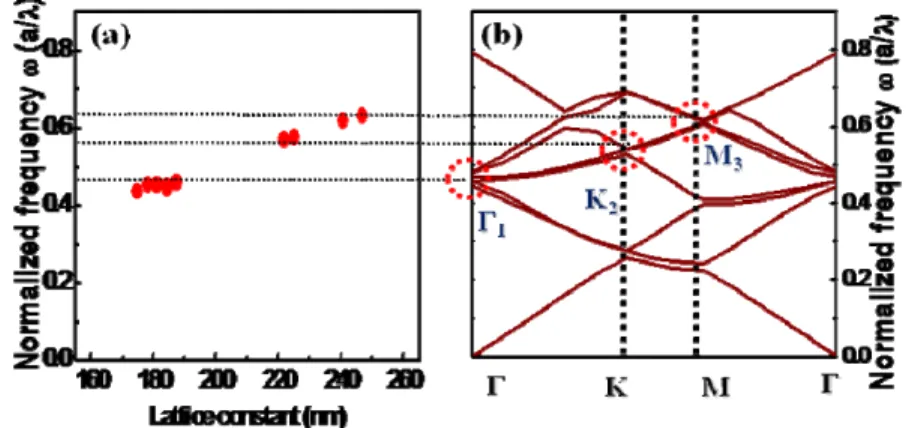
It can be noticed that the single mode lasing phenomenon only occurs in the whole PC patterned areas. In other words, when the area without PC patterns was pumped at the threshold energy density two orders of magnitude higher, multiple lasing peaks were occurred. Fig. 6(a) shows the normalized frequency (lattice constant over wavelength, a/λ) for the lasing wavelength emitted from our PC lasers with different lattice constants. All of the lasing peaks from the PC lasers were ranging from 401 to 425 nm. It delivers the normalized lasing frequency (dotted points in the figure) increased with the lattice constant in a discontinues and step-like fashion. In order to calculate the band diagram of the hexagonal PC patterns in this structure, the plane-wave expansion method in two-dimensions with an effective index approach was employed that took into account the effects of partial modal overlap of electromagnetic fields with the PC structures [17]. As a starting point, the ratio of light confined within the 2D PC structure to light extended in the entire device, Γg and the effective refractive index of the entire device neff were first estimated by the transfer matrix method.
The result indicates that the PC region has the lowest order guided mode and the MQW region has the highest confinement factor. The Γg and neff parameters are estimated to be 0.563 and 2.495, respectively. Then we determined
the effective dielectric constants of the two materials in the unit cell, εa and εb, by using neff2 = f εa+(1− f )εb and Δε = εb
− εa = Γg (εmat − εair), where f = (2πR2 √3a2) is a filling factor and εmat and εair are dielectric constants of GaN (=2.52) and
air (=12), respectively. The values of ε
a (4.11) and εb (7.07) thus obtained were then put into the calculation of the band diagram for the 2D hexagonal-lattice structure with r /a = 0.28.
Fig. 6. (a) Normalized frequency versers the lattice constant. The solid circle points are the lasing wavelengths from the different PC structures. (b) Calculated band diagram of the 2D hexagonal-lattice structure. The dotted lines are guides for band edges.
Figure 6(b) indicates the calculated band diagram of the 2D hexagonal-lattice structure for transverse-electric (TE) mode. It can be seen that the lasing points happens at specific points such as at Brillouin-zone boundary near the band edges, because the Bragg condition is satisfied and the density of states is higher in these points.[17] Wave can propagate and couple with each other in different directions at these lasing points. The dotted lines are guides for band edges calculated in Fig. 6(b) and extended horizontally to Fig. 6(a) with the same normalized frequency. It delivers that different groups of the normalized frequency observed in the PC samples with different lattice constants which occur exactly at band edges such as Γ, M, and K points, showing that the laser operation of 2D PC structure was provided by multidirectional distributed feedback. The characteristics of Γ, M, and K points lasing can be further identified by the polarization angle of the output emission. It can be notice that the output intensity is larger when some of the lasing frequencies are in the stopband of DBR. It could be due to that the bottom DBR that could be treated as a high reflectivity reflector, facilitating top emission efficiency.
The lasing area of the GaN-based 2D PCSEL, obtained by a CCD camera, is relatively large which covers almost whole area of PC pattern with only one dominant lasing wavelength. The measured FWHM of laser emission divergence angle is smaller than 5°, which is limited by our measurement setup, indicating that the surface emission is almost normal from the PC surface. It’s interesting to note that the threshold power density of GaN-based 2D PCSELs which are
in the same order or even better than the threshold for GaN-based vertical-cavity surface emitting lasers (VCSELs) that we demonstrated recently [16]. Unlike the small emission spots observed in the GaN-based VCSELs, the large-area emission in 2D PCSELs has great potential in the applications of such high power output operation.
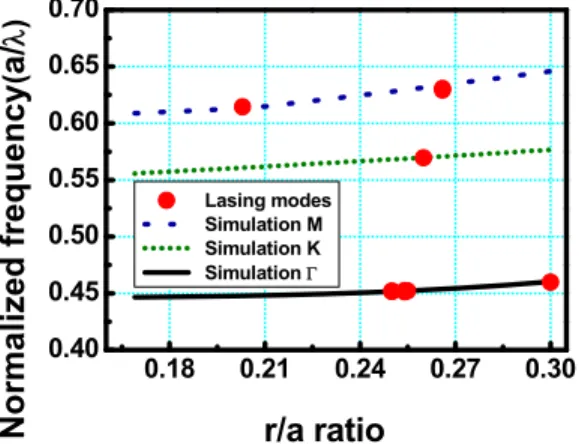
Fig. 7 shows the normalized frequencies as a function of r/a ratio. Different lasing frequencies were measured from different PC lattice structures. We apply the plane-wave expansion method in two-dimensions with an effective index model, considering the effects of partial modal overlap of electromagnetic fields with the PC structures to calculate the band diagram of the hexagonal PC patterns in this structure. The solid (black), dot (red), and dash (green) lines in Fig. 9 are the calculated band edge frequencies at the Г, K, and M Brillouin-zone boundaries as a function of r/a ratio, which were in accordance with the measured results.
0.18 0.21 0.24 0.27 0.30 0.40 0.45 0.50 0.55 0.60 0.65 0.70 Normalize d f requency ( a/ λ) r/a ratio Lasing modes Simulation M Simulation K Simulation Γ
Fig. 7 Normalized frequencies as a function of r/a ratios
The measured polarization curves for different band edge lasers calculated by the plane-wave expansion method and were grouped into Г (red-circle points and solid line), K (green-triangle points and dot line), and M (blue-square points and dash line) boundaries, are shown in Fig. 8(a) and the degree of polarizations from the emission defined as (Imax-Imin)/(Imax+Imin) were somehow around 50%. It points out the different directions that the polarization angles from
the emissions of devices with different PC lattice constant which were grouped into Γ, K or M band edge lasers. Since the photonic crystal lattices provide the optical feedback, which is the origin of the band edge laser operation, the direction and the polarization of the laser light will strictly follow the photonic crystal lattice vectors. The symmetric feedback directions provided by the 2D lattice vectors could result in a relatively low degree of polarization if the measurement of the polarization is from the top of the device [15].
Fig.8. (a) The measured polarization curves for different band edge lasers grouped (b) The main polarization directions obtains in (a) and their corresponding diffracted laser beams, which are normal to the polarization directions in K-space map corresponding to
We can obtain the laser emission which precisely occurs at three different band-edge frequencies (Γ1, K2, M3) with different threshold pumping powers. Fig. 8 shows that the lasing actions could organize into three groups, where lasing within Г1 mode shows the lowest threshold power while lasing within M3 mode has the highest threshold power. These results which can be explained by coupled-wave model calculation could be applied to the different coupling effects at different band edges.
In order to simplify the calculation, the 2D PC structure investigated here includes of an infinite hexagonal lattice with circular air holes in the x and y directions. Fig. 10 shows the corresponding K space of two-dimensional PC, this PC structure is also assumed to be uniform in the z direction. Besides, the gain effects are neglected here during the calculation to extract the pure diffraction effects. The scalar wave equation for the magnetic field Hz in the TE mode can be written as [10-12] while considering the infinite structure.
2 2 2 2 2 0 z z z H H k H x y ∂ ∂ + + = ∂ ∂ (1) where
[
]
2 2 0 2 2 ( ) exp ( ) G k β jαβ β k G j G r ≠ = + +∑
⋅ (2)And as shown in Fig. 9, the magnetic field can be defined by the Bloch mode when considering the Γ1 band edge:
[
]
( ) Gexp ( ) z G H r =∑
h j k G r+ ⋅ (3) where 0 0 0 0 0 0 1ˆ 3ˆ 1ˆ 3ˆ 1ˆ 3ˆ 1ˆ 3ˆ ( ) ( ) ( ) ( ) ˆ 2 2 2 2 ˆ 2 2 2 2 1( , ) 2 3 4 5 6 i x y i x y i x y i x y i x i x z H H x y e β H e β H e β H eβ H e β H e β − − − + − + − − − − − = + + + + + (4)Substituting Eq. (4) and Eq. (2) into Eq. (1), and comparing the equal exponential terms, therefore we can obtain six wave equations. 1 2 1 ( ) 1 ( 2 6) ( 3 5) 3 4 2 2 H i H i H H i H H i H x κ κ α δ κ ∂ − + − − = − + + + + ∂ , 1 2 2 2 2 1 3 4 6 3 5 1 3 ( ) ( ) ( ) 2 xH 2 yH i H i2 H H i 2 H H i H κ κ α δ κ ∂ ∂ − − + − − = − + + + + ∂ ∂ , 1 2 3 3 3 2 4 1 5 3 6 1 3 ( ) ( ) ( ) 2 xH 2 yH i H i 2 H H i 2 H H i H κ κ α δ κ ∂ ∂ − − + − − = − + + + + ∂ ∂ , 1 2 4 ( ) 4 2( 3 5) 2( 2 6) 3 1 H i H i H H i H H i H x κ κ α δ κ ∂ + − − = − + + + + ∂ ,
1 2 5 5 5 4 6 1 3 3 2 1 3 ( ) ( ) ( ) 2 xH 2 yH i H i2 H H i 2 H H i H κ κ α δ κ ∂ ∂ + + − − = − + + + + ∂ ∂ , 1 2 6 6 6 1 5 2 4 3 3 1 3 ( ) ( ) ( ) 2 xH 2 yH i H i2 H H i 2 H H i H κ κ α δ κ ∂ ∂ − + + − − = − + + + + ∂ ∂ (5.a-e)
where H1, H2, H3, H4, H5 and H6 express the envelope magnetic field distributions of individual light waves propagating
in the six equivalent Г-M directions: 0°, +60°, +120°,+180°, +240°, and +300° with respect to the x-axis. κ1
,
κ2, and
3κ are the coupling coefficients between light waves propagating at 60° to each other (H1 and H2, H2 and H3, and so on),
at 120° (H1 and H3, H2 and H4, and so on), and at 180° (H1 and H4, H2 and H5, and so on), respectively. δ is the deviation
of the wave number β (expressed as 2πν/c, where ν is the frequency and c is the velocity of light) from the fundamental propagation constant β0 (equal to 4 / 3aπ , where a is the lattice constant) for each cavity mode, and expressed as
2 2
0 0
( ) / 2
δ = β −β β . α is the corresponding threshold gain.
The eigenvalue of frequency ν for each band-edge mode and the corresponding threshold gain α for a given set of coupling coefficients, κ , 1 κ , and 2 κ can be obtained by solving Eq. (5.a-e). When only the eigen frequencies are 3 concerned, the derivation terms and the threshold gain α in Eq. (5.a-e) can be set to zero, and then the individual eigen frequencies can be derived as follows:
1 ( 0 1 2 3) 2 eff c n ν β κ κ κ π = − − + (6.a) 2 0 1 2 3 1 1 ( ) 2 eff 2 2 c n ν β κ κ κ π = − + − (6.b) 3 ( 0 1 2 3) 2 eff c n ν β κ κ κ π = + − − (6.c) 4 0 1 2 3 1 1 ( ) 2 eff 2 2 c n ν β κ κ κ π = + + + (6.d)
where, the parameter c presents the velocity of a photon in vacuum, and neffpresents the effective refractive index of the device structure. There are four eigen mode frequencies, ν1 to ν4, which correspond to the four band-edges, including two
degenerate modes with ν2 and ν4. As the eigen mode frequency at the individual band-edges is obtained, the coupling
coefficients κ , 1 κ , and 2 κ , can be derived from Eq. (6.a-d) as follows: 3
1 2 3 4 1 0 1 2 3 4 2 2 2 v v v v v v v v κ = − − + + β + + + (7.a) 1 2 3 4 2 0 1 2 3 4 2 2 2 v v v v v v v v κ = − + − + β + + + (7.b)
1 2 3 4 3 0 1 2 3 4 2 2 2 2 2 v v v v v v v v κ = − − + β + + + (7.c) According to correct device parameters, we can determine which kind of distributed feedback mechanism provide the major significant contribution to sustain the lasing oscillation at Γ1 by comparing the value of coupling coefficients κ , 1
2
κ , and κ 3
(1) K2 (shown in Fig. 10(a). There are two eigen mode frequencies with only one coupling angle at 120° for one coupling coefficient.) 2 1 0 1 2 2 2 v v v v κ = − β + (8) (2) M3 (shown Fig. 10(b). There are four eigen mode frequencies with three coupling angles, i.e. 82°, 98°, and 180° for
coupling coefficients κ , 1 κ , and 2 κ .) 3
1 2 3 4 1 0 1 2 3 4 v v v v v v v v κ = − − + β + + + (9.a) 1 2 3 4 2 0 1 2 3 4 v v v v v v v v κ =− + − + β + + + (9.b) 1 2 3 4 3 0 1 2 3 4 v v v v v v v v κ =− − + + β + + + (9.c)
It could be using the band edge frequencies to estimate the coupling coefficient of each PC surface-emitting laser shown in Fig. 5(b). First, for Г1 mode, substituting the normalized frequencies, 0.4482, 0.4595, 0.4704, 0.4930 with the PC lattice constant of about 180 nm into the expression of Eq 7(a), 7(b), and 7(c), the coupling coefficients κ1~17480,
κ2~11240, κ3~11268 (cm-1) were obtained. The largest coupling coefficient κ1 points that the light waves propagating at
60° to each other dominate the coupling effect.
Similarly, for K2 mode, substituting the normalized frequencies 0.5326 and 0.5413 with the PC lattice constant of about 220 nm into the expression of Eq 8, the coupling coefficient κ~4089 (cm-1) would be obtained.
For M3 mode, substituting the normalized frequencies, 0.6089, 0.6094, 0.6141, and 0.6234 with the PC lattice constant of about 247 nm into the expression of Eq 9(a), 9(b), and 9(c), the coupling coefficient κ1~1241, κ2~1356, κ3~2683 (cm-1)were obtained. The largest coupling coefficient κ3 delivers that greatest feedback effect is similar to that
of a conventional in-plane distributed feedback laser. Furthermore, be notice that the lasing action within Г1 mode shows the lowest threshold power in Fig. 8, which could be attributed to the largest coupling coefficient. On the other hand, lasing within M3 mode has the highest threshold power due to the lowest coupling coefficient.
Fig. 9 Different threshold power versus normalized frequency.
Fig. 10 Schematic diagram of six propagation waves in hexagonal lattice for Г1 band edge.
Fig. 11 Schematic diagram of propagation waves in hexagonal lattice for (a) K2 band edge; (b) M3 band edge.
CONCLUTION
The different lattice constants of GaN-based PCSELs with AlN/GaN bottom DBRs have successfully fabricated and investigated. A clear threshold characteristic was observed with a threshold energy density of about 2.7 mJ/cm2 for the
PC lattice constant of 230 nm under the optical pumping at room temperature. Only one dominant peak was occurred at 420.11 nm with a linewidth of about 0.11 nm above the threshold. The two-dimensional PC surface-emitting laser delivers a characteristic temperature about 148K and a spontaneous emission coupling factor β of about 5×10⁻³.
Compared with photonic band diagram and the relation between the PC lattice constants and normalized frequencies, the characteristics of Γ, M, and K points lasing can be indicated by the polarization angle of the output emission. Besides, it can explain the discrepancy in threshold power by considering higher components of Bloch modes and the corresponding coupling coefficients by apply the coupled-wave model in 2D hexagonal-lattice. The lasing action within Г1 mode which
had the lowest threshold power corresponded to the largest coupling coefficient was demonstrated. On the other hand, the highest threshold energy power occurring within M3 mode corresponded to the lowest coupling coefficient.
ACKNOWLEDGEMENT
The authors would like to gratefully acknowledge P. C. Yu at National Chiao-Tung University and Prof. S.H. Fan at Stanford University for their fruitful suggestion. The study was supported by the MOE ATU program, Nano Facility Center and, in part, by the National Science Council in Taiwan under Contract Nos. NSC95-3114-P-009-001-MY2 and NSC96-2120-M009-006.
REFERENCES
1. E. Yablonovitch, “Inhibited Spontaneous Emission in Solid-State Physics and Electronics”, Phys. Rev. Lett. 58, 2059 (1987).
2. S. John, “Strong localization of photons in certain disordered dielectric superlattices”, Phys. Rev. Lett. 58, 2486 (1987).
3. J. D. Joannopoulos, P. R. Villeneuve, and S. Fan, “Photonic Crystal: putting a new twist on light”, Nature (London) 386,143 (1997).
4. O. Painter, R. K. Lee, A. Scherer, A. Yariv, J. D. O’Brien, P. D. Dapkus,and I. Kim, “Two-dimensional photonic band-gap defect mode laser”, Science 284, 1819 (1999).
5. H. G. Park, S. H. Kim, S. H. Kwon, Y. G. Ju, J. K. Yang, J. H. Baek, S. B.Kim, and Y. H. Lee, “Electrically Driven Single-Cell Photonic Crystal Laser”, Science 305, 1444 (2005).
6. S. H. Kwon, H. Y. Ryu, G. H. Kim, Y. H. Lee, and S.B. Kim, “Photonic bandedge lasers in two-dimensional square-lattice photonic crystal slabs”, Appl. Phys. Lett. 83, 3870 (2003)
7. M. Notomi, H. Suzuki, and T. Tamamura, “Directional lasing oscillation of two-dimensional organic photonic crystal lasers at several photonic band gaps”, Appl. Phys. Lett., 78, 1325(2001)
8. H. Matsubara, S. Yoshimoto, H. Saito, Y. Jianglin, Y. Tanaka, S. Noda, “GaN photonic-crystal surface-emitting laser at blue-violet wavelengths”, Science, 319, 445 (2008)
9. T. C. Lu, S. W. Chen, L. F. Lin, T. T. Kao, C. C. Kao, P. Yu, H. C. Kuo, and S. C. Wang, “GaN-based two-dimensional surface-emitting photonic crystal lasers with AlN/GaN distributed Bragg reflector”, Appl. Phys. Lett, 92, 011129 (2008)
10. T. C. Lu, S. W. Chen, T. T. Kao, T. W. Liu, “Characteristics of GaN-based photonic crystal surface emitting lasers”, Appl. Phys. Lett., 93, 111111(2008).
11. Plihal and A. A. Maradudin, “Photonic band structure of two-dimensional systems: The triangular lattice”, Phys. Rev. B, 44, 8565 (1991)
12. K. Sakai, J. Yue, S. Noda, “Coupled-wave model for triangular-lattice photonic crystal with transverse electric polarization”, Optics Express, 16, 6033 (2008).
13. H. Kogelnik, “Coupled wave theory for thick hologram gratings”, Bell Syst. Tech. J, 48, 2909 (1969).
14. H. Y. Ryu, S. H. Kwon, Y. J. Lee, Y. H. Lee, and J. S. Kim, “Very-low-threshold photonic band-edge lasers from free-standing triangular photonic crystal slabs”, Appl. Phys. Lett. 80, 3476(2002)
15. C. C. Kao, T. C. Lu, H. W. Huang, J. T. Chu, Y. C. Peng, H. H. Yao, J. Y. Tsai, T. T. Kao, H. C. Kuo, “The Lasing Characteristics of GaN-Based Vertical-Cavity Surface-Emitting Laser With AlN–GaN and Ta2O5–SiO2 Distributed Bragg Reflectors”, IEEE Photon. Tech. Lett., 18, 877 (2006)
16. C. Skierbiszewski, P. Perlin, I. Grzegory, Z. R. Wasilewski, M. Siekacz, A. Feduniewicz, P. Wisniewski, J. Borysiuk, P. Prystawko, G. Kamler, T. Suski, and S. Porowski, “High power blue violet InGaN laser diodes grown on bulk GaN substrates by plasma-assisted molecular beam epitaxy”, Semicond. Sci. Technol., 20, 809 (2005) 17. M. Imada, A. Chutinan, S. Noda, and M. Mochizuki, “Finite-difference time-domain investigation of band-edge