African Journal of Business Management Vol. 5(12), pp. 4945-4954, 18 June, 2011 Available online at http://www.academicjournals.org/AJBM
DOI: 10.5897/AJBM11.057
ISSN 1993-8233 ©2011 Academic Journals
Full Length Research Paper
A novel nonlinear forecasting model for output of bike
industry by Grey model and Taguchi-differential
evolution algorithm
Ming-Chang Zheng and Jyh-Horng Chou*
Institute of Engineering Science and Technology, National Kaohsiung First University of Science and Technology, 1 University Road, Yenchao, Kaohsiung 824, Taiwan, Republic of China.
Accepted 17 March, 2011
Global marketing status shows that over 120 million bikes are being produced around the world yearly. Taiwan applied a cross-strait division of labor to manufacture about 30 million bikes in 2009. Since many study applied forecasts are basic inputs for many kinds of decisions and policy in business and government. This paper proposed a novel nonlinear forecasting model, known as Taguchi-differential evolution algorithm grey forecasting model (1,1) (TDEGM(1,1)). The TDEGM(1,1) is validated using integrated circuit and bike industry forecasting as study cases. Furthermore, the mean absolute percentage error is used to compare the performance of the forecasted models. The TDEGM(1,1) was the most accurate one among these models which are original GM(1,1), the Bayesian GM(1,1) and genetic algorithms GM(1,1). Meanwhile, the convergence result of TDEGM(1,1) is proved faster than genetic algorithms-based GM(1,1) and Bayesian GM(1,1). In the 2013, the output value of bike maybe over 2000 million according to forecasting result.
Key words: GM(1,1), differential evolution algorithm, bike, nonlinear time series forecasting.
INTRODUCTION
In the past years, the concept of health and sustainability has changed the living style of people all around the world. Aside from the leisure and the transportation value, a growing numbers of people globally embraced cycling for short-distance transportation in recent years in order to cope with the soaring oil prices. In Paris, London, Barcelona, Shanghai and Montreal, the use of bike will get a further boost from the launch of public-bike leasing systems for short-distance transportation. In Europe, 10 cities have adopted the plan of bike to carpool. Also, Barack Obama, the President of the United States proposed to extend bike lanes to promote cycling in every state as a green transportation revolution which can transform the transportation habit. Further, these changes of transportation habits have been a boom for the Taiwanese bike manufacturers. They not only affect people’s leisure and transportation habits, but also
*Corresponding author. E-mail: choujh@nkfust.edu.tw
consolidate the status of Taiwan as the world’s center of bike production (Liu, 2009).
Global marketing condition shows that over 120 million bikes are being produced around the world yearly. About 90 million among them come from Asia, 13 million from Europe, 5.5 million from America, and about 5 million from other markets. Taiwan had produced a sum of 6 million bikes in 2008 and applied a cross-strait division of labor to manufacture about 30 million bikes which had occupied over one fourth of the world's total production.
In a supply chain, the forecast of future demand forms the basis for all strategic and planning decisions. In the push or pull system of production, the supply chain manager must forecast what customer demand in the future. In the inventory management, demand forecasting is one of the challenging problems (Dolgui and Pashkevich, 2008). Forecasts are basic inputs for many kinds of decisions and policy in business organizations and government (Stevenson, 1999). If uncertainties cloud the planning horizon, quantity and value of production, managers will find it difficult to plan effectively. Therefore,
4946 Afr. J. Bus. Manage.
accurate forecasts are needed because future demand plays a very important role in production planning and inventory management (Gutierrez et al., 2008). Zhang (2004) applied three forecasting methods to reduce the lowest inventory cost on the bullwhip effect for supply chain system. Therefore, forecasts help decision maker by reducing some of the uncertainty risk. Moreover, the output value of industry retorts to the industry boom; consequently, the total industrial output value could represent the economic situation of the supply chain as a whole. On the bike industry, owing to the global promotion of cycling, the forecasts of the output value of Taiwan's development of bike is of great importance. It also serves as an important and crucial role for business operation. There are a few methods applied in forecasting the output value of industries (Hsu, 2003; Hsu and Chen, 2003; Hsu et al., 2003; Lin and Yang., 2003; Chang et al., 2005; Hsu and Wang, 2007; Wang and Hsu, 2008; Pai et al., 2009; Hsu, 2009, 2010; Chen et al., 2010; Lee and Tong, 2011).
Forecasting methods are more than 300 different kinds including Qualitative and Quantitative ones. Qualitative forecasting methods have Delphi method, prediction method and the expert system etc; whereas the quantitative forecasting methods include Grey model (GM) (Deng, 1982), neural networks, and time series etc. Even though the academic has developed a wide range of forecasting methods, the industry applies those methods which are relatively simple and relies on decision-makers’ rule of thumb such as Delphi method. Although the aforementioned methods are relatively uncomplicated, they are somewhat rough for a highly competitive economical environment.
Integrated Circuit (IC) industry has the characteristics of short produced life cycle and ever-changing manu-facturing technology. Hsu and Wang (2007) showed that these traditional forecasting methods need a large data to construct the forecasting model, but GM method does not require a large number of data. In the forecasting fields, the GM(1,1) model means first differential and one variable, the function of this GM(1,1) model has been widely used. When the number of observations is not large, the original GM(1,1) model will be a powerful forecasting model. However, the traditional grey forecasting model is so simple that the high precision could not be expected (Chen et al., 2008). Therefore, researchers improved GM(1,1) to obtain more accurate forecasting results (Tseng et al., 2001; Hsu, 2003; Yao et al., 2004; Yao et al., 2005; Hsu and Wang, 2007; Chen et al., 2008; Wang and Hsu, 2008; Pai et al., 2009).
Holland (1975) offered the simple genetic algorithm (GA) to estimate problem parameters by using binary coding. Wang and Hsu (2008) improved the GM(1,1) based on GA to forecast Taiwan’s high technology industrial output value. The results show that the forecasting error is less than GM (1,1). Hsu and Wang(2007) used Markov chain Monte Carlo to estimate
the parameters. For grey differential function to forecast the output of integrated circuit industry, Hsu and Chen (2003) improved GM(1,1) by artificial neural network to forecast for power demand. This improved GM(1,1) has more accurate results than the original GM(1,1) and Autoregressive Integrated Moving Average. Huang et al., (2007) proposed a Grey-Markov forecasting model to forecast the electric power supply and demand in China. The Grey-Markov forecasting model appears to be more accurate than GM(1,1).
Differential evolution (DE), proposed by Store and Price, in 1995 using real coding of floating point numbers. The DE’s advantages include its simple idea, ease of use and higher speed of convergence. The DE is an improved version of GA which possesses the faster optimization (Store and Price, 1995). But, Ho et al. (2010) argued that in mutation operation of DE, a perturbed vector was chosen randomly and was not robust enough. Therefore, they used Taguchi method to propose the Taguchi-differential evolution algorithm (TDE) for solving model reduction problem.
The traditional forecasting methods only consider accuracy of the forecasting result. Those methods do not consider the speed of convergence. In the nonlinear business, compare with your competitors, a faster decision making process is extremely important. But, the accurate and fast forecasting method is valuable as well as to research and development difficulties. Therefore, this paper is conducted in order to prove the novel Taguchi-differential evolution algorithm GM(1,1) (TDEGM(1,1)) as a effective method; first, a method using TDE is presented to improve the accuracy of the original GM(1,1) model. The foundations of the foregoing research are grounded on the academic research of Wang and Hsu (2008) to compare forecasting error. Second, although the applications of GM(1,1) are exten-sively applied it has never been used in the investigation of bike industry output of value. Therefore, this study develops the TDEGM(1,1) to forecast bike industry output in Taiwan from 2009 to 2013. The results are expected to offer the companies and government to devise pertinent policies for Taiwan’s bike industry in the future.
NONLINEAR EXPONENTIAL MODEL
In 1982, Deng proposed grey system theory that included the building model, controlling model, GM(1,1), optimization of grey system etc. The grey system has devolved from grey box and black box, namely, color depth shows entire extent of system information. The accumulated generating operation (AGO) method is applied to reduce the randomization of the raw data. These operated data become monotonic increase sequence which complies with the result of first order linear ordinary differential equation. The GM(1,1) is a nonlinear exponential model. The GM(1,1) is
characterized by exceptionally high accuracy of predicted value with only a few data. Therefore, the GM(1,1) has been widely used for the forecasting (Hsu and Chen, 2003; Chang et al., 2005; Hsu and Wang, 2007; Huang et al., 2007;; Wang and Hsu, 2008; Hsu et al., 2009). Firstly, supposing original data are in original series of raw data contains
m
entries as in:(1) where
x
(0) stands for the non-negative original historical time series data.Construct
x
(1) by AGO, which is:(2) Where , ) ( ) ( 1 ) 0 ( ) 1 ( k i i x k x
.
3
2
1
,
,
...,m
k
(3) Secondly, the production of AGO is monotonic increase sequence which is similar to the solution curve of first order linear differential equation. As a result, the solution curve of following differential equation represents the approximation of AGO data.(4) Thirdly, from Equations (2) and (4) and the ordinary least-square method, the coefficient
aˆ
becomes;. Y B B) ( B b a a N T T 1 ˆ (5)
Additionally, where
B
andY
Nare defined as follows;1
)
(
)
1
(
5
.
0
1
)
3
(
)
2
(
5
.
0
1
)
2
(
)
1
(
5
.
0
) 1 ( ) 1 ( ) 1 ( ) 1 ( ) 1 ( ) 1 (n
x
n
x
x
x
x
x
B
;.
)
(
)
4
(
)
3
(
)
2
(
) 0 ( ) 0 ( ) 0 ( ) 0 (n
x
x
x
x
Y
N
(6)Here, both parameters
a
andb
of GM(1,1) model can be obtained by the minimum least square estimation. The original forecasting equation of GM (1,1) is denoted as:Zheng and Chou 4947
(7) where
k
1
,
2
,
3
...,
n
.
When the sequence one-order inverse-accumulated generating operation is obtained, the sequence can be acquired as;.
k
x
k
x
k
x
ˆ
(0)(
1
)
(1)(
1
)
ˆ
(0)(
)
(8)Finally, we give
k
1
,
2
,
3
...,
n
, the sequence of reduction is obtained as;,
)
1
(
ˆ
),...,
1
(
ˆ
),
2
(
ˆ
),
1
(
ˆ
ˆ
(0) (0) (0) (0) (0)n
x
x
x
x
x
(9) whereˆ
(
1
)
) 0 (n
x
is the grey elementary predicting
value of
(
1
)
) 0 (n
x
.IMPROVED GREY GM(1,1) FORECASTING MODEL Improved Grey Gm(1,1) forecasting Model DESCRIBES how to solve the parameter of GM(1,1) by the TDE approach. Storn and Price (1995) first introduced the DE a few years ago. The DE approach was successfully applied to the optimization of some well-known nonlinear, non-differentiable and non-convex functions. The DE approach is a population based and direct parallel search algorithm whose simple, yet powerful and straightforward, features make it very attractive for numerical optimization. The detailed steps of DE approach are as follows. In mutation operation of DE, a perturbed vector was chosen randomly, therefore Ho et al. (2010) propose TDE to solve the problem. The TDE approach is the combined methods of the traditional DE and the Taguchi method. The Taguchi method, a robust design approach, uses many ideas from statistical experimental design for evaluating and implementing improvements in products, processes and equipment. The algorithm of TDE is illustrated to estimates the parameters of
a
andb
of GM(1,1).Population Initialization: Generating a population of real-valued D -dimensional vectors is used by uniform distribution; min max min
X
X
X
X
iG (10) The G iX
defined the thi
population vector that it is grey(0) (0) (0) (0) (0) ( ) (1), (2),..., ( ),.., ( ) , X m x x x k x m (1) (1) (1) (1) (1) ( ) (1), (2),..., ( ),..., ( ) , X m x x x k x m 1 1
.
( ) ( )dx
t
aX
t
b
dt
(0) (0)ˆ (
1)
(1)
b
akb
,
x
k
x
e
a
a
Zheng and Chou 4953
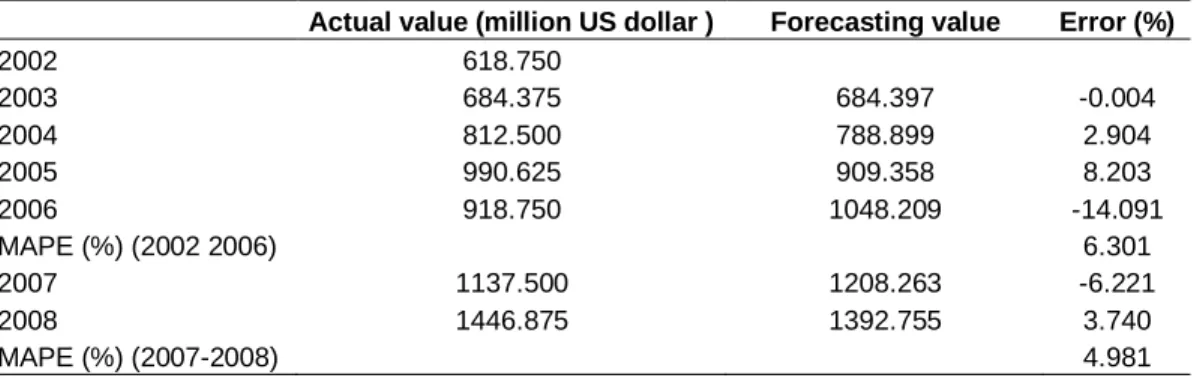
Table 3. Forecasted output value of bike industry and MAPE (billion US dollar).
Actual value (million US dollar ) Forecasting value Error (%)
2002 618.750 2003 684.375 684.397 -0.004 2004 812.500 788.899 2.904 2005 990.625 909.358 8.203 2006 918.750 1048.209 -14.091 MAPE (%) (2002 2006) 6.301 2007 1137.500 1208.263 -6.221 2008 1446.875 1392.755 3.740 MAPE (%) (2007-2008) 4.981
Table 4. Forecasted output value of bike industry 2009 to 2013 (million US dollar). Year Bike 2009 1605.417 2010 1850.552 2011 2133.116 2012 2458.825 2013 2834.268
Table 4, output value of bike will still rise. In the 2013, the bike industry is on target to become the next 2000 million dollar industry. Since the industry of bike has greater growth than other industries, Taiwan companies of bike should provide an adequate number of qualified personnel and adequately advanced technologies to develop the industry of bike. Government must implement suitable policies to help the industry of bike to increase global competitiveness in international market in the future.
Conclusions
This paper presents the Taguchi-differential evolution algorithm GM(1,1) to optimize parameters of the grey model (GM(1,1)) method to improve the accuracy and convergent speed of prediction for the output value of both IC and bike industries. The results demonstrate that the MAPE of the forecasting model is lower than 10%. This paper proposed that the TDEGM(1,1) is an appropriate forecasting method to yield more accuracy and convergent speed result than the original GM(1,1) model, BGM (1,1) and GAGM(1,1) in the IC industry. Therefore, we conclude that the TDEGM(1,1) significantly enhances the precision of the GM(1,1). In the bike case, the testing mean absolute percentage error (MAPE) of 2007-2008 is 4.981 which is an excellent result based on the definition of MAPE. In the 2013, the output value of bike may be up to US $2834.268 million according to
the forecasting result.
In the near future, the bike is getting more popular as a leisure activity and an environmental transportation tool. Many cities around the globe have forbidden the use of motorcycles. The growth rates of the bike industry will surpass those of other transportation industries. Therefore, government must implement favorable policies to help the bike industry remain global competitiveness for high-end bike production. This paper used only the output value to forecast. In order to increase the TDEGM(1,1) accuracy of forecast, the future research should consider multi-factor such as the capital productivity, labor productivity and investment of research and development.
Future studies may apply the TDEGM(1,1) to forecast performance of different high-tech industries such as digital and electronic paper industries so as to increase the competitive edge of Taiwan in the coming future.
ACKNOWLEDGEMENT
This work was in part supported by the National Science Council, Taiwan, Republic of China, under Grant NSC 99-2221-E-151-071-MY3.
REFERENCES
Chen CI, Hsin PH, Wu CS (2010). Forecasting Taiwan's major stock indices by the Nash nonlinear grey Bernoulli model. Expert Syst. Appl., 37(12): 7557-7562.
4954 Afr. J. Bus. Manage.
Chang SC, Lai HC, Yu HC (2005). A variable P value rolling grey forecasting model for Taiwan semiconductor industry production. Technol. Forecast. Soc. Chang., 72(5): 623-640.
Chen CI, Chen HL, Chen SP (2008). Forecasting of foreign exchange rates of Taiwan’s major trading partners by novel nonlinear grey Bernoulli model NGBM(1,1), Commun. Nonlinear Sci. Num. Sim., 13(6): 1194-1204.
Deng JL (1982). Control problems of grey systems, Syst. Control Lett., 5. 288-294.
Dolgui A, Pashkevich M (2008). Demand forecasting for multiple slow- moving items with short requests history and unequal demand variance. Int. J. Prod. Econ., 112(2): 885-894.
Gutierrez RS, Solis AO, Mukhopadhyay S (2008). Lumpy demand forecasting using neural networks. Int. J. Prod Econ., 111(2): 409-420.
Holland JH (1975). Adaption in Natural and Artificial Systems, Ann Arbor. The University of Michigan Press.
Hsu LC (2010). Genetic algorithm based nonlinear grey Bernoulli model for output forecasting in integrated circuit industry. Expert Syst. Appl., 37(6): 4318-4323.
Hsu LC (2009). Forecasting the output of integrated circuit industry using genetic algorithm based multivariable grey optimization models. Expert Syst. Appl., 36(4): 7898-7903.
Hsu PH, Wang CH, Shyu JZ, Yu HC (2003). A Litterman BVAR approach for production forecasting of technology industries. Technol. Forecast. Soc. Chang., 70(1): 67-82.
Hsu LC (2003). Applying the grey prediction model to the global integrated circuit industry. Technol. Forecast. Soc. Chang., 70(6): 563-574.
Hsu CC, Chen CY (2003). Applications of improved grey prediction model power demand forecasting. Energy Convers. Manage., 44(14): 2241-2249.
Huang M, He Y, Cen H (2007). Predictive analysis on electric-power supply and demand in China. Renewable Energy, 32(7): 1165-1174. Hsu LC, Wang CH (2007). Forecasting the output of integrated circuit
industry using a grey model improved by the Bayesian analysis. Technol. Forecast. Soc. Chang., 74(6): 843-853.
Ho WH, Chou JH, Guo CY (2010). Parameter identification of chaotic systems using improved differential evolution algorithm. Nonlinear Dyn., 61(1): 29-41.
Hsu YT, Liu MC, Yeh JR, Hung HF (2009). Forecasting the turning time of stock market based on Markov-Fourier grey model. Expert Syst. Appl., 36(4): 8597-8603.
Lee YS, Tong LI (2011). Forecasting energy consumption using a grey model improved by incorporating genetic programming. Energy Convers. Manage., 52(1): 147-152.
Lewis C (1982). Industrial and Business Forecasting Methods, Butterworth Scientific, London.
Lin CT, Yang SY (2003). Forecast of the output value of Taiwan's opto-electronics industry using the grey forecasting model. Technol. Forecast. Soc. Chang., 70(2): 177-186.
Liu P (2009). Bicycles: One Industry Still in High Gear. http://www.amcham.com.tw/content/view/2672/421/. 39(2).
Pai PF, Yang SL, Chang PT (2009). Forecasting output of integrated circuit industry by support vector regression models with marriage honey-bees optimization algorithms. Expert Syst. Appl., 36(7): 10746-10751.
Storn R, Price K (1995). Differential Evolution: A simple and efficient adaptive scheme for global optimization over continuous spaces, Technical Report TR-95-012, International Computer Science Institute, Berkeley.
Stevenson WJ (1999). Production Operations Management, Sixth Edition. New York: McGraw-Hill.
Tseng FM, Yu HC, Tzeng GH (2001). Applied hybrid grey model to forecast seasonal time series. Technol. Forecast. Soc. Chang., 67(2-3): 291-302.
Wang CH, Hsu LC (2008). Using genetic algorithms grey theory to forecast high technology industrial output. Appl. Math. Comp., 195(1): 256-263.
Yao AWL, Chi SC (2004). Analysis and design of a taguchi-grey based electricity demand predictor for energy management systems. Energy Convers. Manage., 45(7-8): 1205-1217.
Yao AWL, Chi SC, Chen CK (2005). Development of an integrated grey-fuzzy-based electricity management system for enterprises. Energy, 30(15): 2759-2771.
Zhang X (2004). The impact of forecasting methods on the bullwhip effect. Int. J Prod. Econ., 88(1): 15-27.