行政院國家科學委員會專題研究計畫 成果報告
學障學童的視覺空間注意力圖形化之研究
計畫類別: 個別型計畫 計畫編號: NSC93-2614-S-151-001- 執行期間: 93 年 08 月 01 日至 94 年 07 月 31 日 執行單位: 國立高雄應用科技大學資訊管理系 計畫主持人: 黃河銓 共同主持人: 黃秀霜,汪翠瀅 報告類型: 精簡報告 處理方式: 本計畫可公開查詢中 華 民 國 94 年 10 月 19 日
A Study of Visuospatial Attentional Patterns for School Children with
Learning Difficulties
Ho-Chuan Huang
Dept. of Information Management, National Kaohsiung University of
Applied Sciences, [email protected]
Tsui-Ying Wang Dept. of Occupational Therapy, National Cheng Kung University,
Hsiu-Shuang, Huang Department of Education, National University of Tainan,
Abstract
The purpose of this research is to propose a graphical analysis interface approach to enhancing data representation of the visuospatial attentional test. The approach described here is used to evaluate and report the performance of visuospatial attention and the location of the geographic center of all attention stimuli. We have built a visual attentional assessment system, based on a cancellation test, for on-line administration to understand the functions of visuospatial attention in school children with learning difficulties and to offer a more sensitive measure of visual attentional performance. Our system can monitor the trace of visual search paths and visual attention, as well as represent the location of geographic center of all attention stimuli. 58 school children have taken part in the experiment. The result shows that more than 45 percent of participants (51.72%, structured; 41.38%, random) located their visual attentional center at the page center. In addition, more than 59 percent of participants (67.24%, structured; 51.72%, random) located their initial search in the second quadrant.
Keywords: Visuospatial Attentional Pattern, Computerized Assessment, Cancellation Test
1. Introduction
Children experience difficulties in learning may have minor dysfunction in attention or information processing. Intact attention is a necessary function for mental operation and learning (Lezak, 1987). Therefore, an attentional assessment is a necessary procedure for understanding school children if intact attention is or not. A cognitive assessment procedure typically consists of a set of stimuli to which the subjects make a motor response. Individual response is recorded as raw data and later manipulated to provide test scores. The traditional administration and scoring process of paper-and-pencil test has some disadvantages, such as bias, inaccuracy, and time-consuming, etc. (Denner, 1977; Goldstein, 1987). In addition, data obtained from
the operation progress. With the development of computer technologies, the creation of computerized testing systems for the structured and repeated assessment is recognized as of great potential in the related fields (Esgate, 1995; Goldstein, 1987).
Over the past few years, a variety of formats of cancellation tasks have been used for the performance of visual attention and visuospatial function in individuals. These variations use different stimuli such as bells (Gauthier, Dehaut & Joanette, 1989), stars (Wilson, Cockburn & Halligan, 1987a, b), numbers (Friedman, 1992; Halligan, Burn, Marshall & Wade, 1992), letters (Mesulam, 1985; Weintraub & Mesulam, 1985, 1988) or Chinese characters (Chen-Sea, Cermak & Henderson, 1993). The subjects are required to mark out the target that is scattered randomly throughout a structured or random array, meanwhile, withstanding distraction by false stimuli. Success is determined by the number and distribution of omissions, number of commissions, and completion time. Random error throughout the paper may indicate deficits in attentional process. Responses scattering disproportionately or only to one side of the paper may indicate visuospatial inattention problem or hemineglect (Lezak, 1987).
The main purpose of this research is to propose a visualized analysis interface and the architecture for the visuospatial attentional system and to demonstrate that with the computer-assisted testing, it becomes possible to break free from some of the limitations of conventional tests and to incorporate an experimental approach to the understanding of individual difference in visual processing and scanning pattern. The application of computer technologies allows the domain administrators to obtain more detailed information of an individual’s attentional performance on the visuospatial task.
2. Visuospatial Search Patterns
Performance on cancellation task also gives information about how people attend to and explore the external environment (Cermak & Lin, 1999). The examiner records the sequence of the cancellation task that the examinee does on the answer sheet. The answering path would represent the visual search patterns that one used to locate the target. Normative data on the test performance are necessary for comparison and to draw reliable conclusion with the performance of the experimental subjects.
Existing literature suggested different findings about visual scanning pattern. Abed (1991) investigated eye movement with subjects in different culture background, and found that East Asian subjects used more vertical than horizontal movements comparing with American or Middle Eastern subjects, while Sun, Morita and Stark (1985) argued that the eye movement pattern for reading Chinese was very similar to that of reading English. Dawson and Tanner-Cohen (1997) reported their study in China, that most (about 90%) subjects started symbol searching tasks from left, and subjects scan horizontally (45-58%) more often than vertically (14-18%). They also suggested that there were more variation in the scanning patterns of normal control Chinese subjects than that of normal Western subjects. Indeed, we need further
research in the Chinese group regarding visual scanning pattern. With the advances of computer technology, we recorded the performance and detailed information of the computer-assisted assessment that permitted us not only to understand the normal pattern of visual scanning strategy among subjects, but also to discover the correlation between strategy and performance (Huang, Wang, Chang & Huang, 2002; Wang, Huang & Huang, 2003).
3. System Architecture
Visuospatial attention tracing assessment system (VATAS) is a proceeding project of the project, computer-assisted cancellation test system (CACTS), that is a system providing users with the computerized performance assessment of the visuospatial attention. The architecture of CACTS is on an IBM-compatible PC running the Microsoft Windows XP operating system and connected to a 9" ×12" graphic tablet with a cordless digital stylus for data input. CACTS is programmed and ready to display on the graphic tablet's LCD touch-screen as "digital paper" and receive the writing signal from the stylus. VATAS is a system that provides users with graphical demonstration of visuospatial attention and neglects. The platform of VATAS has shift from the Microsoft Windows XP environment to the Windows XP Tablet PC environment. VATAS, employing similar hardware architecture to CACTS, can also receive a writing signal from a digital stylus. The stylus movement made by the participant is captured by the system as a stream of time-stamped x- and y- coordinates. The coordinate data of each movement mark over the test screen are recorded as "response" data for each trial. Measures corresponding either to the "static" feature of the outlay or to the kinematic data related to temporal-spatial characteristics can be extracted. Test data are simultaneously recorded in the database when the participant proceeds to the trial. Therefore, the participant experiences the computer version of the cancellation tasks as not significantly different from the original paper-and-pencil test.
The architecture of VATAS (Figure 1) consists of four modules: a graphical interface module, a user profile module, a test module, and an outcome-analysis module. VATAS provides instructors with an interface module for supporting on-line and off-line data/graphic display and printing. Instructors can preview every participant's profile, test results, and relevant visual search pattern information and then select the desired item to display or print. The profile module collects a participant's demographic data (such as ID, name, age, sex, educational level, and so on) to analyze the relation between the participant's profile and test results. The test module is currently composed of four types of stimuli, each form with both random and structured arrays. The outcome analysis module provides instructors with a graphical analysis tool for recording and evaluating the test result of the participants.
4. System Design and Implementation
Many task characteristics have different effects on visual search performance and strategies. These task characteristics include stimulus size (small or big size), space among stimuli, stimulus types (numbers, letters, or symbol), stimulus layouts (random or structured arrays), and sizes of the matrix (numbers of rows and columns). To simplify the experimental design and procedure, two main characteristics (stimulus layouts and stimulus types) were used to analyze the visual search behavior of our participants. In this study, the stimulus layouts include structured array and random array. For the structured array, the spacing of any two adjacent stimuli in a row or column was equivalent; for the random array, the spacing of any two adjacent stimuli varied. Four types of stimuli (numerical, alphabetical, symbolic, and Chinese characters) were built in the system. Symbol form consists of 52 different symbolic figures such as"☼" and "●", and the Chinese form is composed of traditional Chinese radicals, such as "日" and "工".
We classify collected data into demographic data and outcome data. The demographic data include participants’ identity, name, age, gender, learning status (normal, ADD/ADHD, or LD), education, and so on. The outcome data contains static performance that test performance is monitored by our system to record the following: the time and location of the initial response, the visual scanning path (collections of line sequence from one coordinate to the next) from initiation to task completion, the time and shift spent from one stimulus to the next (pre-movement, movement, and marking), and the total time and response dispersed on left and right hemispace.
Both demographic data and outcome data were collected. Demographic data were derived from the user profile; outcome data were further classified into static and kinematic data. Static data contain information about the participant's test performance, such as the number of correct or error responses, and total completion time. Kinematic data, collected during test administration, contain response locations, distance between any two consecutive responses, movement time between consecutive response locations, and pause time between any consecutive responses. The stimulus layout is partitioned into four quadrants based on the Cartesian coordinate system to collect temporal data for the visual search process. In addition, VATAS can monitor and record specific information for every response in each quadrant, such as response time, location, and accuracy of each response. The visual search pattern for each trial (collections of line sequences from one coordinate to the next) is recorded from task initiation to task completion. It is necessary to have the distance for each pair of two consecutive responses i and j, and then total displacement of the visual search path can be computed. We used the Euclidean distance to calculate the value. The Euclidean distance corresponds to the true geometrical distance between the points with coordinates (xi, yi) and (xj, yj). We also normalized distance values between two
responses into International Standard Units—centimeters—because that made it easier to interpret the distances in the visual search path. The purpose of calculating the distances in the visual search is to analyze the correlation between the distance of the visual search path and the visual search pattern.
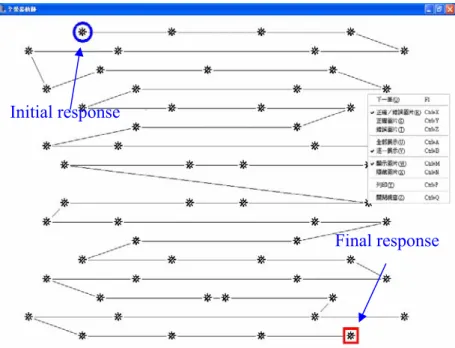
VATAS can also record total completion time, pause time, and total movement time. Total completion time is calculated according to the activity of each participant from the first to last responses during the test. Pause time is defined as the time allocated for the preparatory process, i.e., the time spent marking on the stimuli with the pen. Movement time is defined as the time between two consecutive responses. VATAS has been implemented in Borland C++ on the window-based platform. We developed four different versions including symbol, Chinese character, alphabet, and number cancellation versions in the system. Each version of cancellation tasks contains two forms: random and structured arrays. Each test result is recorded in the Mircorsoft© Access database. We normalized the database into four tables including user profiles and test data. User tables contain the columns users ID, name, gender, birth date, education, and so on. Test tables contains the columns total time, correct, error, total response, performance, correct on the left, error on the left, total on the left, correct on the right, error on the right, total on the right, starting point on the quadrant, stay time on the left, stay time on the right, pause time, and so on. A screenshot of a visual attention tracing path by a subject is shown in Figure 2 (structured, and symbol testing mode). Unbiased and biased visual attentional centers of participants are shown in Figures 3 and 4, respectively.
5. Materials and methods
5.1 Participants
58 participants (mean age = 10.91 years; 37 boys, 21 girls) participated in the experiment in Taiwan. Participants are divided into two groups, normal group and learning difficulties group; each group has 29 participants. Every participant was told and confirmed that he/she understood the procedure of the experiment before starting the test.
5.2 Stimuli
Each type of cancellation arrays consists of 60 targets, distributed with an equal number of targets in each quadrant of the screen field oriented horizontally (i.e., 15 targets in each quadrant) and 314 distractors scattered on the screen (totally 374 stimuli). Every stimuli was coded by its x and y axis coordinate, oriented to the center of the array. Thus a target in the top right of the array would have positive x and y coordinates, whereas a target in the bottom left would have negative x and y coordinates.
Four types of stimulus materials (numerical, alphabetical, symbolic, and Chinese characters) were constructed in the system, but only the symbol form was used in this study. Symbol form consists of 52 different symbolic figures such as"☼" and "●". It is obvious that many features (e.g., participant groups, stimulus materials, stimulus layouts, and set sizes) have different effects on visual search performance and strategies. In addition, cancellation tests are also sensitive to
the influence of individual demographic features such as gender, education, age, and cultural background. To simplify the experimental design and procedure, and find out the performance of visual attentional center, this experiment employed a single stimulus form with two different stimulus layouts (structural array and random array) during the trial. For the structured array, the spacing of any two adjacent stimuli in a row or column was equivalent, but for the random array, the spacing of any two adjacent stimuli varied.
5.3 Instrumentations and procedures
Each participant was presented with 2 different cancellation arrays, structured and random arrays. Each response on the array was coded individually. Participants were seated upright in straight-backed chairs with their midsagittal planes aligned with the display monitor. Stimuli were viewed from the 30-40 cm distance from their trunk in the radial axis. They were asked to mark all the targets with a stylus. The target on the symbol form was " ". Participants were asked to search for the targets on the test screen as quickly as possible without time restrictions and they were free to move their head or eyes. An individual trial was considered complete when the participants that they had finished canceling all the targets. Normally, each trial took less than 5 minutes to complete (depending on the capabilities of participants) and each participant should be able to finish all two trials within 10 minutes. Before the trial, each participant was given detailed instructions and procedures until they felt ready for the trial. The procedure of the experiment and the recording process were as follows:
1. The participant's individual profile, such as name, age, sex, educational level, and so on, was input into the system, and then the test form and mode were selected.
2. The test screen was placed at a 15-degree tilt 40 cm from the edge of the table in front of the participant. To become familiar with the instrument, the participant used the stylus to practice an example shown in a small window in the middle of the screen.
3. The test was given after the participant felt comfortable with the testing situation. During each trial, the participants were required to cross out all the targets they could find as quickly as possible without sacrificing accuracy, but there was no time limit for task completion.
4. When any participant thought they had finished the trial task, they would press any key on the keyboard to terminate the trial.
5. The next trial was then selected and the same steps followed until all trials were completed.
6. Results and discussion
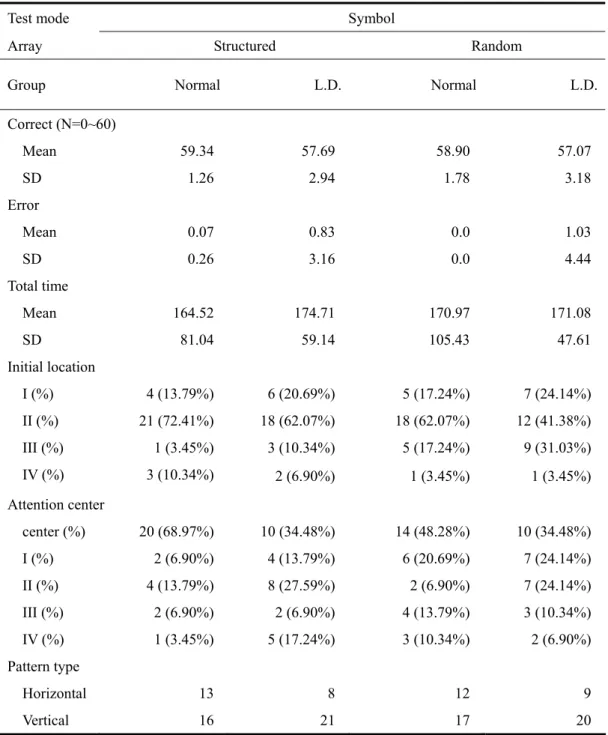
The trial continued a couple of weeks for completing the experiment. Table 1 shows a brief summary of the test result in the symbol mode. The result shows that the performance of the test result (e.g., correct/error responses, and total complete time) on the normal group is better than
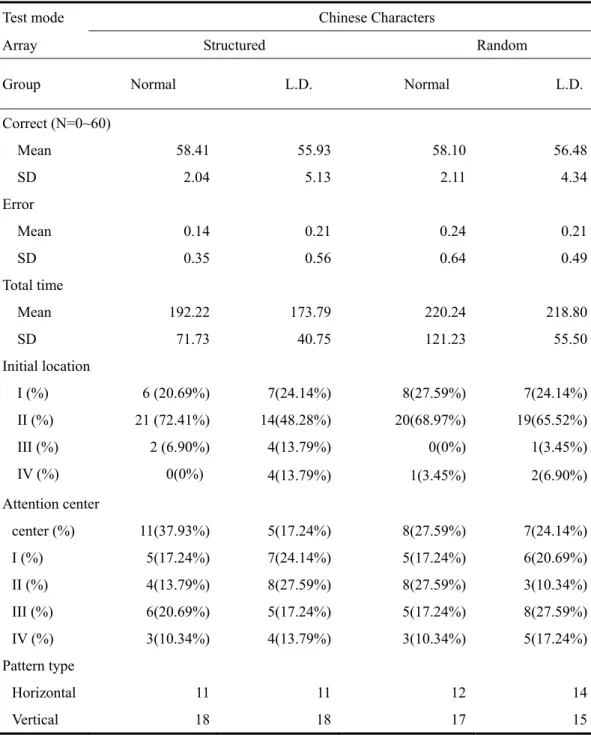
that of the L.D. group. The means of correct responses on the structured and random array are 59.34 and 58.90 for the normal group, respectively; the means of their error responses on both arrays are 1.26 and 1.78, respectively. The result also shows that the means of correct responses on the structured and random array are 57.69 and 57.07 for the L.D. group, respectively; the means of their error responses on both arrays are 2.94 and 3.18, respectively. Table 2 shows a brief summary of the test result in the Chinese character mode. The result illustrates that the means of correct responses on the structured and random array are 58.41 and 58.10 for the normal group, respectively; the means of their error responses on both arrays are 2.04 and 2.11, respectively. The result also shows that the means of correct responses on the structured and random array are 55.93 and 56.48 for the L.D. group, respectively; the means of their error responses on both arrays are 5.13 and 4.34, respectively.
For visual attentional issues, the test result in the symbol mode showed that more than 45 percent of participants (51.72%, structured; 41.38%, random) located their visual attentional center at the page center. However, the test result in the Chinese character mode showed that more than 26 percent of participants (27.59%, structured; 25.86%, random) located their visual attentional center at the page center. This result explained that the Chinese character mode is more difficult than the symbol mode for school children to concentrate their attention and the random array is also more difficult than the structured array for school children to concentrate their attention. In addition, more than 52 percent of participants (67.24%, structured; 51.72%, random) located their initial search in the second quadrant for symbol mode and more than 63 percent of participants (60.34%, structured; 67.24%, random) located their initial search in the second quadrant in the Chinese character mode.
Finally, another interesting outcome of the visual search pattern in this experiment was found that more than 62 percent of participants use the vertical scanning manner to search for their targets that is similar to the reading manner the traditional manner of Chinese reading (from top to down). This result also inspired us to be keen on knowing if the behavior of participants’ visual search could be affected by the alteration of their reading habits or by the alteration of the stimuli layout or stimuli material. We will carry on this study for this issue in different populations.
7. Conclusions
VATAS was developed with four forms with structured and random arrays for the investigation of visual search patterns in school children. Computer recording of standard tests becomes a trend for the advantage of time-saving, less biased, more precise, more storage capacity and efficient processing. In this research, we propose the architecture for a visualized attention tracing system for the purpose of understanding visual scanning pattern investigation. The test result is recorded in the Microsoft Access database that contains user profiles and test data. The computation by our system could offer a preliminary normative data of visual scanning
path in, which may have implication for the understanding of culture influence on reading habit, comparison with other different country using different test modes. In the future, we will continue to study the performance of visual attention tracing and visual neglect problems and try to compare their performance to further examine our findings and the validity of our assessment.
8. References
Abed, F. (1991). Cultural influences on visual scanning patterns. Journal of Cross-Cultural
Psychology, 22, 525-534.
Cermak, S. A., & Lin, K.C. (1999). Assessment of perceptual dysfunction in the adult, In J. V. Deusen & D. Brunt (Eds.), Assessment in occupational therapy and physical therapy (pp. 302-332), Philadelphia: W. B. Saunders Company.
Chen-Sea, M. J., & Henderson, A. (1994). The reliability and validity of visuospatial inattention tests with stroke patients. Occupational Therapy International, 1, 36-48.
Dawson, D.R., & Tanner-Cohen, C. (1997). Visual scanning patterns in an adult Chinese: Preliminary normative data. The Occupational Journal of Research, 17, 264-279.
Denner, S. (1977). Automated Psychological Testing: a review. British Journal of Clinical
Psychology, 6, 175-179.
Esgate, A. (1995). The use of information technology in psychiatric assement, British Journal of Occupational Therapy, 58 (5), 197-200.
Friedman, P.J. (1992). The star cancellation test in acute stroke. Clinical Rehabilitation, 6, 23-30. Gauthier, L., Dehaut, F., & Joanette, Y. (1989). The bells test: A quantitative and qualitative test
for visual neglect. International Journal of Clinical Neurosychology, 11, 49-54.
Goldstein, G. (1987). Neuropsychological assessment for rehabilitation: fixed batteries, automated systems, and non-psychometric methods. In M. J. Meier, A. L. Benton, &L. Diller (Eds.), Neurological Rehabilitation (pp.18-40), New York: Guilford Press.
Halligan, P.W., Burn, J.P., Marshall, J.C., & Wade, D.T. (1992). Visual neglect: qualitative difference and laterality of cerebral lesion. Journal of Neurology, Neurosurgery, and
Psychiatry, 55, 1060-1068.
Huang, H.C., Wang, T.Y., Chang, C.L., & Huang, H.S. (2002). Performance of computerized visuospatial assessment for school children, 2002 Computer and Network Technology in
Education Workshop, 189-192.
Lezak, M. D. (1987). Assessment in rehabilitation planning. In M. J. Meier., A. L. Benton, & L. Diller (Eds.), Neurological Rehabilitation (pp.41-58). New York, Guilford Press.
Mesulam, M-M (1985). Attention, confusional state, and attention. In Mesulam, M-M (Ed.),
Principles of behavioral neurology. Philadelphia: F. A. Davis Company.
Sun, F., Morita, M., & Stark, L. (1985). Comparative patterns of reading eye movement in Chinese and English. Perception and Psychophysics, 37, 502-506.
Wang, T.Y., Huang, H.C., & Huang, H.S. (2003), A Study of Visual Scanning Pattern in School Children, 11th 2003 International Conference on Computer-Assisted Instruction / 16th International Conference on Computers in Education (pp. 24-26), April 2003, Taipei, Taiwan. Weintraub, S., & Mesulam, M.M. (1985). Mental state assessment of young and elderly adults in
behavioral neurology. In M-M. Mesulam (Ed.), Principles of behavioral neurology (pp. 71-123). Philadelphia, PA: F.A. Davis.
Weintraub, S., & Musulam, M.-M. (1988). Visual hemisphere inattention: stimulus parameters and exploratory strategies. Journal of Neurology, Neurosurgery, and Psychiatry, 51, 1481-1488.
Wilson, B., Cockburn, J., & Halligan, P. (1987a). Development of a behavioural test of visuospatial neglect. Archives of Physical Medicine and Rehabilitation, 68, 98-102.
Wilson, B., Cockburn, J., & Halligan, P. (1987b). Behavioural Inattention Test. Tichfield, UK: Thames Valley Test Co.
Figure 1. System architecture
Databases
Graphical Interface Module
Users Administrator
Outcome and Analysis Module
Attention Patterns Data Analysis Data Output User Profiles Testing Result User Module Form Modes Array Modes Test Module
Figure 2. A visual search pattern
Final response Initial response
Figure 3. A attentional center (0,0)
A unbiased attentional center of one participant
Figure 4. A biased attentional center A directional and biased attentional center of one participant
Table 1. Test Result of the Symbol Mode
Test mode Symbol
Array Structured Random
Group Normal L.D. Normal L.D.
Correct (N=0~60) Mean 59.34 57.69 58.90 57.07 SD 1.26 2.94 1.78 3.18 Error Mean 0.07 0.83 0.0 1.03 SD 0.26 3.16 0.0 4.44 Total time Mean 164.52 174.71 170.97 171.08 SD 81.04 59.14 105.43 47.61 Initial location I (%) 4 (13.79%) 6 (20.69%) 5 (17.24%) 7 (24.14%) II (%) 21 (72.41%) 18 (62.07%) 18 (62.07%) 12 (41.38%) III (%) 1 (3.45%) 3 (10.34%) 5 (17.24%) 9 (31.03%) IV (%) 3 (10.34%) 2 (6.90%) 1 (3.45%) 1 (3.45%) Attention center center (%) 20 (68.97%) 10 (34.48%) 14 (48.28%) 10 (34.48%) I (%) 2 (6.90%) 4 (13.79%) 6 (20.69%) 7 (24.14%) II (%) 4 (13.79%) 8 (27.59%) 2 (6.90%) 7 (24.14%) III (%) 2 (6.90%) 2 (6.90%) 4 (13.79%) 3 (10.34%) IV (%) 1 (3.45%) 5 (17.24%) 3 (10.34%) 2 (6.90%) Pattern type Horizontal 13 8 12 9 Vertical 16 21 17 20
Table 2. Test Result of Chinese Character Mode
Test mode Chinese Characters
Array Structured Random
Group Normal L.D. Normal L.D.
Correct (N=0~60) Mean 58.41 55.93 58.10 56.48 SD 2.04 5.13 2.11 4.34 Error Mean 0.14 0.21 0.24 0.21 SD 0.35 0.56 0.64 0.49 Total time Mean 192.22 173.79 220.24 218.80 SD 71.73 40.75 121.23 55.50 Initial location I (%) 6 (20.69%) 7(24.14%) 8(27.59%) 7(24.14%) II (%) 21 (72.41%) 14(48.28%) 20(68.97%) 19(65.52%) III (%) 2 (6.90%) 4(13.79%) 0(0%) 1(3.45%) IV (%) 0(0%) 4(13.79%) 1(3.45%) 2(6.90%) Attention center center (%) 11(37.93%) 5(17.24%) 8(27.59%) 7(24.14%) I (%) 5(17.24%) 7(24.14%) 5(17.24%) 6(20.69%) II (%) 4(13.79%) 8(27.59%) 8(27.59%) 3(10.34%) III (%) 6(20.69%) 5(17.24%) 5(17.24%) 8(27.59%) IV (%) 3(10.34%) 4(13.79%) 3(10.34%) 5(17.24%) Pattern type Horizontal 11 11 12 14 Vertical 18 18 17 15