J O U R N A L O F M A T E R I A L S S C I E N C E 26 ( 1 9 9 I ) 6 0 9 7 - 6 1 0 3
Long-term oxidation behaviour of Ni3AI alloys
with and without chromium additions
Y. C. PAN, T. H. C H U A N G
Institute of Materials Engineering, National Taiwan University, Taipei, Taiwan 10764
Y. D. YAO
Institute of Physics, Academia Sinica, Taipei, 11529 Taiwan
The oxidation behaviour of Ni3AI alloys with and without chromium additions was studied
after long-term exposure in an air furnace over a wide temperature range from 560-1300 ~
The chromium-containing alloy exhibited a better oxidation resistance below 11 50 ~ Above
this temperature the penetration depth of oxides into and along the grain boundaries in the
chromium-containing alloy became larger than that in the alloy without chromium. Also the
penetration depth increased drastically at 11 50 ~ for both alloys. Through energy dispersive
X-ray spectroscopy, X-ray diffraction and X-ray photoelectron spectroscopy analyses, the
compositions and structures of the oxide scales for both alloys were also identified.
1. I n t r o d u c t i o n
Since the successful improvement of its ductility by trace additions of boron [1], the Ni3A1 intermetallic compound has become a potentially useful structural material. Properties, such as high melting point and high strength at eleVated temperature with a positive temperature dependence of strength up to about 780 ~ make the alloy attractive for high-temperature applications [2]. Also, because Ni3A1 has the advant- ages of lower density and lower cost for raw materials compared to commercial superalloys, it is a promising substitute for them. However, to develop this alloy for high-temperature applications, its oxidation resistance must be considered.
To date very few works dealing with the oxidation behaviour of Ni3A1 intermetallic compounds have been reported. Kuenzly and Douglass [3] showed that oxide scales formed on Ni3A1 after oxidation in air at temperatures between 900 and 1200 ~ possessed the layered structure NiO/NiA1204/~-A120 3. Taniguchi and Shibata [4] studied the effect of the alloying elements titanium, zirconium and hafnium on the cyclic oxidation behaviour of Ni3A1-0.1B alloy in purified oxygen for temperatures cycled between 400 and 1300 K. Their results indicated that zirconium and hafnium were effective in forming a very adherent oxide scale. A similar beneficial effect of zirconium and hafnium was found by Taniguchi and Shibata [5] for the isothermal oxidation behaviour of this alloy in purified oxygen over a temperature range from 1027-1227~ In the development of Ni3A1 inter- metallic alloys zirconium and hafnium have been added to improve their high-temperature strength and creep resistance [6, 7]. Their effect on the oxidation behaviour of this alloy seems to be an additional desirable benefit.
The effect of boron additions on the oxidation
behaviour of Ni3A1 was also discussed by Taniguchi and Shibata [4, 5], They showed that for both cyclic and isothermal oxidation tests the beneficial effect of boron additions on the oxidation resistance was very limited. The well-known effect of boron in preventing oxygen penetration along grain boundaries of nickel- base superalloys reported by Woodford [8] and Bricknell [9] was not observed for the Ni3A1 inter- metallic compound.
Because the addition of chromium to alloys has often been employed to improve their oxidation and corrosion resistance, its beneficial effect on the oxida- tion behaviour of Ni3A1 intermetallic compounds might be anticipated. However, Taniguchi and Shibata [10] have studied the cyclic and isothermal oxidation behaviour of an Ni3AI-O.1B alloy con- taining 2 wt % Cr, and their results showed that the chromium addition did not significantly change the oxidation behaviour of this alloy. The significant fea- ture of scale blistering corresponding to the break- away oxidation at 1027 and 1127~ was also re- ported. However, in a work by Liu and Sikka [11] chromium additions of more than 8 at % to boron- doped Ni3A1 alloys have been found to alleviate the dynamic intergranular embrittlement observed to oc- cur in these alloys during tensile tests in air at 600 ~ They proposed an explanation postulating that chromium additions provide a better oxide scale dur- ing high-temperature exposure in air and that these oxide layers prevent the formation and propagation of cracks along grain boundaries. In order to verify this explanation, Horton et al. [12] studied the early stages of oxidation of Ni3A1 alloys with and without chromium additions at 600 ~ Although the results did not provide direct evidence for the above explana- tion, they did describe the structures of the oxide scales and illustrated the oxidation process during the
initial stages of oxidation in these alloys. They also showed that the oxidation rate of the alloy containing chromium decreased rapidly with time and was very small, while the oxide layer on the chromium-free alloy continued to grow after 30 min. However, the above results cannot assure the resistance of this chromium-containing Ni3A1 alloy for long-term oxi- dation at higher temperatures, which are required for the employment of this alloy in engineering appli- cations. For this purpose, the present study of the oxidation behaviour of Ni3A1 alloys with and without chromium after a long-term exposure in air over a wide temperature range from 560-1300~ was per- formed.
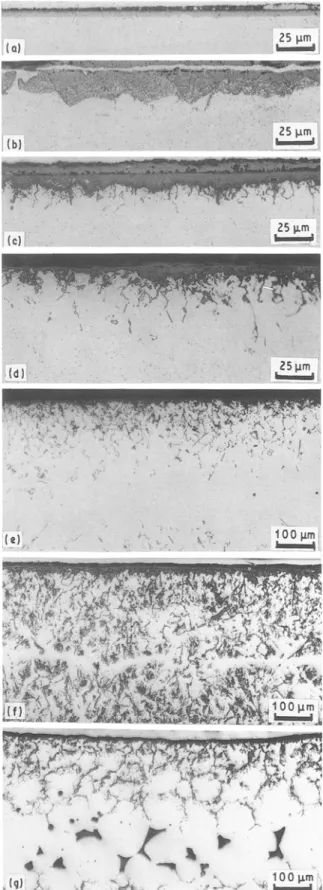
Cross-sections of oxidized specimens of Alloys A a n d B are shown in Figs 1 and 2, respectively, in which (a) to (g) correspond to different oxidizing temper- atures ranging from 560-1300 ~ It can be seen that a continuous oxide film formed on the outer surface at all temperatures. In addition, as the oxidizing temper- ature was raised, the oxidation products penetrated
2.
Experimental procedure
One Ni3A1 alloy with the composition
NiTsA121ZrlBo. 2 (Alloy A) and another containing
additional chromium with the composition
Ni73AllsCrsZrlB0. 2 (Alloy B) were used. The alloys were prepared from nickel and aluminium of purity 99.9%, and Ni-B and Ni-Zr master alloys by melting in a vacuum-induction furnace and casting into an iron mould to produce ingots 2 5 m m x 100mm x 80 mm. Chemical analysis showed that the oxygen and carbon contents in these alloys were below 70 wt p.p.m, and the residual hydrogen content was less than 10 wt p.p.m. The ingots were cut and thermo- mechanically treated repeatedly by cold rolling
(20%-50%) and annealing (1150~ and
1000~ h). After thermomechanical treatment, the billets had a final thickness of 1.2 mm and possess equiaxed grains with a grain size of about 20 ~tm. The microstructure was shown to be single-phase 7, which has theordered L12 crystal structure. The billets were then sliced with a diamond saw into small specimens, 10 m m • 20 mm, for oxidation tests.
All specimens were polished to 1200 grit and ultra- sonically cleaned with acetone. The oxidation tests were conducted in air at various temperatures be- tween 560 and 1300~ with exigosures ranging from 80 rain to 492 h. The oxidized specimens, especially their cross-sections, were observed by optical and scanning electron microscopy. The compositions of the oxide scale were analysed by X-ray diffraction (XRD) and energy dispersive X-ray microanalysis (EDS) in an SEM. Also X-ray photoelectron spectro- scopy (XPS) was employed to examine the outermost surface of the oxide scale.
3. Results and discussion
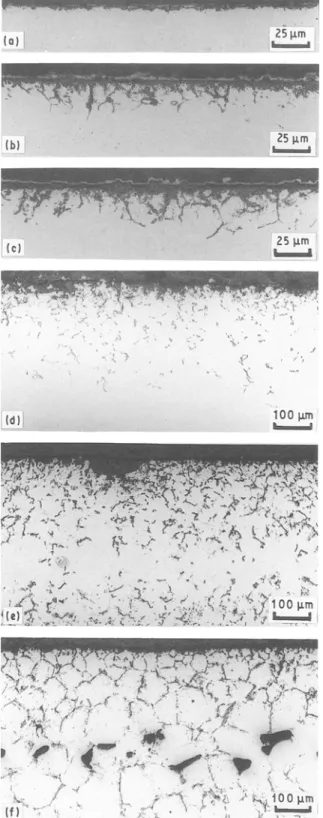
After 492 h air exposure at the lower oxidation tem- peratures (560 and 750 ~ Alloy A became dark grey while the chromium-containing Alloy B remained bright and shiny. At higher temperatures above 1200 ~ however, the oxidized scale on Alloy B was severely spalled from the base material. This scale spallation at high temperatures did not appear on Alloy A. From external appearances it seems that the chromium-containing Alloy B possessed better oxida- tion resistance only at temperatures below 1200 ~
Figure 1 Cross-sections of oxidized specimens of Alloy A after air exposure at various temperatures: (a) 560~ 492 h; (b) 750~ 492 h; (c) 900 ~ 96 h; (d) 1050 ~ 96 h; (e)1150 ~ 96 h; (f) 1200 ~ 96h; (g) 1300 ~ 4 h.
lZ 9
%6
- 4 ~ 3 kk ~k \-36
8 1 1Z I/T (10 4 K -1)Figure3 Arrhenius diagrams for the square of the penetration
depth, x, of the oxides into and along the grain boundaries divided by the exposure time. (O) Alloy A, (A) Alloy B.
TA B L E I The activation energy for the penetration of oxides into
and along the grain boundaries in Alloys A and B
Temperature
(of)
Activation energy (kcal tool 1)
A: NivsA121ZrlBo. 2 B: Niv3AllsCrsZrlBo.2.
< 1050 39.4 35.5
> 1050 94.8 104.9
Figure 2 Cross-sections of oxidized specimens of Alloy B after air
exposure at various temperatures: (a) 750 ~ 492 h; (b) 900 ~ 96 h;
(c) 1050~ 96 h; (d) 1150~ 96h; (e) 1200 ~ 41 h; (f) 1300 ~ 2h.
along the grain boundaries into the material interior. The square of the penetration depth of these oxidation products divided by the exposure time, which corres- ponds to the square of the reaction constant, are plotted in an Arrhenius diagram in Fig. 3. As can be seen, a linear relation exists for both alloys. This implies that the reaction is diffusion controlled. How- ever, there was an inflection in both lines at 1050 ~ To compare the reaction kinetics, the activation ener- gies for Alloys A and B above and below 1050 ~ were calculated and are shown in Table I. The activation
(e)
(d)
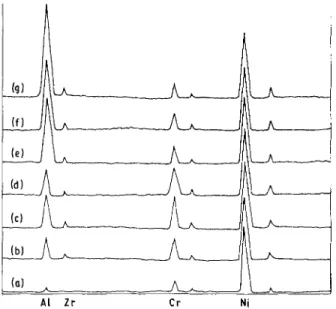
, (c) (b) o) At NiFigure 4 The EDS spectra taken from the surface of the oxide scales
for Alloy A: (a) 560~ 492 h; (b) 750~ 492h; (c) 900~ 96h;
(d) 1050~ 96h; (e) 1150~ 96h; (f) 1200 ~ 96 h; (g) 1300 ~ 4h.
energy for Alloy A is seen to be about 2.7 times greater above 1050 ~ while that for Alloy B is about 3 times greater. From the EDS observations, which will be described later, that grain-boundary oxidation pro- ducts are ZrO 2 particles surrounded by a thin ~- A120 3 shell, the drastic increase of the activation
energy for the oxide penetration along grain bound- aries above 1050 ~ shown in Fig. 3 can be explained as follows. It is known that ZrO 2 possesses a tetra- gonal structure with a density of 6.1 g c m - 3 above
AI Zr Cr Ni
Figure 5 The EDS spectra taken from the surface of the oxide scales
for Alloy B. (a) 560 ~ 492 h; (b) 750 ~ 492 h; (c) 900 ~ 96 h;
(d) 1050 ~ 96 h; (e) 1150 ~ 96 h; (f) 1200~ 96h; (g) 1300 ~ 4h.
!
Ni Ni
5~O 100 150 ~00 250
Binding energy (eV)
Figure 6 The XPS spectra taken from the outermost surface of the
oxide scale for Alloy A.
Ni
~
At ZrI I I I
0 50 100 150 200 250
Binding energy (eV)
Figure 7 The XPS spectra taken from the outermost surface of the
oxide scale for Alloy B.
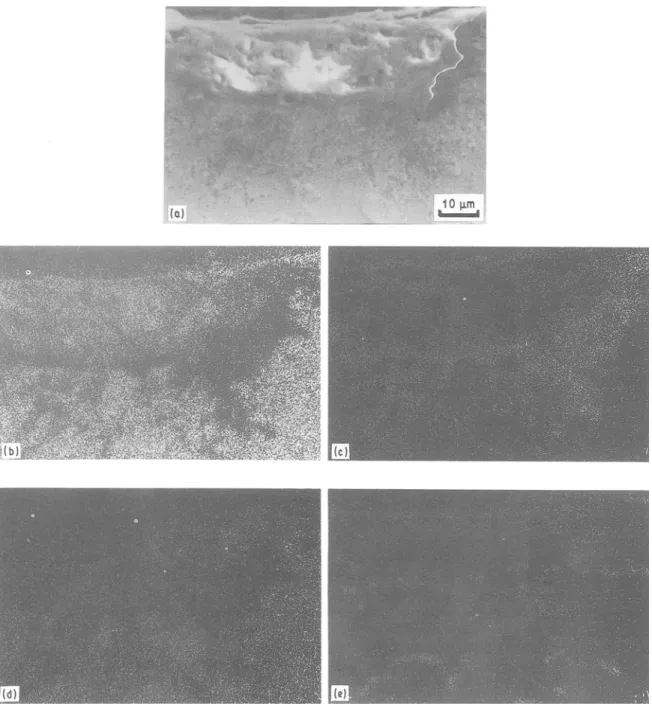
Figure 8 Element mapping by EDS for cross-sections of oxidized
specimens of Alloy A. (a) Whole alloy, (b) nickel, (c) aluminium, (d) zirconium.
1050 ~ and a monoclinic structure with a density of 5.56gcm -3 below 1050~ Thus, the denser ZrO 2 oxide formed above 1050~ occupies a smaller vol- ume and is more easily formed and fitted into the boundary region between two Ni3A1 grains than the oxides formed below 1050 ~ The penetration of these oxide products increases drastically above this critical temperature. In Figs lg and 2g severe grain-boundary melting was discovered in both Ni3A1 alloys after exposure at 1300~ This was caused by a eutectic
reaction between NisZr and nickel at the grain bound- aries for Ni3A1 alloys with zirconium contents greater than 1 at % [13].
Fig. 3 also indicates that below 1050 ~ the chrom- ium-containing Alloy B has better oxidation resist- ance. On the contrary, above this temperature the penetration depth in Alloy B is larger than that in Alloy A. The results are consistent with the outward appearance of the oxidized specimens. As such the beneficial effect of chromium on the oxidation resist- ance at temperatures below 1050 ~ may be attributed to the diminution of oxygen concentration on the surface as a result of the oxygen being tied up by chromium in this alloy. Because of the decrease in oxygen partial pressure at the surface, a dense A120 3 film can be formed and the oxidation rate can be slowed down. However, as the temperature is in- creased above 1050 ~ a volatile form of CrO a tended to form, which results in many microvoids in the oxide
scale. The loss of chromium through the formation and vaporization of CrO 3 can be proved by EDS analysis, which showed that the chromium content in the oxide scale was lower than that in the matrix for the higher temperatures.
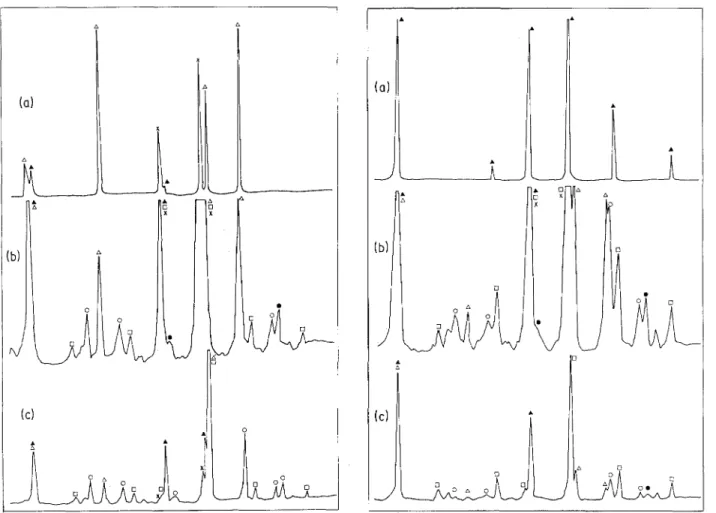
The EDS spectra taken from the surfaces of the oxide scales are shown in Figs 4 and 5 for Alloys A and B, respectively. These indicate that all of the outer scales of Alloy A are nearly pure NiO for specimens oxidized at all temperatures. However, the outer scales of Alloy B contained nickel, aluminium, chromium and zirconium. Fig. 5 also shows that the relative quantity of aluminium increases with exposure tem- perature, while chromium increases from 560-1050 ~ and then decreases as the temperature is raised further.
The outermost surface of the oxide scale was exam- ined by XPS. Typical spectra are shown in Figs 6 and 7 for Alloys A and B, respectively. The results indicate
Figure 9 Elements mapping by EDS for cross-sections of oxidized specimens of Alloy B. (a) Whole alloy, (b) nickel, (c) aluminium, (d) chromium, (e) zirconium.
that only NiO exists in the scale on Alloy A, while both A1203 and NiO were detected in the scale on Alloy B. These results support the explanation, that the addition of chromium promotes the formation of a denser A1203 thin film, which provides better oxida- tion resistance for Alloy B at temperatures below
1150 ~
In order to study the distribution of elements on the cross-sections of oxidized specimens, elemental map- ping by EDS was conducted and the results are shown in Figs 8 and 9 for Alloys A and B after air exposure at 1150 ~ for 96 h. It can be seen that the oxidized scale in Alloy A consisted of an outer layer rich in nickel and an inner layer rich in aluminium. Also, the oxides which had formed in and along the grain boundaries were rich in aluminium and zirconium. These oxides on the grain boundaries could be ZrO2 particles surrounded by an ~-AI20 3 shell as suggested by Taniguchi et al. [5]. As can be seen in Fig. 9, the oxide scale of Alloy B contained a thin outer layer with nickel, aluminium and zirconium enrichment and an inner layer with aluminium enrichment. As in Alloy A, the oxides penetrating along the grain boundaries in this alloy are also rich in aluminium and zirconium. Fig. 9 also shows an NiO nodule between the outer and inner oxide layers in Alloy B. Such oxide nodules were only found in this chromium-containing alloy for oxidation temperatures above 1150 ~ The existence of NiO oxide nodules in Alloy B implies that the oxide
film ruptured at this temperature and a large amount of oxygen penetrated into the material to oxidize the nickel in the interior. The larger penetration depth for Alloy B above 1150~ shown in the Arrhenius dia- gram of Fig. 3 can also be understood in this way.
Typical XRD spectra of the oxide film are shown in Figs 10 and 11 for Alloys A and B, respectively. Only an NiO peak can be found for Alloy A after 492 h exposure at 560 and 750 ~ As the exposure temper- ature is increased to above 900 ~ the XRD patterns showed peaks for NiO, ZrOe, ~-A120 3 and NiAlzO 4. Also, some pure nickel peaks are observed which might be attributed to the oxidation of large amounts of aluminium in the Ni3A1 matrix to leave the ele- mental nickel. From Fig. 10 it can also be seen that the very strong { 1 1 1} peak from NiO obtained from the specimen after oxidation at 1050 ~ for 96 h decreased significantly in intensity as the exposure temperature increased to 1150~ Corresponding to the intensity decrease of the {1 1 1} peak of NiO, the {3 1 1} peak of NiA120 4 increased in intensity. This result indicates that at the higher oxidation temperature the ~-AleO 3 film tends to react with the outer NiO film to form an NiAlzO 4 intermediate layer.
The XRD spectra from Alloy B shown in Fig. 11 are similar to those of Alloy A. However, consistent with the better oxidation resistance of Alloy B at lower temperatures, only a few oxide peaks could be found after exposure at temperatures below 750 ~ It was
(a) 0 (c) 9 O 0 A 0 [] 0 [ ] 0 0 U o 0
Figure 10 The XRD spectra of the oxide scales for Alloy A:
(a) 750~ 492h; (b) 1050~ 96h; (c) 1200~ 41 h. (A) Ni3A1 ,
(A) NiO, ( ~ ) AI20 3, (O) NiA1204, (@) ZrO2, ( x ) Ni.
cb !
I II
IY
[] ~3Figure 11 The XRD spectra of the oxide scales for Alloy B: (a)
750~ 492 h; (b) 1050~ 96 h; (c) 1200~ 41 h. For key, see
astonishing that no Cr20 3 peaks could be found by XRD on the chromium-containing Alloy B. However, the EDS spectra shown in Fig. 5 showed that the oxide scales on Alloy B do indeed contain chromium. A possible explanation for this discrepancy may be that chromium atoms substitute for nickel and aluminium atoms in the oxides as they do in the matrix Ni3A1, In this case the oxidation products would be (Ni, Cr)O and ~-(A1, Cr)203 rather than the NiO and o~-A120 3 scales on Alloy A. If this is true, peaks of both oxides should be shifted slightly due to small changes in their lattice parameters. Careful comparison of the spectra in Figs 10 and 11 shows this to be the case.
4. Conclusion
Considering both the outer appearance of the oxidized specimens and the penetration depth of the oxidation products into and along the grain boundaries, the Ni3AI alloy containing 8 at % Cr possesses better oxidation resistance below 1150 ~ than an identical alloy without chromium. The beneficial effect of chromium in this case is attributed to the formation of a thin ~-AlzO 3 film on the outermost surface of the oxide scale on this alloy. XPS analysis confirmed this explanation. Above 1150~ the existence of many microvoids in the oxide scale of the chromium- containing Ni3A1 resulting from the formation and volatilization of CrO 3 resulted in a larger penetration depth of oxidation products into and along the grain boundaries is diffusion controlled. The lines in the Arrhenius diagrams for both alloys exhibit inflection points at about 1150 ~ which was attributed to the
volume difference between the polymorphic structures of ZrO 2 on the grain boundaries above and below 1050 ~ EDS, XRD and XPS analyses showed that the oxide scales formed on the Alloy A were NiO/NiA1/O4/A1203, while those on Alloy B were AlzO3.NiO/NiA1204/A1203 with chromium substi- tuting for aluminium or nickel on some of the lattice sites.
References
1. K. AOKI and O. I Z U M I , J. Jpn. Inst. Metals 43 (1979) 1190.
2. O. N O G U C H I , Y.'OYA and T. SUZUKI, Metall. Trans. 12A
(1981) 1647.
3. J. D. K U E N Z L Y and D. L. DOUGLASS, Oxid. Metals 8
(1974) 139.
4. S. T A N I G U C H I and T. SHIBATA, ibid. 25 (1986) 201.
5. S. T A N I G U C H I , T. SHIBATA and H. T S U R U O K A , ibid. 26
(1986) 1.
6. C.Y. LIU and C. L. WHITE, Mater. Res. Sci. Syrup. Proc. 39
(1984) 365.
7. S.E. HSU, N. N. HSU, C. H. T O N G , P. H. HU and J. Y. MA, in "Proceedings of the Annual Conference of the Chinese Society of Materials Science" (1986) p. 423.
8. D . A . W O O D F O R D , Metall. Trans. i2A (1981) 299. 9. Idem, ibid. 12A (1981) 1467.
10. S. T A N I G U C H I and Y. SHIBATA, Oxid. Metals 26 (1987)
155.
11. C . T . LIU and V. K. SIKKA, J. Metals 38 (1986) 19.
12. J . A . H O R T O N , J. V. CATHCART and C. T. LIU, Oxid. Metals 29 (1988) 347.
13. T . H . C H U A N G and Y. C. PAN (1990) to be published.
Received 16 July 1990 and accepted 6 February 1991