doi:10.1007/s11524-007-9195-1
* 2007 The New York Academy of Medicine
Urbanization and Stroke Prevalence in Taiwan:
Analysis of a Nationwide Survey
Herng-Ching Lin, Yen-Ju Lin, Tsai-Ching Liu, Chin-Shyan Chen, and Wen-Ta Chiu
ABSTRACT This study aims to explore the prevalence of strokes among individuals and the association with urbanization levels. A total sample of 9,794 individuals was obtained from a nationwide survey on Taiwan for subsequent analysis in this study. After adjusting for gender, age, other risk factors for stroke and individual socioeconomic status, a multivariate logistic regression model was employed to investigate the relationships existing between the prevalence of strokes and the level of urbanization. This study finds that those living in areas at the highest level of urbanization (level 1) had the highest prevalence of strokes (2.49%). With decreasing urbanization level, there was a general decline in stroke prevalence. After adjusting for other factors, the multivariate logistic regression analyses showed that compared to participants living in the highest urbanization level, the respective odds ratios of suffering a stroke for those living in areas at the lowest levels of urbanization (levels 7 and 8), were 0.43 and 0.30. We conclude that after adjusting for other stroke risk factors, the level of urbanization is an important contributory factor to the overall prevalence of strokes in Taiwan.
KEYWORDS Stroke, Urbanization, Health Policy
INTRODUCTION
As the second most common cause of death among individuals in developed countries and a primary source of disability in many Western countries among elderly sufferers (over the age of 60 years), stroke attacks clearly represent a major health problem.1–5Strokes also create an enormous burden on national healthcare systems due to the requirement of ongoing care for survivors.5–8
Every year, there are approximately 5.5 million deaths worldwide as a direct result of strokes, with a further 49 million people subsequently suffering from severe disabilities as a result of their stroke attack.4,8 Numerous epidemiological studies within the literature have concluded that the risk factors leading to stroke include conditions such as hypertension, hyperlipidemia, diabetes, obesity,
smok-Lin is with the School of Health Care Administration and Topnotch Stroke Research Center, Taipei Medical University, Taipei, Taiwan; Lin is with the Department of Public Finance, China University of Technology, Taipei, Taiwan; Liu is with the Department of Public Finance, National Taipei University, Taipei, Taiwan; Chen is with the Department of Economics, National Taipei University, Taipei, Taiwan; Liu and Chen are with the Taipei Municipal Wan Fang Hospital, Taipei, Taiwan; Chiu is with the College of Medicine, Taipei Medical University, Taipei, Taiwan.
Correspondence: Herng-Ching Lin, School of Health Care Administration, Taipei Medical University, 250 Wu-Hsing St, Taipei, 110, Taiwan. (E-mail: [email protected])
ing, alcohol consumption, an individual_s socioeconomic status (SES), and family antecedents of cerebrovascular disease.6,7,9–19
Very few studies, however, have set out to investigate the prevalence of strokes in terms of geographical distribution.20,21 Moreover, studies examining the relationship between the prevalence of strokes and the level of urbanization of the community in which strokes are occurring are virtually nonexistent. The absence of such studies is clearly detrimental to the efforts of clinicians and policymakers alike, as this impedes their ability to consider the policy implications of the impacts of urbanization level on stroke prevalence, and thereby, their ability to develop effective strategies aimed at preventing stroke occurrences within certain regions and/or communities.
The purpose of this study is therefore to examine a national sample of individuals in Taiwan, over the age of 35 years, to determine the association between the prevalence of strokes and the level of urbanization of Taiwanese cities and counties in which the attacks occurred. To take account of some of the weaknesses within the prior related studies, in this study, as opposed to using potentially biased regional samples, we use nationwide survey data.
In 2004, the mortality rate for victims of stroke in Taiwan was about 55 deaths per 100,000 people, with approximately 11% of all deaths being attributable to strokes, thereby making it the second leading cause of death in Taiwan at a cost of approximately NT$359 million (the exchange rate in 2004 was approximately US$1.00=NT$33.0).22
The results of this study should have some important policy implications for medical professionals and policymakers alike in terms of providing a better understanding of the association between the level of urbanization and the overall prevalence of strokes.
METHODS
Database and Study Sample
The data adopted for this investigation were obtained from the 2001 National Health Interview Survey (NHIS), a survey carried out by the National Health Research Institutes and Bureau of Health Promotion (BHP) at the Department of Health, Executive Yuan, Taiwan.23The 2001 NHIS provides nationwide population estimates on health behavior, health conditions, and the usage of medical resources within Taiwan_s 23 administrative districts, consisting of 316 cities/counties.
The survey target population comprised of 27,160 observations on individuals over the age of 12 years on 16 January 2001 using face-to-face interviews and a multistage stratified systematic sampling design method. Ultimately, between late August 2001 and January 2002, the NHIS collected data on 20,855 people, representing 76.8% of the target population.
The database provides detailed information on a series of personal demo-graphic and socioeconomic characteristics including age, gender, marital status, income, and highest educational level attained, and detailed information on the usage of medical resources, an individual_s health status, and other types of health-related behavior. More detailed information on the data collection process is available in Shih and Chung.23
Given that the prevalence of strokes among individuals below the age of 35 years is inherently low, our study necessarily focused on individuals within the
overall sample over the age of 35 years. Ultimately, after excluding individuals aged between 12 and 34 years (n=8,246) and those with missing data (n=2,815), we were left with a total sample of 9,794 individuals for inclusion in our analysis.
Key Variables of Interest
The dependent variable was defined as whether or not a person had suffered from a stroke, with the stroke diagnosis having been confirmed by a physician, while the key independent variable of interest to this study was the level of urbanization of the community within which the stroke had occurred. The level of urbanization of the cities/counties was stratified into eight classifications (from 1 indicating the most urbanized to 8 indicating the least urbanized).24
All 316 cities/counties in Taiwan were stratified into the eight levels based upon a composite score obtained by calculating population density, age structure, employment rate, the density of the manufacturing industry, the average male immigration rate, the average female immigration rate, economic activities, average annual income per person, average annual expenditure per person, the average daily amount of garbage per 1,000 of the population, the average number of telephones per family, educational level, the number of physicians per 1,000 of the population, and the availability of health care facilities in each city/county.
Although this classification method was proposed by Tzeng and Wu in 1986, and despite Taiwan having undergone rapid socioeconomic development in recent decades, it is still a method of classification adopted by many researchers in Taiwan,25,26 and by government organizations, such as the Institute of Occupa-tional Safety and Health (IOSH), Executive Yuan because it is believed that to date, this classification method provides the most accurate reflection of the real scenario in terms of the urbanization levels of cities and counties in Taiwan.24
The findings of numerous prior studies have demonstrated that there are many differences in risk factors and socioeconomic status (SES—which include education and income levels), all of which have a significant association with the prevalence of strokes. These include gender, age at the onset of the stroke, any prior history of heart disease, hypertension, diabetes mellitus, information on the participant_s smoking status, body mass index (BMI), and SES.1,2,4–7,9–11,13,15,16,18,19Therefore, within the overall analysis in this study, these factors have been adjusted for, to facilitate our examination of the relationship between the level of urbanization and the prevalence of strokes.
The sample subjects were classified under five age groups, 35–44, 45–54, 55– 64, 65–74 and Q75 years. Participants were deemed to have a history of heart disease if they had had a self-reported history of myocardial infarction, coronary artery bypass surgery, or coronary angioplasty before a stroke. Hypertension was considered to be present where there was systolic blood pressure of Q140 mmHg, diastolic blood pressure of Q90 mmHg or the use of antihypertensive medication before the onset of a stroke.
Individuals were considered as having diabetes if the condition had been previously diagnosed by a health professional, or if they were receiving insulin treatment before a stroke. The measure of smoking indicated whether the individual consumed cigarettes almost every day before having a stroke. The body mass index in this study was calculated by dividing the person_s weight (kg) by the square of their height (m2) which was then stratified into three groups,G25, 25–29.9, and Q30.
Educational attainment was divided into four categories, primary school and below (0–6 years of full-time education), junior high school (7–9 years), senior high
school (10–12 years), and college or above (Q13 years). It should be noted that income mainly represents the material dimension of SES, with individual monthly income being categorized into four groups, NT$0–4,999, NT$5,000–19,999, NT$20,000–39,999, and QNT$40,000 (the average exchange rate in 2001 was US$1.00=NT$32.5).
Statistical Analysis
Descriptive analyses, which included the frequency, percentage, prevalence of stroke, and 95% confidence interval, were performed on all of the identified variables, with a logistic regression model being employed to estimate the crude odds ratios for stroke prevalence, by degree of urbanization. Thereafter, we investigated the association between the level of urbanization and the prevalence of strokes by performing a multivariate logistic regression analysis, adjusting for both other risk factors and an individual_s SES. A two-sided p-value of e0.05 was considered to be statistically significant. The statistical packages, SAS System for Windows (version 8.2) and Stata (STATA Corporation, version 9.0), were used for all of the statistical analyses undertaken in this study.
RESULTS
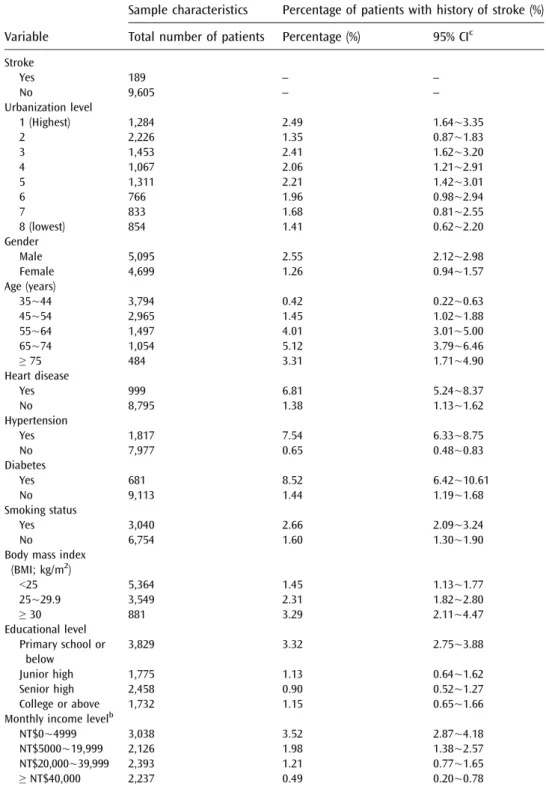
Of the 9,794 individuals in the sample, 189 (1.93%) reported that they had previously suffered from a stroke. Table1 summarizes the descriptive statistics of our sample by the level of urbanization of their residential cities/counties, risk factors for stroke and SES. The table also describes the percentage with history of stroke by the urbanization level of the community in which the stroke occurred.
The distribution of the level of urbanization indicated that the majority of the study sample was to be found within communities situated at urbanization level 2. The mean age of the study sample was 50.6 years, with a standard deviation of 12.2 years. Approximately 70% of the total sample was found to be in the 35–54 years age group. As Table 1 shows, those living in areas with the highest urbanization level (level 1) had the highest stroke prevalence (2.49%). With decreasing urbanization level, there was a general corresponding decline in the prevalence of strokes; however, this study also finds that the lowest prevalence of strokes (1.35%) was to be found among individuals living in urbanization level 2.
Figure 1 provides prevalence rates of stroke, diabetes, heart disease, and hypertension by urbanization level of the community (four bars per category of urban area). As the figure shows, those living in areas with the highest urbanization level (level 1) had the highest stroke prevalence (2.49%). The prevalence of stroke, for the most part, declined with decreasing urbanization level. However, we also found from the figure that individuals living in urbanization level 2 had the lowest stroke prevalence (1.35%).
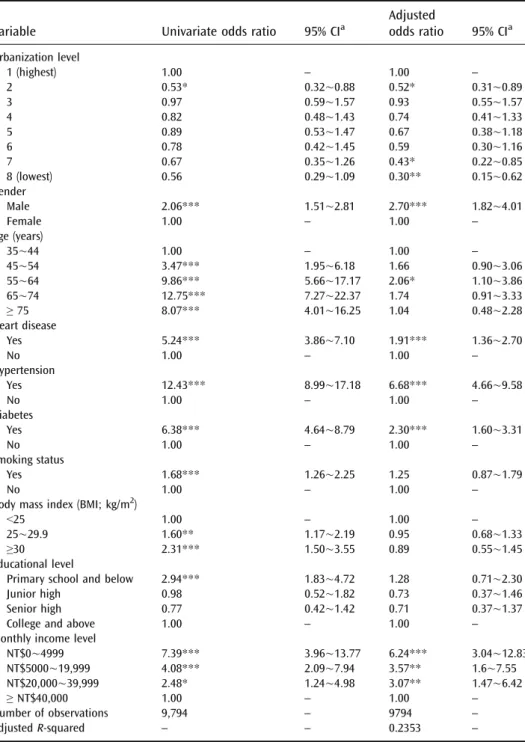
Details of the univariate and adjusted odds ratios of a stroke, by urbanization level, are presented in Table 2. After adjusting for other factors, the multivariate logistic regression analyses indicated that compared to participants living in the highest urbanization level (level 1), the odds ratios of a stroke were 0.43 for those living in urbanization level 7, and 0.30 for those living in urbanization level 8 (the lowest level). In addition, compared to participants living in areas at urbanization level 1, the odds ratios of a stroke were 0.52 for those living in areas at urbanization level 2.
TABLE 1 Descriptive statistics of sample characteristics and percentage with history of strokea
Variable
Sample characteristics Percentage of patients with history of stroke (%)
Total number of patients Percentage (%) 95% CIc
Stroke Yes 189 – – No 9,605 – – Urbanization level 1 (Highest) 1,284 2.49 1.64õ3.35 2 2,226 1.35 0.87õ1.83 3 1,453 2.41 1.62õ3.20 4 1,067 2.06 1.21õ2.91 5 1,311 2.21 1.42õ3.01 6 766 1.96 0.98õ2.94 7 833 1.68 0.81õ2.55 8 (lowest) 854 1.41 0.62õ2.20 Gender Male 5,095 2.55 2.12õ2.98 Female 4,699 1.26 0.94õ1.57 Age (years) 35õ44 3,794 0.42 0.22õ0.63 45õ54 2,965 1.45 1.02õ1.88 55õ64 1,497 4.01 3.01õ5.00 65õ74 1,054 5.12 3.79õ6.46 Q 75 484 3.31 1.71õ4.90 Heart disease Yes 999 6.81 5.24õ8.37 No 8,795 1.38 1.13õ1.62 Hypertension Yes 1,817 7.54 6.33õ8.75 No 7,977 0.65 0.48õ0.83 Diabetes Yes 681 8.52 6.42õ10.61 No 9,113 1.44 1.19õ1.68 Smoking status Yes 3,040 2.66 2.09õ3.24 No 6,754 1.60 1.30õ1.90
Body mass index (BMI; kg/m2) G25 5,364 1.45 1.13õ1.77 25õ29.9 3,549 2.31 1.82õ2.80 Q 30 881 3.29 2.11õ4.47 Educational level Primary school or below 3,829 3.32 2.75õ3.88 Junior high 1,775 1.13 0.64õ1.62 Senior high 2,458 0.90 0.52õ1.27 College or above 1,732 1.15 0.65õ1.66 Monthly income levelb
NT$0õ4999 3,038 3.52 2.87õ4.18
NT$5000õ19,999 2,126 1.98 1.38õ2.57 NT$20,000õ39,999 2,393 1.21 0.77õ1.65
Q NT$40,000 2,237 0.49 0.20õ0.78
aTotal sample number= 9,794
bAverage exchange rate in 2001 was US$1.00=NT$32.5 cConfidence interval
The analyses also revealed that the occurrence of strokes was significantly related to gender, personal income levels, and as expected, specific stroke risk factors (including heart disease, hypertension, and diabetes). We also found that males were, on average, 2.7 times more likely than females to have a stroke (ranging between 1.82 and 4.01). Furthermore, those in the 55- to 64-year age group were more likely to have a stroke than their counterparts in any of the other age groups.
DISCUSSION
Despite the increasing emphasis in many countries on the exploration of factors leading to a stroke, to the best of our knowledge, no attempt has yet been made to investigate the effects of the level of urbanization on the prevalence of strokes. A number of recent studies have focused on the associations between urbanization levels and incidences of disease, such as diabetes, breast cancer, allergic diseases, and asthma, with the results showing that urbanization had significant impacts on the prevalence rates of various diseases.27–30 We believe, however, that this nationwide population-based study represents the first of its kind to attempt to examine the association between the level of urbanization and the prevalence of strokes.
Some attention has been paid to the effects of geographical differences on stroke occurrences, with an earlier study by Jiang et al.,21having found that there were geographical variations in the prevalence of strokes between three major cities in China: Beijing, Shanghai, and Changsha. Engstrom et al.20had earlier examined 17 areas and found marked differences between stroke prevalence levels within different residential areas. These studies did, however, tend to ignore the level of urbanization within each of the communities examined, while the measurement of socioeconomic circumstances (expressed in terms of a composite score) also failed FIGURE 1. Percentage with prevalence of stroke, diabetes, heart disease, and hypertension.
TABLE 2 Univariate and multivariate logistic regression analysis of the relationship between stroke prevalence and other factors
Variable Univariate odds ratio 95% CIa
Adjusted odds ratio 95% CIa Urbanization level 1 (highest) 1.00 – 1.00 – 2 0.53* 0.32õ0.88 0.52* 0.31õ0.89 3 0.97 0.59õ1.57 0.93 0.55õ1.57 4 0.82 0.48õ1.43 0.74 0.41õ1.33 5 0.89 0.53õ1.47 0.67 0.38õ1.18 6 0.78 0.42õ1.45 0.59 0.30õ1.16 7 0.67 0.35õ1.26 0.43* 0.22õ0.85 8 (lowest) 0.56 0.29õ1.09 0.30** 0.15õ0.62 Gender Male 2.06*** 1.51õ2.81 2.70*** 1.82õ4.01 Female 1.00 – 1.00 – Age (years) 35õ44 1.00 – 1.00 – 45õ54 3.47*** 1.95õ6.18 1.66 0.90õ3.06 55õ64 9.86*** 5.66õ17.17 2.06* 1.10õ3.86 65õ74 12.75*** 7.27õ22.37 1.74 0.91õ3.33 Q 75 8.07*** 4.01õ16.25 1.04 0.48õ2.28 Heart disease Yes 5.24*** 3.86õ7.10 1.91*** 1.36õ2.70 No 1.00 – 1.00 – Hypertension Yes 12.43*** 8.99õ17.18 6.68*** 4.66õ9.58 No 1.00 – 1.00 – Diabetes Yes 6.38*** 4.64õ8.79 2.30*** 1.60õ3.31 No 1.00 – 1.00 – Smoking status Yes 1.68*** 1.26õ2.25 1.25 0.87õ1.79 No 1.00 – 1.00 –
Body mass index (BMI; kg/m2)
G25 1.00 – 1.00 –
25õ29.9 1.60** 1.17õ2.19 0.95 0.68õ1.33 Q30 2.31*** 1.50õ3.55 0.89 0.55õ1.45 Educational level
Primary school and below 2.94*** 1.83õ4.72 1.28 0.71õ2.30 Junior high 0.98 0.52õ1.82 0.73 0.37õ1.46 Senior high 0.77 0.42õ1.42 0.71 0.37õ1.37
College and above 1.00 – 1.00 –
Monthly income level
NT$0õ4999 7.39*** 3.96õ13.77 6.24*** 3.04õ12.83 NT$5000õ19,999 4.08*** 2.09õ7.94 3.57** 1.6õ7.55 NT$20,000õ39,999 2.48* 1.24õ4.98 3.07** 1.47õ6.42 Q NT$40,000 1.00 – 1.00 – Number of observations 9,794 – 9794 – Adjusted R-squared – – 0.2353 –
Average exchange rate in 2001 was US*$1.00=NT*$32.5. *pG0.05
**pG0.01 ***pG0.001
to consider other aspects, such as economic activities, average family income, and educational level.
In this study, urbanization was divided into eight levels based upon a composite score according to age structure, population density, immigration rate, economic activities, educational level, average family income, availability of health care facilities, and so on. We feel that this approach unequivocally represents the differences between levels of urbanization within each region and that it provides the most accurate reflection of the real scenario in terms of the urbanization levels in different cities/counties. As a result, we feel that our estimations should be quite accurate.
Our empirical results show that differences between urbanization levels were one of the major factors associated with the prevalence of strokes in Taiwan, with those regions at urbanization level 1 having the highest prevalence of strokes compared to those areas at the lower levels of urbanization. A possible contributory factor to such differences is Taiwan_s rapid socioeconomic development, particu-larly in terms of economic activity, from an agriculturally based society, to one based more upon industrial and commercial activities. Those participants living at the highest level of urbanization (with higher population density, immigration rates, and higher-speed economic activities) may experience higher levels of air pollution and greater pressure of life, which, in turn, could lead to higher stroke prevalence. Other prior studies have also reported that higher air pollution levels and greater levels of depression can lead to a correspondingly higher prevalence of strokes.31–37 Furthermore, it is also possible that those study subjects in the upper income group would be more likely to reside in the less urbanized areas and more likely to receive regular health check-ups, possibly from private health care facilities which tend to be better equipped; thus, they would be at a lower risk of suffering a stroke attack. In contrast, the study subjects in the lower income group may well work and live in the inner city areas, and for various reasons, may be exposed to a higher risk of disease and a corresponding increase in the risk of a stroke attack.
In this study, however, we have also found that there was a significantly lower prevalence of strokes in those areas at urbanization level 2 than in all other urbanization levels. Given that some of the prior literature has consistently demonstrated that fluctuations in climate have a significant impact on the occurrence of strokes,31–34 it is possible that the majority of the communities at urbanization level 2 would be located in the central and southern regions of Taiwan, which are renowned for having a very stable climate, and this could potentially affect this result.
This study suffers from a few inherent limitations. First, strokes are divided into several categories, including nine major causes (ICD-9 codes 430–438), which are then grouped into four subtypes, subarachnoid hemorrhage (ICD-9 code 430), intracerebral hemorrhage (ICD-9 code 431–432), ischemic stroke (ICD-9 code 433– 435), and other strokes (ICD-9 code 436–438); however, the dataset used in this study did not contain detailed information on these various stroke subtypes.
Secondly, many of the prior studies reported that alcohol consumption was an important factor contributing to the prevalence of strokes,38–40 while occupation, which is one of the SES indicators, has also been found to play a crucial role in stroke prevalence.2,4,6However, this type of information was not available from the NHIS. Finally, the level of urbanization for each region was calculated by a composite score from several variables published by the IOSH in Taiwan, including age structure, population density, immigration rate, economic activities, educational level, average family income, availability of health care facilities, and so on.24
However, it may well be that these variables have different impacts on the prevalence of strokes. Unfortunately, our database lacks information on these variables, with the exceptions of age structure and educational level. Thus, further research should focus on exploring the relationship between the prevalence of strokes and specific dimensions, such as population density, economic activities, average family income, and availability of health care facilities.
Conclusions
This is the first nationwide-based study to examine the relationship between urbanization and the prevalence of strokes in the field of cerebrovascular disease. We have found that with a decreasing level of urbanization, there is a general decline in stroke prevalence; therefore, after adjusting for other stroke risk factors, the level of urbanization is proposed as an important contributory factor to the overall prevalence of strokes in Taiwan.
Policy Implications
This finding can provide guidelines for policymakers in Taiwan and in other countries with similar health care systems, in their attempts to reduce the inordinately higher prevalence of strokes in certain communities so as to effectively reduce the overall stroke morbidity rate. Other countries may also find our study results helpful when investigating this topic, as they should prove useful in terms of facilitating cross-country comparisons.
ACKNOWLEDGEMENT
This study was supported by Topnotch Stroke Research Center Grant, Ministry of Education, Taiwan.
REFERENCES
1. Berger K, Schulte H, Stogbauer F, Assmann G. Incidence and risk factors for stroke in an occupational cohort: The PROCAM study. Stroke. 1998;29:1562–1566.
2. Caroline TM, Hendrike M, Monique MB, Grobbee DE, Mackenbach JP. Socioeconomic differences in stroke among Dutch elderly women: The Rotterdam study. Stroke. 1999;30:357–362.
3. Cinzia S, Daiva R, Zygimantas C, Jaakko T. Internal trends in mortality from stroke, 1968 to 1994. Stroke. 2000;31:1588–1601.
4. Cox AM, McKevitt C, Rudd AG, Wolfe CDA. Socioeconomic status and stroke. Lancet Neurol. 2006;5:181–188.
5. Wolf PA, D_Agostino RB, Belanger AJ, Kannel WB. Probability of stroke: a risk profile from the Framingham study. Stroke. 1991;22:312–318.
6. Hart CL, Hole D, Smith GD. The contribution of risk factors to smoke differentials, by socioeconomic position in adulthood: The Renfrew/Paisley study. Am J Public Health. 2000;90:1788–1791.
7. Jakovljevic D, Sarti C, Sivenius J, et al. Socioeconomic status and ischemic stroke: The FINMONICA stroke register. Stroke. 2001;32:1492–1498.
8. World Health Qrganization. World health report 2004 changing history. Geneva:World Health Qrganization; 2004 (Statistical Annex).
9. Boysen G, Nyboe J, Appleyard M, et al. Stroke Incidence and risk factors for stroke in Copenhagen, Denmark. Stroke. 1988;19:1345–1353.
10. Diez-Roux AV, Link B, Northridge ME. A multilevel analysis of income inequality and cardiovascular disease risk factors. Soc Sci Med. 2000;50:673–687.
11. Mensah GA, Mokdad AH, Ford ES, Greenlund KJ, Croft JB. State of disparities in cardiovascular health in the United States. Circulation. 2005;111:1233–1241.
12. Duncan GJ, Daly MC, McDonough P, Williams DR. Optimal indicators of socioeco-nomic status for health research. Am J Public Health. 2002;92:1151–1157.
13. Gillum RF, Mussolino ME. Education, poverty, and stroke incidence in whites and blacks: The NHANES I epidemiologic follow-up study. J Clin Epidemiol. 2003;56:188–195. 14. Grundy E, Holt G. The socioeconomic status of older adults: How should we measure it
in studies of health inequalities? J Epidemiol Community Health. 2001;55:895–904. 15. Jakovljevic D, Sarti C, Sivenius J, et al. Socioeconomic differences in the incidence,
mortality and prognosis of intracerebral hemorrhage in Finnish adult population: The FINMONICA stroke register. Neuroepidemiology. 2001;20:85–90.
16. Jakovljevic D, Sarti C, Sivenius J, et al. Socioeconomic inequalities in the incidence, mortality and prognosis of subarachnoid hemorrhage: The FINMONICA stroke register. Cerebrovasc Dis. 2001;12:7–13.
17. Krieger N, Williams DR, Moss NE. Measuring social class in U.S. public health research: concepts, methodologies, and guidelines. Annu Rev Public Health. 1997;18:341–378. 18. Brown P, Guy M, Broad J. Individual socio-economic status, community socio-economic
status and stroke in New Zealand: a case control study. Soc Sci Med. 2005;61:1174–1188. 19. Modan B, Wagener DK. Some epidemiological aspects of stroke: mortality/morbidity
trends, age, sex, race, socioeconomic status. Stroke. 1992;23:1230–1236.
20. Engstrom G, Jerntorp I, Pessah-Rasmussen H, et al. Geographic distribution of stroke incidence within an urban population: relations to socioeconomic circumstances and prevalence of cardiovascular risk factors. Stroke. 2001;32:1098–1103.
21. Jiang B, Wang WZ, Chen HL, et al. Incidence and trends of stroke and its subtypes in China: results from three large cities. Stroke. 2006;37:63–68.
22. Health Statistics [in Chinese]. Executive Yuan, Taipei, Taiwan: Department of Health. Available at:http://www.doh.gov.tw. Taiwan.
23. Shih YT, Chang HY, Le KH [in Chinese]: Introduction to the National Health Interview Survey (NHIS). Vol 1. NHIS Brief Communication. 2002.
24. Tzeng GH, Wu TY. Characteristics of urbanization level in Taiwan districts. Geograph-ical Res. 1986;12:287–323.
25. Lin HC, Kao S, Tang CH, Chang WY. Using a population-based database to explore the inter-specialty differences in physician practice incomes in Taiwan. Health Policy. 2005;73:253–262.
26. Lin HC, Chen CS, Liu TC, Lee HC. Differences in practice income between solo and group practice physicians. Health Policy. 2006;79:296–305.
27. AI-Moosa S, Allin S, Jemiai N, AI-Lawati J, Mossialos E. Diabetes and urbanization in the Omani population: an analysis of national survey data. Popul Health Metr. 2006;4:1–20. 28. Hall SA, Kaufman JS, Millikan RC, Ricketts TC, Herman D, Savitz DA. Urbanization and breast cancer incidence in North Carolina, 1995–1999. Ann Epidemiol. 2005; 15:796–803.
29. Nicolaou N, Siddique N, Custovic A. Allergic disease in urban and rural populations: increasing prevalence with increasing urbanization. Allergy. 2005;60:1357–1360. 30. Viinanen A, Munhbayarlah S, Zevgee T, et al. Prevalence of asthma, allergic
rhinoconjunctivitis and allergic sensitization in Mongolia. Allergy. 2005;60:1370–1377. 31. Anlar O, Tombul T, Unal O, Kayan M. Seasonal and environment temperature variation in the occurance of ischemic strokes and intracerebral hemorrhage in a Turkish adult population. Intern J Neurosci. 2002; 112:959–963.
32. Azevedo E, Ribeiro JA, Lopes F, Martins R, Barros H. Cold: a risk factor for stroke? J Neurol. 1995;242:217–221.
33. Feigin VL, Anderson CS, Anderson NE, Broad JB, Pledger MJ. Is there a temporal pattern in the occurance of subarachnoid hemorrhage in the southern hemisphere?
Pooled data from 3 large, population-based incidence studies in Australia, 1981–1997. Stroke. 2001;32:613–619.
34. Feigin VL, Anderson CS, Rodgers A, Bennett DA. Subarachnoid haemorrhage occurance exhibits a temporal pattern—evidence from meta-analysis. Eur J Neurol. 2002;9:511–516. 35. Hong YC, Lee JT, Kim H, Kown HJ. Air pollution: a new risk factor in ischemic stroke
mortality. Stroke. 2002;33:2165–2169.
36. Jonas BS, Mussolino ME. Symptoms of depression as a prospective risk factor for stroke. Psychosom Med. 2000;62:463–471.
37. Ramasubbu R, Patten SB. Effect of depression on stroke morbidity and mortality. Can J Psychiatry. 2003;48:250–257.
38. Davis PH, Dambrosia JM, Schoenberg BS, et al. Risk factors for ischemic stroke: a prospective study in Rochester, Minnesota. Ann Neurol. 1987;22:319–327.
39. Gill JS, Zezulka AV, Shipley MJ, et al. Stroke and alcohol consumption. N Engl J Med. 1986;315:1041–1046.
40. Reynolds K, Gu D, Muntner P, et al. Alcohol consumption and risk of stroke: a meta-analysis. JAMA. 2003;289:579–588.