水平管道之圓型底板加熱面插入曲線板塊於管道上游位置對於迴流消除之影響
80
0
0
全文
(2) 水平管道之圓型底板加熱面插入曲線板塊於管 道上游位置對於迴流消除之影響 Elimination of Return Flow in Mixed Convection of Gas over a Heated Circular Plate in a Horizontal Flat Duct by Inserting Curved Blocks Ahead of the Plate. 研 究 生:白 榮 源. Student:Rong-Yuan Bai. 指導教授:林 清 發. Advisor:Tsing-Fa Lin 國立交通大學 機械工程研究所 碩士論文 A Thesis. Submitted to Institute of Mechanical Engineering Collage of Engineering National Chiao Tung University In Partial Fulfillment of the Requirements For the degree of Master of Science In Mechanical Engineering June 2004 Hsinchu, Taiwan, Republic of China 中 華 民 國 九 十 二 年 六 月.
(3) 誌 謝. 兩年研究所的求學過程在鳳凰花綻放下繽紛落幕, 踏出校門卻又是另一個 全新的開始, 夢想也為未來點了一盞燈。 在這兩年學習過程中首先我要感謝我 的指導教授林清發老師, 感謝老這兩年來的諄諄教誨, 讓我能在獨立思考中成 長茁壯 ,適時給予我方向。 更要感謝實驗室的杜志龍 、謝瑞青、 郭威伸 、 賴佑民 、陳尚緯、 謝汎鈞學長總是在我遇上瓶頸時給予我建議 ,並耐心教導 我實驗上之方法與求證, 無形中也成了我最寶貴的經驗與知識 ,在這兩年的過 程中最大的感動莫過於同學間彼此的激勵與努力, 謝謝佳鴻 、峯慶 、信介 。 因為你們讓我在研究所的學習生活中更添增了無限色彩與回憶, 同時也感謝學 弟 阿銘 、小柯 、阿賢 、立傑. 因為你們的幫忙協助讓我更能得心應手 。太. 多的感謝更是無法用言於一一描述。 但我知道沒有你們的伴隨也就不會有今日 的我 ,還是由衷的感謝你們。 在此我更要感謝我的家人, 因為他們總是在我的背後默默的支持著我, 為 我歡喜也為我憂心, 你們那溫暖的雙手總是為我而展開 ,無限的感動更不斷的 驅使著我往前進。 最後我更要祝福那些在我背後一直關心我 照顧我的人。. 學生生涯的結束只是另一個階段的起點 在此真誠的感謝熱質對流實驗室的所有同仁們 這裡的一切所學將使我在未來的旅途中 御風而上]. 榮源 2004 6 30 于風成交大.
(4) 水平管道之圓型底板加熱面插入曲線板塊於管 道上游位置對於迴流消除之影響. 學生: 白榮源. 教授: 林清發. 教授. 國立交通大學機械研究所 中文摘要. 本論文研究結合流體可視化及暫態溫度量測之方法,探討因浮力所驅動之 迴流(return flow)渦流結構於圓形底板加熱面之矩形管道中如何被消除藉由插 入曲線板於管道上游增加主流場速度。實驗操作參數範圍雷諾數和雷利數分別介 於 5.0 到 50.0 之間,及 7,500 到 19,800,插入曲線板於三個分別不同的位 置。其實驗所得結果將與未插入曲線板之水平管道做比較,特別將注意力著重於 其迴流結構如何藉由插入曲線板而消除;此外, 插入曲線板之位置對於壓制迴 流結構之影響也將做一步明細探討於本研究中。 由實驗研究結果顯示得知當插入曲線板於管道增加主流場速度而導致有 效的延遲迴流結構產生,並因此明顯的延遲迴流結構的產生。如此致使流體在單 一方向具有較廣泛之雷諾數。在臨界浮慣比下的迴流結構受曲線板作用而稍微的 減弱其強度、結構變的較小;此外將插入曲線板移向較接近於加熱面時,其迴流 結構之產生受曲線板影響而被延遲現象更加顯著。根據實驗所得的結果,簡略的 比較在矩形管道中插入曲線板與沒有曲線板作用,對於臨界迴流結構發生之影 響,並提出經驗公式。最後,在高浮慣比下,流體之震盪頻率也有效的受曲線板 之作用而被壓制..
(5) Elimination of Return Flow in Mixed Convection of Gas over a Heated Circular Plate in a Horizontal Flat Duct by Inserting Curved Blocks Ahead of the Plate. Student: Rong-Yuan Bai. Advisor: Prof. Tsing-Fa Lin. Institude of Mechanical Engineering National Chiao Tung University. ABSTRACT An experiment combining flow visualization and temperature measurement is carried out here to investigate in mixed convection of gas how the buoyancy induced return flow driven by a heated disk embedded in the bottom of a horizontal rectangular duct is suppressed by the main flow acceleration due to the insertion of the curved blocks into the upstream section of the duct. In the experiment the Reynolds and Rayleigh numbers of the flow are respectively varied from 5 to 50 and 7,500 to 19,800 with the blocks placed at three different positions. The results with the absence and presence of the blocks in the duct are compared with each other. Particular attention is focused on the elimination of the return flow by the insertion of the blocks. Besides, the suppression of the return flow affected by the locations of the blocks is also examined in detail. The results from the present study indicate that when the blocks are inserted into the duct the main flow acceleration causes a significant suppression of the return flow and hence causes a substantial delayed onset of the return flow. Thus the flow is uni-directional over a wider range of the Reynolds number. At supercritical i.
(6) buoyancy-to-inertia ratios the return flow becomes somewhat weaker in intensity and smaller in the size with the insertion of the blocks. Moreover, the onset of the return flow is delayed more substantially by placing the blocks closer to the heated plate. According to the data from the present experiment, the critical conditions for the onset of the return flow in the duct without and with the presence of the blocks are summarized and empirical correlations are proposed. Finally, the temporal oscillation of the flow at high buoyancy-to-inertia ratios can be significantly suppressed by the block insertion.. ii.
(7) CONTENTS ABSTRACT. i. CONTENTS. iii v. LIST OF TABLES. vi. LIST OF FIGURES. xii. NOMENCLATURE CHAPTER 1. CHAPTER 2. INTRODUCTION. 1. 1.1 Characteristics of Longitudinal and Transverse Rolls. 2. 1.2 Characteristics of Return Flows. 5. 1.4 Vortex Flow Stabilization. 6. 1.5 Objective of the Present Study. 7. EXPERIMENTAL APPARATUS AND PROCEDURES. 11. 2.1. Experimental Apparatus. 11. 2.2. Analysis of Time-average and Instantaneous Air. 14. Temperature. CHAPTER 3. 2.3. Preliminary Investigation of Flow Field. 14. 2.4. Experimental Procedures. 15. 2.5. Uncertainty Analysis. 16. RESULTS NAD DISCUSSION. 25. 3.1. Return Flow Characteristics. 25. 3.2. Critical Conditions for Onset of Return Flow. 28. 3.3. Stabilization of Vortex Flow by Insertion of Blocks. 29. iii.
(8) CHAPTER 4. CONCLUSIONS REMARKS. REFERENCES. 57. 59. iv.
(9) LIST OF TABLES. Table 2.1. Summary of the uncertainty analysis.. Table 3.1. onset conditions for the onset of return flow in the duct with and without the presence of the blocks. v.
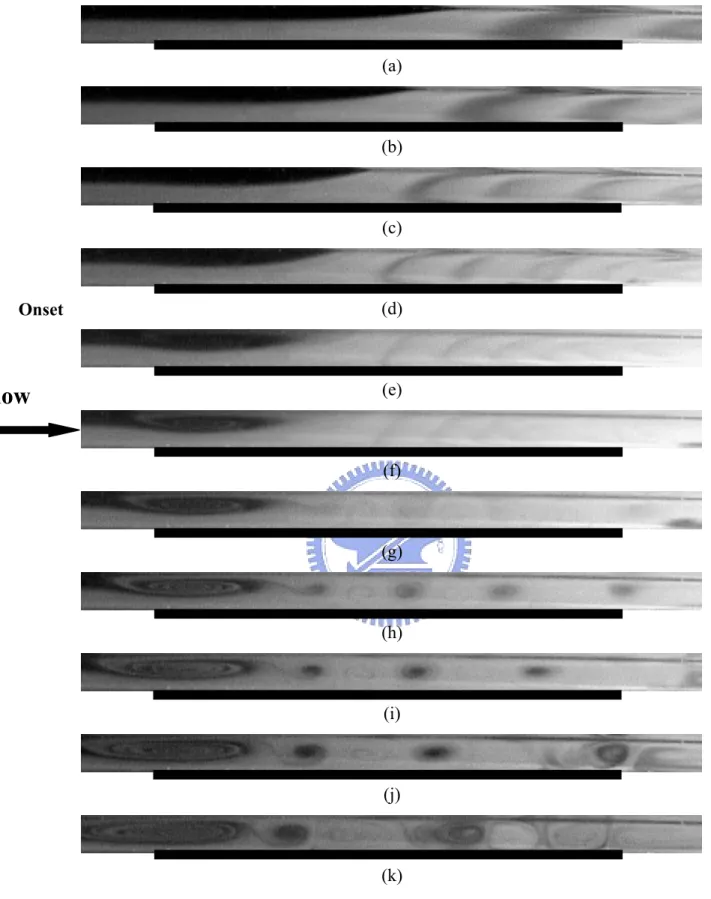
(10) LIST OF FIGURES Figs. 1.1. Schematic of the transverse rolls (a), representation of longitudinal rolls in the rectangular channel (b) and the formation of the return flow (c).. Figs. 1.2. Pictures from the characteristic flow visualization in a horizontal flat duct uniformly heated from below [1,2]. Figs. 2.1. Schematic of experimental apparatus and the chosen coordinate system for the test section.. Figs. 2.2. Diagram of test section (a) entire and (b) side view.. Figs. 2.3. Schematic diagrams showing the positions of the blocks inserted into the duct: (a) position (1), (b) position (2) and (c) position (3).. Figs. 2.4. Schematic of the test section from (a) top view and (b) cross-sectional view showing the design of the bottom plate.. Figs. 2.5. Locations of the thermocouples (a) and the seven concentric semi-circular heated sections (b).. Figs. 2.6. Comparison of the measured axial velocity profiles W/Wmax at the inlet of the test section with the analytical solution from Shah and London(1978) for Re=100 at (a)x=0.5 and (b)y=0.5.. Figs. 2.7. Comparison of the measured axial velocity profiles W/Wmax at the inlet of the test section with the analytical solution from Shah and London(1978) for Re=10 at (a)x=0.5 and (b)y=0.5.. Figs. 3.1. Side view photos taken at the middle vertical plane at steady or statistically stable state with the absence of the blocks for Ra=11,600 at (a) Re=50.0, (b) Re=40.0, (c) Re=30.0, (d) Re=25, (e) Re=20.0, (f) Re=17.5, (g) Re=15.0 (h) Re=12.5, (i) Re=10.0, (j) Re=7.5, and (k). vi.
(11) Re=5.0. Figs. 3.2. Side view flow photos taken at the middle of vertical plane at steady or statistically stable state with the curved blocks inserted at position (1) at Ra=11,600 for (a) Re=50.0, (b) Re=40.0, (c) Re=30.0, (d) Re=25.0, (e) Re=20.0, (f) Re=17.5, (g) Re=15.0 (h) Re=12.5, (i) Re=10.0, (j) Re=7.5, and (k) Re=5.0.. Figs. 3.3. Side view flow photos taken at the middle of vertical plane at steady or statistically stable state with the curved blocks inserted at position (1) at Ra=7,500 for (a) Re=50.0, (b) Re=40.0, (c) Re=30.0, (d) Re=25.0, (e) Re=20.0, (f) Re=17.5, (g) Re=15.0 (h) Re=12.5, (i) Re=10.0, (j) Re=7.5, and (k) Re=5.0.. Figs. 3.4. Side view flow photos taken at the middle vertical plane at steady or statistically stable state with the absence of the blocks for Ra=7,500 at (a) Re=50.0, (b) Re=40.0, (c) Re=30.0, (d) Re=25, (e) Re=20.0, (f) Re=17.5, (g) Re=15.0 (h) Re=12.5, (i) Re=10.0, (j) Re=7.5, and (k) Re=5.0.. Figs. 3.5. Top view flow photo taken at the middle horizontal plane y=1/2 (a) and side view flow photos taken at the selected vertical planes (b) at steady or statistical state for Re=10 and Ra=11,600 in the duct without the presence of the blocks. (The dark bars right below the side view photos signify the location of the heated circular disk). Figs. 3.6. Top view flow photo taken at the middle horizontal plane y=1/2 (a) and side view flow photos taken at the selected vertical planes (b) at steady or statistical state for Re=10 and Ra=11,600 in the duct with the blocks inserted at position (1). (The dark bars right below the side view photos. vii.
(12) signify the location of the heated circular disk) Figs. 3.7. Top view flow photo taken at the middle horizontal plane y=1/2 (a) and side view flow photos taken at the selected vertical planes (b) at steady or statistical state for Re=5 and Ra=7,500 in the duct without the presence of the blocks. (The dark bars right below the side view photos signify the location of the heated circular disk). Figs. 3.8. Top view flow photo taken at the middle horizontal plane y=1/2 (a) and side view flow photos taken at the selected vertical planes (b) at steady or statistical state for Re=5 and Ra=7500 in the duct with the blocks inserted at position (1). (The dark bars right below the side view photos signify the location of the heated circular disk). Figs. 3.9. Top view flow photo taken at the middle horizontal plane y=1/2 (a) and side view flow photos taken at the selected vertical planes (b) at steady or statistical state for Re=10 and Ra=16,050 in the duct without the presence of the blocks. (The dark bars right below the side view photos signify the location of the heated circular disk). Figs. 3.10. Top view flow photo taken at the middle horizontal plane y=1/2 (a) and side view flow photos taken at the selected vertical planes (b) at steady or statistical state for Re=10 and Ra=16,050 in the duct with the blocks inserted at position (1). (The dark bars right below the side view photos signify the location of the heated circular disk). Figs. 3.11. Side view flow photos taken at the central vertical plane x=0.5 at steady or statistically stable state in the duct with the blocks placed at position (3) at Ra=11,600 for (a) Re=50.0, (b) Re=40.0, (c) Re=30.0, (d) Re=25.0, (e) Re=20.0, (f) Re=17.5, (g) Re=15.0 (h) Re=12.5, (i). viii.
(13) Re=10.0, (j) Re=7.5, and (k) Re=5.0. Figs. 3.12. Side view flow photos taken at the central vertical plane x=0.5 at steady or statistically stable state in the duct with the blocks placed at position (2) at Ra=11,600 for (a) Re=50.0, (b) Re=40.0, (c) Re=30.0, (d) Re=25.0, (e) Re=20.0, (f) Re=17.5, (g) Re=15.0 (h) Re=12.5, (i) Re=10.0, (j) Re=7.5, and (k) Re=5.0.. Figs. 3.13. Side view flow photos taken at the central vertical plane x=0.5 at steady or statistically stable state in the duct with the blocks placed at position (3) at Ra=7,500 for (a) Re=50.0, (b) Re=40.0, (c) Re=30.0, (d) Re=25.0, (e) Re=20.0, (f) Re=17.5, (g) Re=15.0 (h) Re=12.5, (i) Re=10.0, (j) Re=7.5, and (k) Re=5.0.. Figs. 3.14. Side view flow photos taken at the central vertical plane x=0.5 at steady or statistically stable state in the duct with the blocks placed at position (2) at Ra=7,500 for (a) Re=50.0, (b) Re=40.0, (c) Re=30.0, (d) Re=25.0, (e) Re=20.0, (f) Re=17.5, (g) Re=15.0 (h) Re=12.5, (i) Re=10.0, (j) Re=7.5, and (k) Re=5.0.. Figs. 3.15. Top view flow photo taken at the middle horizontal plane y=1/2 (a) and side view flow photos taken at the selected vertical planes (b) at steady or statistical state for Re=10 and Ra=11,600 in the duct with the blocks inserted at position (3). (The dark bars right below the side view photos signify the location of the heated circular disk). Figs. 3.16. Top view flow photo taken at the middle horizontal plane y=1/2 (a) and side view flow photos taken at the selected vertical planes (b) at steady or statistical state for Re=10 and Ra=11,600 in the duct with the blocks inserted at position (2). (The dark bars right below the side view photos. ix.
(14) signify the location of the heated circular disk) Figs. 3.17. Top view flow photo taken at the middle horizontal plane y=1/2 (a) and side view flow photos taken at the selected vertical planes (b) at steady or statistical state for Re=5 and Ra=7,500 in the duct with the blocks inserted at position (3). (The dark bars right below the side view photos signify the location of the heated circular disk). Figs. 3.18. Top view flow photo taken at the middle horizontal plane y=1/2 (a) and side view flow photos taken at the selected vertical planes (b) at steady or statistical state for Re=5 and Ra=7500 in the duct with the blocks inserted at position (2). (The dark bars right below the side view photos signify the location of the heated circular disk). Figs. 3.19. Side view flow photos taken at the vertical central plane x=0.5 at steady or statistically stable state in the duct without and with the presence of the blocks for Ra=11,600 at Re=10.0 (a), 7.5 (b), and 5.0 (c). The blocks are inserted at position (1). (The dark bars right below the side view photos signify the location of the heated circular disk). Figs. 3.20. Top view flow photos taken at the middle horizontal plane y = 1/2 at steady or statistically stable state in the duct without the presence of the blocks for Ra=11,600 at Re =50.0 (a), 40.0 (b), 30.0 (c), 25.0 (d), 20.0 (e), 15.0 (f), 10.0 (g), and 5.0 (h).. Figs. 3.21. Top view flow photos taken at the middle horizontal plane y = 1/2 at steady or statistically stable state with the blocks inserted at position (1) for Ra = 11,600 at Re =50.0 (a), 40.0 (b), 30.0 (c), 25.0 (d), 20.0 (e), 15.0 (f), 10.0 (g), and 5.0 (h).. Figs. 3.22. Critical condition for the onset of the return flow in the duct with the. x.
(15) absence and the presence of the blocks. Figs. 3.23. Side view flow photos of vortex flow in duct without the blocks inserted at certain time instants at the statistical state and time records of air temperature at selected locations on the plane y=1/2 at x=0.5 (a), 0.4 (b) and 0.2 (c) for Re=10.1 and Ra=11,600. (The dark bars right below the side view photos signify the location of the heated circular disk). Figs. 3.24. Side view flow photos of vortex flow in duct with the blocks inserted at position (1) at certain time instants at the statistical state and time records of air temperature at selected locations on the plane y=1/2 at x=0.5 (a), 0.4 (b) and 0.2 (c) for Re=10.1 and Ra=11,600. (The dark bars right below the side view photos signify the location of the heated circular disk). Figs. 3.25. Side view flow photos of vortex flow in duct with the blocks inserted at position (3) at certain time instants at the statistical state and time records of air temperature at selected locations on the plane y=1/2 at x=0.5 (a), 0.4 (b) and 0.2 (c) for Re=10.1 and Ra=11,600. (The dark bars right below the side view photos signify the location of the heated circular disk). xi.
(16) NOMENCLATURE. A. Aspect ratio, b/d. b. Channel width. d. Channel height at the duct inlet. g. Gravitational acceleration. Gr. Grashof number, gβd3(Tcp- Tin)/ν2. l. Length of test section. Pr. Prandtl number, ν/α. Ra. Rayleigh number, βgd3∆T /αν. Re. Reynolds number, Wm d/ν. Gr/Re2. Buoyancy-to-inertia ratio. T. Temperature. Tin,Tcp. Temperature at inlet of the test section and the circular copper plates. ∆T. Tcp - Tin. t. Time, s. tp. Time of period. W. Velocity components in axial direction. Wr. Convection speed. Wm ,Wmax. Mean and maximum speeds of air in axial direction. X,Y,Z. Dimensional Cartesian coordinates. x,y,z. Dimensionless Cartesian coordinates scaled with b, d, l (X/b,Y/d,Z/l). α. Thermal diffusivity. β. Thermal expansion coefficient. xii.
(17) ν. Kinematic viscosity. λ. Pitch of vortex rolls. F, f. Dimensionless and dimensional frequency, F = f/(α/d2). Subscripts ave. Time averaged value. m. Mean value. xiii.
(18) CHAPTER 1 INTRODUCTION. The buoyancy driven vortex flow and the associated thermal characteristics in low speed mixed convective gas flow through a horizontal rectangular duct uniformly heated from below and cooled from above have been extensively investigated in the past. Various vortex flow patterns and their temporal-spatial structures over wide ranges of the Reynolds and Rayleigh numbers have been revealed. These investigations are mainly motivated by the important role the buoyancy driven flow plays in growing high quality thin semiconductor crystal film from the horizontal chemical vapor deposition (CVD) processes. In this particular flow configuration the buoyancy induced secondary flow patterns reported in the literature include the return flow, longitudinal, transverse and mixed vortex rolls and others [1,2]. Some of these roll patterns are illustrated in Figs.1.1 and 1.2. All of these secondary flows can cause a non-uniform vapor deposition on the silicon wafer and are harmful to the thin film properties. Especially, the existence of the return flow zone will block the forced flow to directly move over the substrate and blur the interface in the multi-layer thin film structure. Hence the return flow is most unwanted and unwelcome in the CVD processes [3,4]. Thus in industrial application, how to eliminate the return flow in the CVD processes is very important. It is noted that the previous studies reported in the literature on the buoyancy driven secondary flows in rectangular ducts mainly focus on a simple thermal boundary condition with the ducts heated uniformly from below and cooled uniformly from above. It is also well known that the buoyancy driven secondary flow is very sensitive to the geometry of heating surface, in addition to the Reynolds and Rayleigh numbers of the flow and the buoyancy-to-inertia ratio [5-9]. 1.
(19) Thus, the characteristics of the return flow revealed from the literature are expected to be somewhat different from those in the real CVD processes, where the heated wafers are circular in shape. In particular, the return flow will be complex, highly three-dimensional. In a recent study Thu and Lin [10] examined the return flow characteristics driven by a circular heated substrate embedded in the bottom of a rectangular duct with a low speed gas flow in it. In this continuing study we intend to eliminate or delay this return flow by inserting two curved blocks in the upstream section of the channel. The detailed characteristics of the return flow affected by the presence of the curved blocks inserted in front of the substrate will be examined in detail. Note that the insertion of the curved blocks into the channel reduces the cross sectional area of the channel in the streamwise direction. This in turn accelerates the flow in the streamwise direction so that the buoyancy–to-inertia ratio is reduced in that direction. In the literature, the flow acceleration was already found to be very effective in suppressing the buoyancy induced temporal flow oscillation in CVD processes and was able to produce a uniform epitaxial layer [11]. A model experiment is conducted in the present study to investigate the buoyancy driven return flow affected by the presence of the curved blocks for mixed convection of gas in a horizontal flat duct. Besides, the return flow related to the vortex flow induced in the downstream section of the duct will be examined. In the following the literature relevant to the present study of mixed convective secondary flow of gas in a horizontal rectangular duct heated from below is briefly reviewed.. 1.1 Characteristics of Longitudinal and Transverse Rolls For the fully developed laminar forced convection between two infinite horizontal parallel plates respectively heated uniformly from below and cooled. 2.
(20) uniformly from above, many different vortex flow patterns were predicted from theoretical linear stability and weak nonlinear analyses at slightly supercritical buoyancy beyond the onset of Rayleigh-Bénard convection. The critical Rayleigh number for the thermal instability has been found to be 1,708 by experimental measurement [12] and linear stability theory [6], which is independent of the Reynolds number of the flow. In a horizontal duct of finite transversal extension Nicolas et al. [13] showed that the critical Rayleigh number for the thermal instability was larger than 1708. This means that the mixed convection flow in the laterally bounded channel is more stable than that in the laterally unbounded one. They further explained the existence of a critical Reynolds number Re * at which the critical Rayleigh numbers Ra *L and Ra *T for the onset of longitudinal and transverse vortex rolls with their rotation axes respectively parallel and perpendicular to the forced flow direction start to bifurcate. For Re > Re * longitudinal rolls induced in the channel first at Ra *L . While for Re < Re * transverse rolls begin to prevail at Ra *T which is slightly lower than Ra *L . It is well know that Ra *L is independent of the Reynolds number Re, but the critical Rayleigh number Ra *T for the appearance of the transverse rolls increases with the Reynolds number. At low buoyancy-to-inertia ratio for Re > Re * steady longitudinal vortex flow prevails and spanwise temperature distribution is in regular sinusoidal shape, and the number of the vortex rolls is equal to the duct aspect ratio [14-16]. Kamotani and his colleagues [15] observed in a flow visualization experiment that at supercritical Rayleigh number the smoke in the flow after traveling certain distance over a heated surface and absorbing enough energy started to rise at some downstream location and deformed into a mushroom-shape due to the shearing action of the forced flow. When the mushroom-shape flow structure rose up to hit the top wall of channel, it bifurcated and developed into a longitudinal vortex flow in the downstream region. It is also well known that at a low 3.
(21) buoyancy-to-inertia ratio, the longitudinal vortex flow is characterized by the steady and regular vortex rolls parallel to the main stream direction with spanwise symmetry and all the rolls have the same size with their diameter nearly equal to the duct height. Besides, the transverse velocities of the longitudinal vortex flow were measured and found to be independent of the Reynolds number by Chiu et al. [17]. They also noted that when the boundary-to-inertia ratio was much smaller than one ( Gr. Re 2. <1), only. longitudinal rolls appeared in the duct. Moreover the critical wavelength of the thermal instability was determined by the duct height, not by thermal boundary layer thickness. The experiments from Chang et al. [16] indicate that the longitudinal rolls are always initiated first at the side wall of channel and the roll number is equal to or less than the aspect ratio of the duct. At a high buoyancy-to-inertia ratio, the longitudinal vortex flow becomes unsteady and some rolls split in certain period of time and later merge. Chang, Lin and their colleagues [1,2] observed unsteady snaking longitudinal vortex flow with splitting and merging nonperiodically in time. The buoyancy effects on both heat transfer and skin friction were shown to be a strong function of Prandtl number by Sparrow and Minkowycz [18] with the buoyancy growing more important at decreasing Prandtl number. The buoyancy driven transverse rolls only exist at relatively low Reynolds numbers and hence the buoyancy-to-inertia ratio is very high. The numerical analysis of the transverse vortex flow in a rectangular channel heated from below was conducted by Nicolas et al. [19]. At such high buoyancy-to-inertia ratio, the buoyancy driven thermals possess enough energy to merge with their spanwise neighbors in the upstream section of the duct, forming the transverse rolls [20]. The critical Rayleigh number for the onset of the transverse rolls Ra *T increases with the Reynolds number and varies with the aspect ratio of the duct and Prandtl number. Lin and his colleagues. 4.
(22) [16,21] combined flow visualization and temperature measurement to explore the transverse vortex rolls in a horizontal rectangular duct. Their studies show that the transverse rolls all have the same size with their diameters all nearly equal to the duct height and the influence of Reynolds and Rayleigh numbers on roll size are slight. Besides, the transverse vortex rolls move downstream at the same speed.. 1.2 Characteristics of Return Flows In a mixed convective gas flow through a bottom heated horizontal rectangular duct the return flow is known to form from the lift up of the gas by the strong upward buoyancy at the entrance of the duct when the cold gas enters the heated section of the duct. At the lower Reynolds number and the higher Rayleigh number the return flow cannot be ignored. Detailed flow visualization experiment has revealed that the cold flow from the upstream is forced to lift up first in the entrance region of the heated section forming a spanwisely elongated thermal. Later the thermal hits the top plate of the duct and bifurcates into two transverse recirculations with their axes of rotation perpendicular to the main flow [4]. The upstream transverse recirculation occupies the region above the leading edge of the heated plate, which rotates counter-clockwisely [4,22]. Another one travels downstream and rotates in the clockwise direction. Instead, the upstream transverse recirculation is designated as the return flow. Another one is the moving transverse roll. The return flow in the entrance region of horizontal chemical vapor deposition reactors was analyzed by Einset et al. [22] for top or bottom heated reactors. They showed that the appearance of the return flow was the result of changes in the relative magnitude of vertical and horizontal pressure gradients. The results from Makhviladze and Martjushenko [23] indicate that the critical Rayleigh number for the onset of the return flow is higher in a narrower. 5.
(23) reactor and the cooled side walls of the reactors can suppress the return flow formation. The existence of the return flow zone can also cause an increase in the film growth rate at the leading edge of the heated substrate and a decrease in the downstream region. This nonuniform vapor deposition is unwanted in the chemical vapor deposition (CVD) processes. A numerical investigation of the secondary flow in a MOCVD reactor by Cho and Choi [11] showed that modifying the shape of the top wall of the reactor could be very effective in eliminating the buoyancy driven recirculation and in suppressing the return flow formation by the mean flow acceleration. Visualization of the return flow structure in a mixed convective air flow over a heated circular plate embedded in the bottom of a horizontal flat duct was recently conducted by Tuh and Lin [10]. The spatial and temporal structures of the return flow were also examined in detail. In their experiment the Reynolds number of the flow is varied from 5 to 50 and the Rayleigh number from 4,000 to 16,000. they noted that the upstream return flow zone almost blocked the entire duct inlet. Criteria for the onset of the return flow was proposed and an empirical correlation was provided.. 1.3 Vortex Flow Stabilization In the chemical vapor deposition processes used to grow thin crystal films on semiconductor substrates, the buoyancy induced vortex flow is known to result in a nonuniform chemical vapor deposition, producing a thin crystal film of nonuniform thickness. Moreover, the unsteady vortex flow prevailed at high buoyancy will provoke a time–dependent deposition rate. In the past, means often adopted to suppress and stabilize the vortex flow are based on the acceleration of the forced flow [24]. Tseng et al. [25] experimentally showed that inclining the top plate of a. 6.
(24) rectangular duct uniformly heated from below could effectively and completely eliminate the irregular temporal flow oscillation. But the induced vortex flow can only be weakened to some degree. Besides, more vortex rolls would be induced due to the increase in the aspect ratio of the duct in the mean flow direction. Then, Gau et al. [26] revealed that in a convergent channel with an inclined top plate, the acceleration of the forced flow could delay the onset of thermal instability and effectively suppress the temperature fluctuation. Recently, Sun [27] investigated the stabilization of mixed convective gas flow in a sidewall inclined duct also heated from below. He found that the sidewall inclination only caused slight delay in the onset of the longitudinal and transverse rolls, and at high buoyancy-to-inertia ratio the flow stabilization was insignificant. Wang [28] examined the stabilization of mixed convective air flow over a heated circular plate embedded in the bottom of horizontal rectangular duct by inclining the bottom plate of the duct. The flow acceleration associated with the duct bottom inclination does result in more regular and stable longitudinal and transverse rolls, and causes some delay in the onset of the return flow.. 1.4 Objective of the Present Study The above literature review clearly indicates that the mixed convective vortex flow of gas in a horizontal rectangular duct uniformly heated from below has been extensively investigated. It is also known that the vortex flow is very sensitive to the geometry of the heated surface, which lead Tuh [4] to experimentally investigate the characteristics of mixed convective vortex flow driven by a circular heated plate. The results indicate that the induced vortex flow driven by the circular heated surface is somewhat different from that driven by the rectangular heated bottom. Moreover, Tuh and Lin [10] moved further to reveal the unique return flow structure driven by a. 7.
(25) circular heated plate, which was characterized by an incomplete circular roll around the upstream edge of the circular plate. In the present study, we continue the study of Tuh and Lin [10] by examining a simple method for the suppression of the return flow. More specifically, an experiment combining flow visualization and temperature measurement is conducted here to investigate the possible suppression of the buoyancy driven return flow by inserting curved blocks in front of the heated circular plate which is embedded in the bottom of a horizontal rectangular duct. Attention is focused on how the return flow is affected by the presence of the blocks which causes the acceleration of the forced flow in the entrance region of the heated section. Meanwhile, the effects of the blocks on the characteristics of the longitudinal and transverse vortex flows will also be explored. The effects of the Reynolds and Rayleigh numbers and the distance of the curved blocks from the heated plate on the vortex flow and the associated thermal characteristics will be examined in detail.. 8.
(26) Flow y x. (a) z. Flow. (b). Flow. (c). Fig.1.1. Schematic of the transverse rolls (a), representation of longitudinal rolls in the rectangular channel (b) and the formation of the return flow (c).. 9.
(27) Top view. End view. Flow. (a) Top view. Flow. Return flow. Side view. (b). Fig. 1.2 Pictures from the characteristic flow visualization in a horizontal flat duct uniformly heated from below [1,2]. 10.
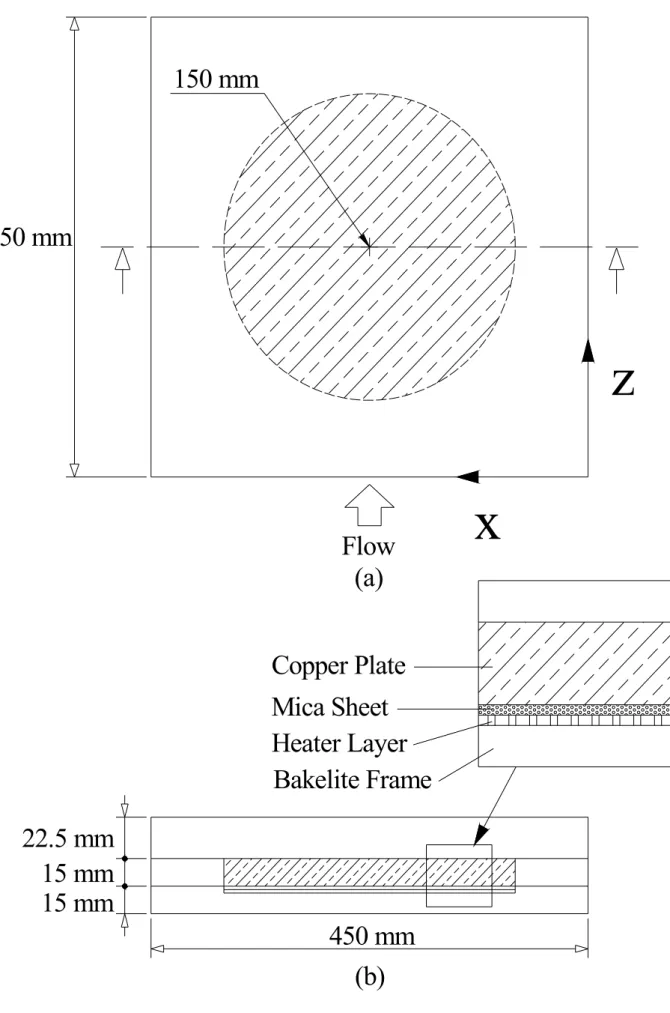
(28) CHAPTER 2 Experimental Apparatus and Procedures. An open-loop mixed convection apparatus with air flowing in a horizontal rectangular duct with a circular heated disk embedded in its bottom plate is established in the present study to explore the suppression of the buoyancy driven return flow by inserting two curved blocks in the section just upstream of the heated plate.. The major constituents and the associated experimental procedures are briefly. described in the following.. 2.1 Experimental Apparatus A sketch of the experimental apparatus established here for the mixed convective air flow over a heated circular disk embedded in the horizontal duct with two curved blocks inserted in the upstream section and the adopted coordinate system are schematically shown in Fig. 2.1. The apparatus begins with the air regulated from a 300 liter and 100 psi high-pressure tank. Then, the air passes through a settling chamber, a contraction nozzle and a developing channel before entering the test section. After leaving the test section, the air is sent through an exhaust section and discharged into the ambient. The test section of the experimental system has a cross section of 22.5 mm in height and 450 mm in width, providing an aspect ratio of A=20, and has a total length of 450 mm. In the developing section of the duct two curved blocks also of 22.5 mm in height are installed in the region near the duct sides just upstream of the heated plate so that the cross section of the duct is narrowed and the forced flow is 11.
(29) accelerated in this region. The chosen geometry of the blocks symmetric and their positions in the duct are schematically illustrated in Figs. 2.2and 2.3. The blocks are both 600 mm long and the curved surface of the left block (Fig. 2.2(a)) can be represented by the equation f ( z ′) = −3.68 z ′ 4 + 1.65 z ′ 3 − 0.26 z ′ 2 + 0.35 z ′ , here z ′ is measured from the upstream tip of the block indicated in Fig. 2.2(b) and has a unit of meter. Moreover, the position of the blocks is characterized by the longitudinal distance between the throat of the blocked section and the most upstream point of the heated circular plate, as illustrated in Fig. 2.3. Not that the blocks are placed at three different positions. The side and top walls of the duct are constructed of 10-mm thick transparent acrylic plates to allow for the visualization of vortex flow patterns. The bottom of the test section is a thick flat bakelite plate embedded with a 15-mm thick, high purity circular copper plate of 300 mm in diameter to model a 12-inch semiconductor substrate. The upper surfaces of the bakelite and copper plates are kept at the same horizontal level so that the air flow does not experience any step when moving over the copper plate. To obtain the uniform plate temperature, the heating elements attached onto the lower surface of the copper plate are divided concentrically into seven semi-circular zones and the heater for each zone is independently controlled by a GW GPC 3030D laboratory power supply. Besides, a mica sheet is placed between the copper plate and heating elements to prevent the electric current leaking to the copper plate (Figs. 2.4 ). A good control of the flow condition upstream of the test section is essential in the experiment. More specifically, at the inlet of the loop the working fluid (air) is driven by a 7.5 hp air compressor and sent through a dryer installed with water vapor and oil filters. This dry air then moves into the high-pressure tank. To proceed with the experiment, the air flow is further controlled by a pressure regulator and its volume flow rate is measured by Brooks 5850E and/or 5851E flow controllers both 12.
(30) having an accuracy of ±1%. These two flow controllers individually operate in the ranges of 0 to 10 and 0 to 50 liter/min. Through a flexible tube, the air enters the settling chamber, in which four fine-mesh screens, a divergent buffer section, a honeycomb and another four fine-mesh screens are installed in sequence to reduce the turbulence in the air flow. The air turbulence was further suppressed by passing the air through a contraction nozzle with a contraction ratio of 44:1, which provides a nearly uniform velocity at the inlet of the developing section. The developing section is 1400 mm in length, approximately 62 times of the duct height. This insures the flow to be fully developed before it arrives at the section containing the blocks for Re≤100. An insulated outlet section of 450 mm long is added to the test section to reduce the effects of the disturbances from discharging the air flow to the ambient. The developing section and outlet sections are both made of 10-mm thick acrylic plate, whereas the settling chamber and contraction nozzle are made of stainless steel SS-304 plates. The settling chamber, developing section, test section and outlet section are all thermally insulated with a 20-mm thick Superlon insulator and the entire loop is fixed on a rigid supporting frame. Visualization of the buoyancy driven vortex flow in the test section is realized by injecting smoke at some distance ahead of the settling chamber. The smoke is produced by a smoke generator, which is a cubic space with the incense burned in it. By keeping the smoke concentration at a suitable level, the incense particles can be illuminated by a plane light sheet from a 550 Watt overhead projector. With an adjustable knife edge a sharp contrast could be achieved between the duct walls and smoke. The flow photos from the top, side and end views of the test section can then be taken. The exposure time is about 1/125 second in taking the photos. The temperature of the heated copper plate is measured by 17 calibrated and electrically insulated T-type thermocouples embedded at selected locations in the plate 13.
(31) (Fig. 2.5). The thermocouple beads are fixed at about 1 mm from the upper surface of the copper plate through the small holes drilled from the back side of the plate. A T-type thermocouple is also used to measure the inlet air temperature at locations just upstream of the test section. The signals from the thermocouples are recorded by the Hewlett-Packard 3852A data acquisition system with a resolution of ±0.05℃. To measure the temperature distribution of the air flow in the test section, a thermocouple probe is inserted from the downstream end of the test section. The probe is supported by a three-way traversing device. More specifically, the thermocouple probe is an OMEGA (model HYP-O) mini hypodermic extremely small T-type thermocouple (33 gauge) implanted in a 1-inch long stainless steel hypodermic needle. This movable thermocouple probe can measure the time-average and instantaneous temperature of the flow. The temperature data are recorded when the flow reaches steady or statistically stable state, usually 5-6 hours after starting the test. It was noted that in all tests the maximum temperature differences between any two locations in the copper plate were below 0.1℃. The error in the temperature difference between the copper surface and the air at the duct inlet is estimated to be within ±0.1℃.. 2.2 Analysis of Time-average and Instantaneous Air Temperature The time-average temperature distributions in the air flow are obtained by averaging 1000-3000 sampled data at each detection point. The period of the sampling time may be different for different cases. Most importantly, the period has to be long enough to capture all the slowest temperature oscillations in the air flow. The response time of the thermocouple is about 0.12 second and the sampling rate is about 5 Hz in 14.
(32) the transient temperature measurement. This sampling rate is high enough for the present low Reynolds number mixed convection experiment.. 2.3 Preliminary Investigations of Flow Field In order to confirm the fully developed condition at the entrance of the test section, measurements using a hot-wire anemometer (DANTEC probe Type 55P01 with 56C17 CTA bridge) in connection with a HP data acquisition system (the Hewlett-Packard VXI series-E1411B multimeter and E-1347A multiplexers) for the inlet velocity profiles are conducted. For calibrating the hot wire, the pipe-flow method that the probe is placed in the center of a fully developed laminar pipe flow is used. The total volume flow rate is estimated and the pipe center velocity is calculated from the parabolic distribution. Figures 2.6 and 2.7 respectively show the measured inlet velocity profiles in the rectangular duct with the absence of the blocks along the vertical centerline at x=0.5 and horizontal centerline at y=0.5 for two cases with Re=100 and 10 with no heat input to the circular copper plate. The measured data are in good agreement with the analytical results given by Shah and London [29]. The turbulence level of the inlet stream is also given in the figures and is all within 1%. This implies that the effects of the free stream turbulence on the mixed convective flow characteristics are moderate.. 2.4 Experimental Procedures For convenience, experiments are designated according to the Reynolds and Rayleigh numbers based on the inlet conditions. In each test the flow controller is first set at the predetermined level to impose a steady flow through the entire test section. The power supplies are then turned on to raise the copper disk temperature. Usually, it 15.
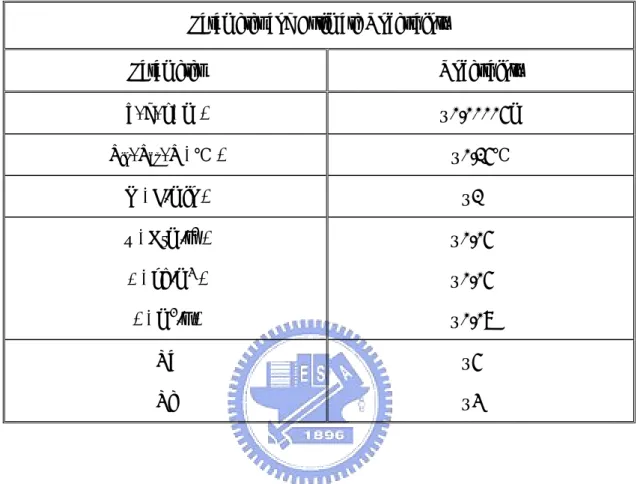
(33) takes about 3 hours for the Rayleigh number to be raised to the test point and another 2 hours are needed to maintain the vortex flow at steady or statistically stable state. The steady state is ascertained by insuring that the variation in the instantaneous temperature measured in the flow from each thermocouple be less than ±0.1℃ for a period of at least 25 minutes. The above choice of the steady state criterion is in accordance with the fact that the measured background temperature disturbances in the flow are found to be slightly less than ±0.1℃. On the other hand, the statistically stable state is considered to be reached when the variation of the time-average temperature in the flow is within ±0.1℃ for more than 25 minutes. After the steady or statistically stable state is reached, we start the temperature measurement and flow visualization.. 2.5 Uncertainty Analysis Uncertainties in the Rayleigh number Ra, Reynolds number Re and other independent parameters are estimated in the light of the standard procedures proposed by Kline and McClintock [30]. The uncertainties of the thermophysical properties of air are included in the analysis. The fundamental thermophysical properties of the working fluid (air) are α=0.22 (cm2/s), β=0.0034 (1/K), ν=0.162 (cm2/s) and Pr=0.74 at 30℃ and 0.997 bar. The fluid properties are further corrected based on the temperature and pressure detected at the inlet of the test section. In addition, the deviation of temperature among the detecting points in the circular copper plate and the control unsteadiness are also accounted for in the evaluation of the data uncertainties. The uncertainties of various parameters are summarized in Table 2.1.. 16.
(34) Table 2.1 Summary of the uncertainty analysis. Parameter and Estimate Uncertainty Parameter. Uncertainty. b, d, l ( m ). ±0.00005m. Tin, Tcp, T ( ℃ ). ±0.15℃. Q ( L/min ). ±1 %. µ ( N·m/s2 ). ±0.05 %. ρ ( kg/m3 ). ±0.05 %. ν ( m2/s ). ±0.07 %. Ra. ±5 %. Re. ±3 %. 17.
(35) TOP VIEW Curved blocks Developing Channel 1400 mm. Settling Chamber & Nozzle 1932 mm. 700 mm. 900 mm. Test Section 450 mm. Outlet Section 500 mm. x. 450 mm. z. Screen Honeycomb. Camera. SIDE VIEW Overhead Projector Camera. Test section. Screen Honeycomb 295 mm 495 mm. Air Flow. Camera. 22.5 mm. 1932 mm. 1400 mm. Overhead Projector. 450 mm. 500 mm. Circular Three-way Pipe Settling Chamber Developing Channel Test Outlet Section Traversing Device Diameter 70 & Nozzle Section mm Air 0 ~ 50 slpm Pressure Oil Water Compressor Smoke Generator Flowmeter Regulator Filter Filter. 90 Liter. Air Flow. 0 ~ 10 slpm. Valve. Fig. 2.1. Air Dryer Air Tank Tank 300 300 Liter Liter. Schematic of experimental apparatus and the chosen coordinate system for the test section. 18.
(36) Y X. Flow. Z. (a). 450mm. Flow. 225mm. 600mm. z′. Fig. 2.2 Diagram of test section (a) entire and (b) top view. 19.
(37) Flow 125 mm. (a) Position (1). Flow. (b) Position (2). Flow 100 mm. (c) Position (3) Fig.2.3. Schematic diagrams showing the positions of the blocks inserted into the duct: (a) position (1), (b) position (2) and (c) position (3). 20.
(38) 150 mm. 450 mm. z Flow (a). x. Copper Plate Mica Sheet Heater Layer Bakelite Frame 22.5 mm 15 mm 15 mm 450 mm (b) Fig. 2.4 Schematic of the test section from (a) top view and (b) cross-sectional view showing the design of the bottom plate. 21.
(39) 35mm 17. 12. 16 70mm. 8 13. 7. 3. 4. 2. 1 5. 9. 105mm 11 140mm. 6. 150mm 14 ". 15. 10 " means thermocouple is embeded here. (a). 45mm 70mm. 1. 105mm. 2. 150mm. 3 4 5. 6 7. (b) Fig. 2.5. Locations of the thermocouples (a) and the seven concentric semi-circular heated sections (b). 22.
(40) 1.00. Ana lytical fully developed profile 0.80. y. 0.60. (W' ). 2 1/ 2. Wm. ○. Local Velocity. △. Turbulence Intensity. W/Wmax. × 10. 0.40. 0.20. 0.00. 0.00. 0.20. 0.40. 0.60. 0.80. 1.00. (a) 1.00. 0.80. x. 0.60. (W' ). 2 1/ 2. Wm. W/Wmax. × 10. 0.40. 0.20. 0.00 0.00. 0.20. 0.40. 0.60. 0.80. 1.00. (b). Fig. 2.6 Comparison of the measured axial velocity profiles W/Wmax at the inlet of the test section with the analytical solution from Shah and London (1978) for Re = 100 at (a) x = 0.5 and (b) y = 0.5. 23.
(41) Analytical fully developed profile. 1.00. Local Velocity Turbulence Intensity 0.80. 0.60. (W' ). 2 1/ 2. y. Wm. W/Wmax. × 10. 0.40. 0.20. 0.00. 0.00. 0.20. 0.40. 0.60. 0.80. 1.00. (a) 1.00. 0.80. x. 0.60. (W' ). 2 1/ 2. Wm. 0.40. W/Wmax × 10. 0.20. 0.00. 0.00. 0.20. 0.40. 0.60. 0.80. 1.00. Fig. 2.7 Comparison of the measured axial velocity profiles W/Wmax at the inlet of the test section with the analytical solution from Shah and London (1978) for Re = 10 at (a) x = 0.5 and (b) y = 0.5. 24.
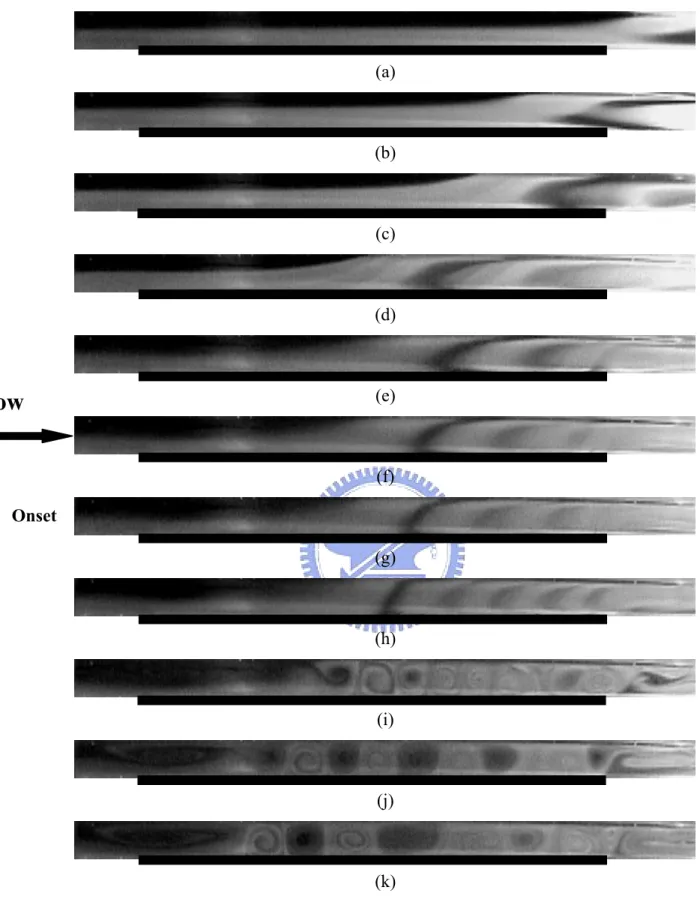
(42) CHAPTER 3 RESULTS NAD DISCUSSION Selected results obtained here are presented in the following to illustrate how the buoyancy induced return and vortex flows in the duct are affected by the main flow acceleration resulting from the insertion of the curved blocks. In particular, we compare the side and top view flow photos taken from the duct with and without presence of the blocks for various cases. In this investigation the Reynolds number of the flow is varied from 5 to 50 and Rayleigh number from 7,500 to 19,800. The ranges of the Re and Ra chosen above are in accordance with those encountered in the real CVD processes [31].. 3.1 Return Flow Characteristics To manifest the effects of the block insertion on the return flow, the side view flow photos taken at the middle vertical plane in the test section (x=0.5) at steady or statistically stable state for the Rayleigh number of 11,600 for various Reynolds numbers are shown in Figs. 3.1 and 3.2 respectively for the duct without and with the presence of the blocks. The blocks are located at position (1), as indicated in Fig. 2.3 (a). The photos taken at the middle vertical plane are chosen to be presented here simply because the return flow is strongest at this plane, as already known in the previous study [10]. The results in Fig. 3.1 for the case with the absence of the blocks indicate that at the high Reynolds numbers of 40 and 50 the buoyancy-to-inertia ratio Gr. Re 2. is low and the flow is forced convection dominated. The flow stream over the. heated plate shown in Figs. 3.1 (a) and (b) is only slightly deflected upwards and is not reversed. No return flow zone is detected. For the lower Re of 30 and 25, Figs. 3.1. 25.
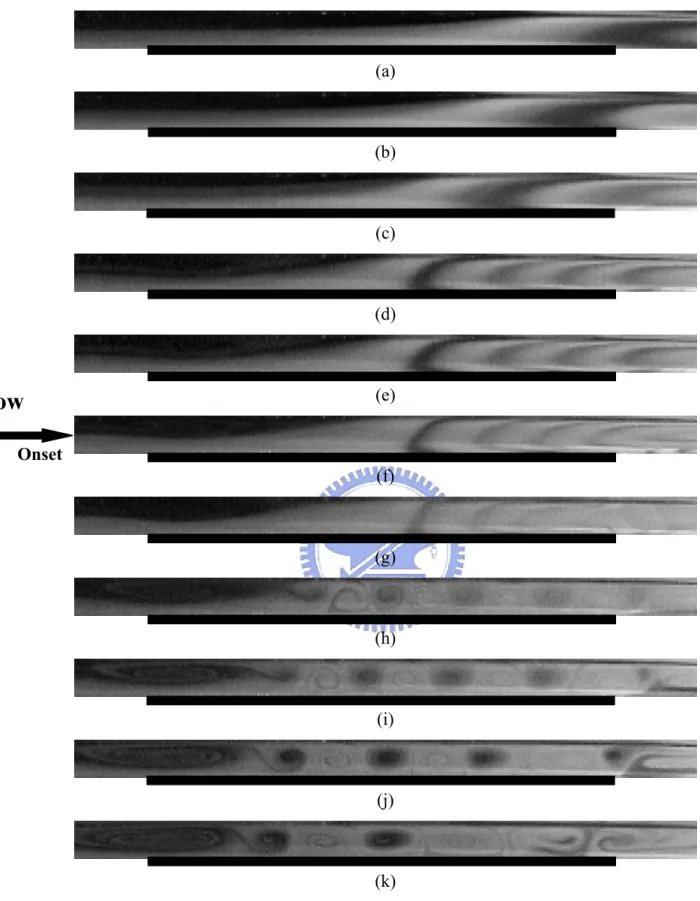
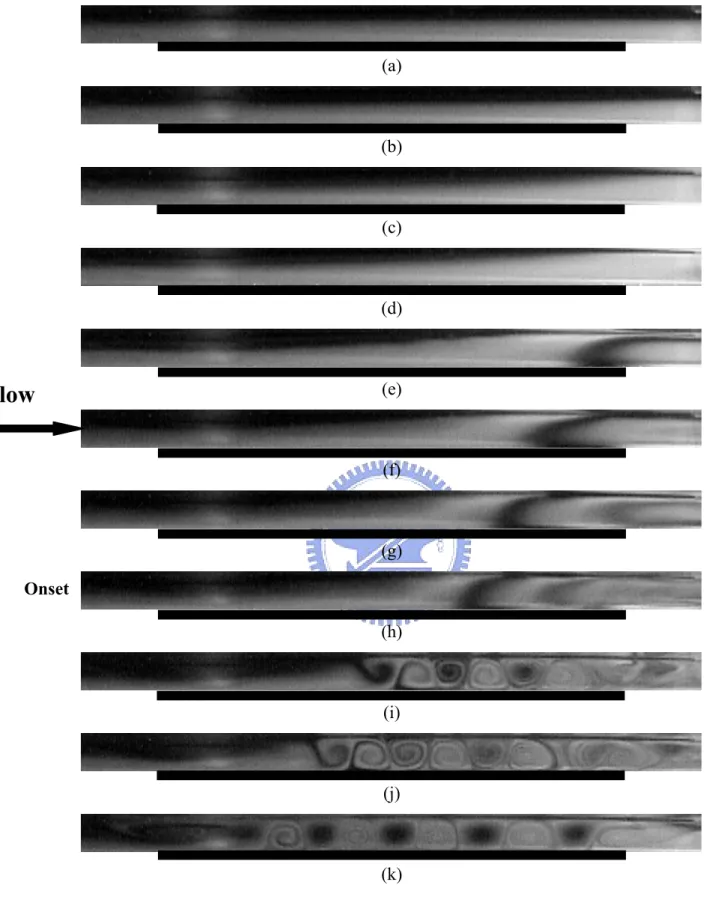
(43) (c)-(d) show that the buoyancy is still not able to reverse the forced flow and a uni-directional flow also prevails in the duct. Now as the Reynolds number is lowered to 20, a very small return flow zone is seen in the region right above the upstream portion of the heated plate near the top of the duct (Fig. 3.1 (e)). A close inspection of the complete set of the flow photos from our flow visualization experiment reveals that at this Rayleigh number the return flow starts to appear in the duct at Re=22.7. For a further reduction of the Reynolds number the return flow strengthens and occupies a larger region (Figs. 3.1 (f)-(h)). The growth of the return flow zone in the vertical and axial directions with the reduction in the Reynolds number is relatively significant. At the low Reynolds number of 5.0 the return flow is so large as to nearly block the inlet of the duct (Fig. 3.1 (k)). It should be mentioned here that some L-rolls and T-rolls also exist in the downstream half of the duct (Figs. 3.1 (d)-(k)). The characteristics of these rolls affected by the blocks will be examined later. When the blocks are inserted into the duct, the resulting flow acceleration causes the flow in the test section to be uni-directional over a wider range of the Reynolds number, as evident from the results in Fig. 3.2. The return flow is clearly seen only for Re≦15.0. More specifically, at this Ra the onset of the return flow takes place at Re=15.4 when the blocks are present. Thus we have a substantial delay in the return flow onset by the block insertion. By comparing the corresponding photos in Figs. 3.1 and 3.2 for the same Re, we further note that at the same buoyancy-to-inertia ratio the return flow is somewhat weaker in intensity and smaller in size with the presence of the blocks. To further illustrate the effects of the blocks on the return flow, the results for a lower Rayleigh number with Ra=7,500 are shown in Fig. 3.3 for the duct with the blocks inserted in it. At this lower Ra the return flow is significant at the lower Reynolds numbers for Re=7.5 and 5.0 (Figs. 3.3 (j) & (k)). When the blocks are. 26.
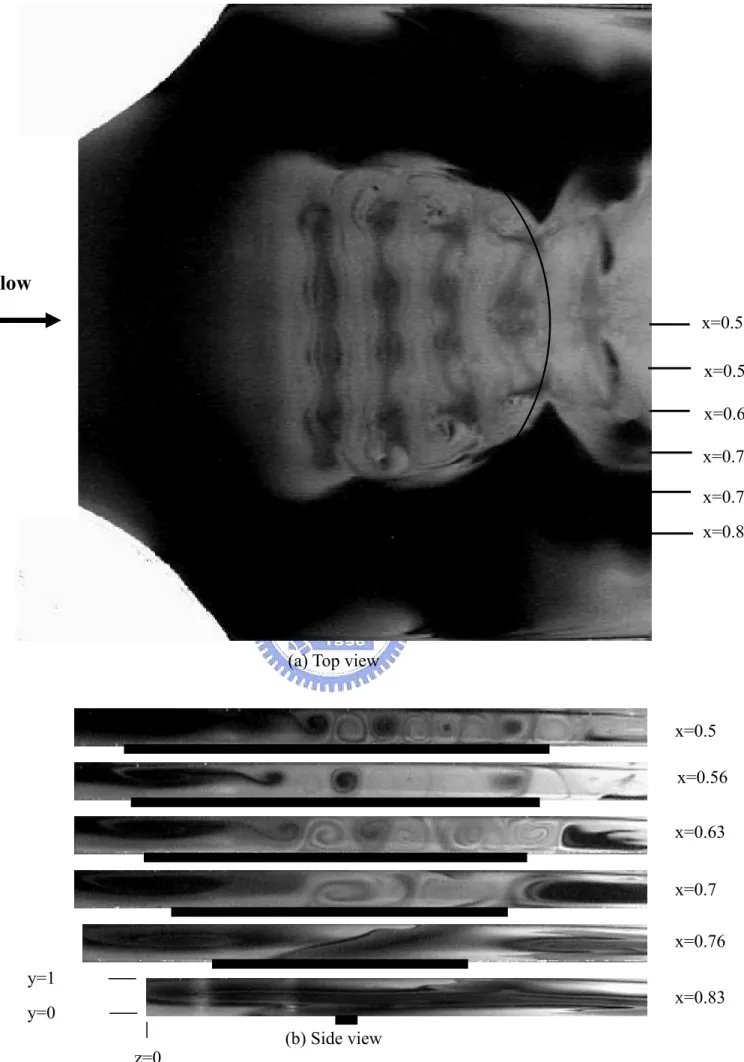
(44) removed from the duct, the return flow is initiated at the much higher Re of 17.5 (Fig. 3.4). The suppression of the return flow by the block insertion is also significant at this lower Rayleigh number. Next, we move further to examine how the spatial structures of the return flow and the vortex flow in downstream region are influenced by the insertion of the blocks. There are illustrated in Figs. 3.5 and 3.6 by presenting the top view and side view flow photos together at the statistically stable state for the case with Re=10.0 and Ra=11,600 respectively with the absence and presence of the blocks. Comparing the results in Figs. 3.5 and 3.6 clearly reveals that in the duct without the block insertion the return flow zone characterized by an incomplete circular roll around the upstream edge of the heated plate is rather large (Fig. 3.5 (a)) and the circulating flow in it is very strong (Fig. 3.5 (b)). Moreover, with the presence of the blocks a longer distance is needed for the transverse rolls to be generated by the heated plate (Fig. 3.6). Besides, the transverse rolls deform to a certain degree and are about to degenerate. Similar trend is noted for the effects of the block insertion on the buoyancy driven secondary flow in the duct for other cases with higher buoyancy-to-inertia ratios, as shown in Figs. 3.7-3.10. Then, the suppression of the return flow affected by the location of the blocks inserted into the duct is illustrated by comparing the side view flow photos taken at the central vertical plane shown in Figs. 3.2, 3.11 and 3.12 for various cases at the same Ra of 11,600 for various Re for the blocks placed at three different positions shown in Fig. 2.3. This comparison discloses that when the blocks are moved 25 mm closer toward the heated plate the onset of the return flow is delayed substantially from Re=15.4 to Re=10.0 and the return flow is significantly suppressed by the blocks placed closed to the heated plate. An opposite trend is noted when the blocks are moved away from the heated plate, are evident from the results in Figs. 3.2 and 3.12.. 27.
(45) The effects of the blocks-to-plate distance on the return flow for another cases at the lower Ra of 7,500 for various Re are shown in Figs. 3.3, 3.13 and 3.14. The results also indicate that moving the blocks closer to the heated plate can again produce more significant suppression of the return flow. A close inspection of the results for Ra=7,500 and 11,600 reveals that the effects of the blocks-to-plate distance on the return flow are more pronounced for the higher Rayleigh number. We further illustrate the influences of the block-to-plate distance on the spatial structures of the return flow and transverse rolls by showing the top and side view flow photos in Figs. 3.15 and 3.16 for Ra=11,600 & Re=10.0 and in Figs. 3.17 and 3.18 for Ra=7,300 & Re=5.0 for the blocks located at positions (2) and (3). The weakening of the return flow and transverse rolls by moving the blocks closer to the heated plate can be clearly seen especially from the side view flow photos. The suppression of the buoyancy driven secondary flow by the block insertion is more clearly shown in Fig. 3.19 by displaying the side view flow photos for the duct with and without the presence of the blocks together for Ra=11,600 at the same Reynolds numbers. Note that by inserting the blocks at position (1) the return flow is suppressed to become weaker in intensity and smaller in size. Finally, the effects of the block insertion on the buoyancy driven secondary flow in the duct are further illustrated by displaying the top view flow photos in Figs. 3.20 & 3.21 for Ra=11,600 at various Re with the absence and presence of the blocks. The results clearly show the significant delayed onset of the longitudinal and transverse rolls by the blocks inserted into the duct.. 3.2 Critical Conditions for Onset of Return Flow According to the data from the present experiment, the critical conditions for the. 28.
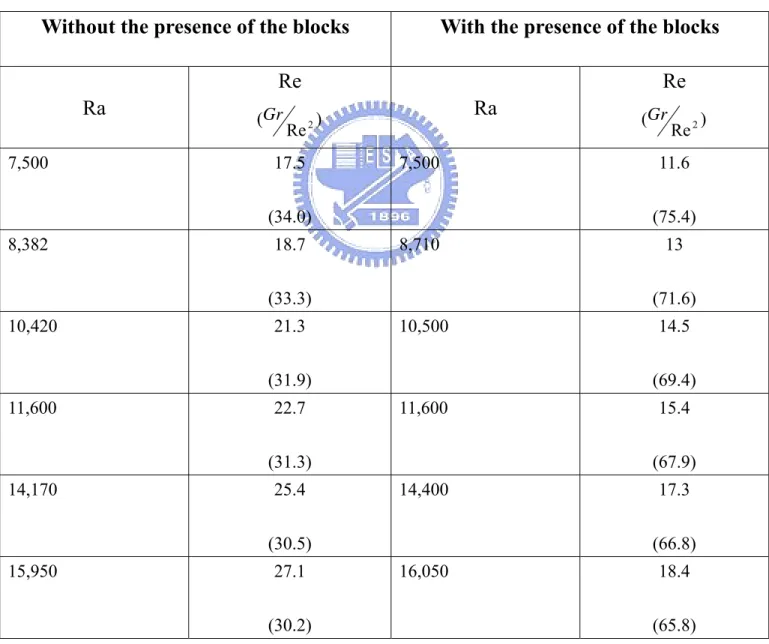
(46) onset of the return flow in the duct without the presence of the blocks and in the duct with the blocks inserted at position (1) are summarized in Table 3.1 and plotted in Fig. 3.22. The results clearly show the significant increase in the buoyancy-to-inertia ratio by the blocks insertion. Here the present onset data can be correlated empirically as. Gr. Re. 2. = 27.4 + 2043 Re −2. (3.1). for the absence of the blocks and. Gr Gr Gr. Re 2 Re 2 Re. 2. = 59.8 + 2047 Re −2. (3.2). = 46 + 3360 Re − 2. (3.3). = 61 + 4766 Re − 2. (3.4). for the presence of the blocks at the positions (1), (2) and (3) for the Reynolds and Rayleigh numbers at the duct inlet ranging respectively from 5.0 to 50.0 and from 7,500 to 19,800.. 3.3 Stabilization of Vortex Flow by Insertion of Blocks Finally, the transient flow oscillation at a high buoyancy-to-inertia ratio stabilized by the insertion of the blocks are illustrated by presenting the measured temperature variations with time at selected detection point at the mid-height of the duct in Figs. 3.23-3.25 respectively for the cases without the block insertion and with the blocks inserted at positions (1) & (3) for Re=10.1 and Ra=11,600. The results in Fig. 3.23 indicate that in the duct without the block insertion the flow oscillates periodically with time in the downstream half of the duct where the moving transverse rolls dominate. Besides, the flow essentially oscillates at the same frequency but the oscillation amplitude varies with the locations. Now as the blocks are inserted into the duct at position (1), the flow oscillates at a smaller amplitude (Fig. 3.24), but the. 29.
(47) oscillation frequency remains unchanged. Moreover, near the duct sides the amplitudes of the flow oscillation are very small (Fig. 3.24(c)). When the blocks are moved closer to the heated plate and located at position (3), the amplitude of the flow oscillation is rather small at all detection points, as evident from the data given in Fig. 3.25. In fact, the flow can be regarded as steady. Thus, the flow is completely stabilized by the block insertion.. 30.
(48) Table 3.1. onset conditions for the onset of return flow in the duct with and without the presence of the blocks. Without the presence of the blocks. With the presence of the blocks Re. Re Ra 7,500. (Gr. Re. 2. Ra. ). 17.5. 7,500. (34.0) 8,382. 18.7. 8,710. 21.3. 10,500. 22.7. 11,600. 14.5. 15.4 (67.9). 25.4. 14,400. (30.5) 15,950. 13. (69.4). (31.3) 14,170. 11.6. (71.6). (31.9) 11,600. Re 2. (75.4). (33.3) 10,420. (Gr. 17.3 (66.8). 27.1. 16,050. (30.2). 18.4 (65.8). 31. ).
(49) 32.
(50) (a). (b). (c). Onset. Flow. (d). (e). (f). (g). (h). (i). (j). (k). Fig. 3.1. Side view flow photos taken at the middle vertical plane at steady or statistically stable state with the absence of the blocks for Ra=11,600 at (a) Re=50.0, (b) Re=40.0, (c) Re=30.0, (d) Re=25, (e) Re=20.0, (f) Re=17.5, (g) Re=15.0 (h) Re=12.5, (i) Re=10.0, (j) Re=7.5, and (k) Re=5.0.. 33.
(51) (a). (b). (c). (d). Flow. (e). (f) Onset (g). (h). (i). (j). (k). Fig. 3.2. Side view flow photos taken at the middle of vertical plane at steady or statistically stable state with the curved blocks inserted at position (1) at Ra=11,600 for (a) Re=50.0, (b) Re=40.0, (c) Re=30.0, (d) Re=25.0, (e) Re=20.0, (f) Re=17.5, (g) Re=15.0 (h) Re=12.5, (i) Re=10.0, (j) Re=7.5, and (k) Re=5.0.. 34.
(52) (a). (b). (c). (d). Flow. (e). (f). (g). (h) Onset (i). (j). (l). Fig. 3.3. Side view flow photos taken at the middle vertical plane at steady or statistically stable state with the curved blocks inserted at position (1) at Ra=7,500 for (a) Re=50.0, (b) Re=40.0, (c) Re=30.0, (d) Re=25.0, (e) Re=20.0, (f) Re=17.5, (g) Re=15.0 (h) Re=12.5, (i) Re=10.0, (j) Re=7.5, and (k) Re=5.0.. 35.
(53) (a). (b). (c). (d). Flow. (e). Onset (f). (g). (h). (i). (j). (k). Fig. 3.4. Side view flow photos taken at the middle vertical plane at steady or statistically stable state with the absence of the blocks for Ra=7,500 at (a) Re=50.0, (b) Re=40.0, (c) Re=30.0, (d) Re=25, (e) Re=20.0, (f) Re=17.5, (g) Re=15.0 (h) Re=12.5, (i) Re=10.0, (j) Re=7.5, and (k) Re=5.0.. 36.
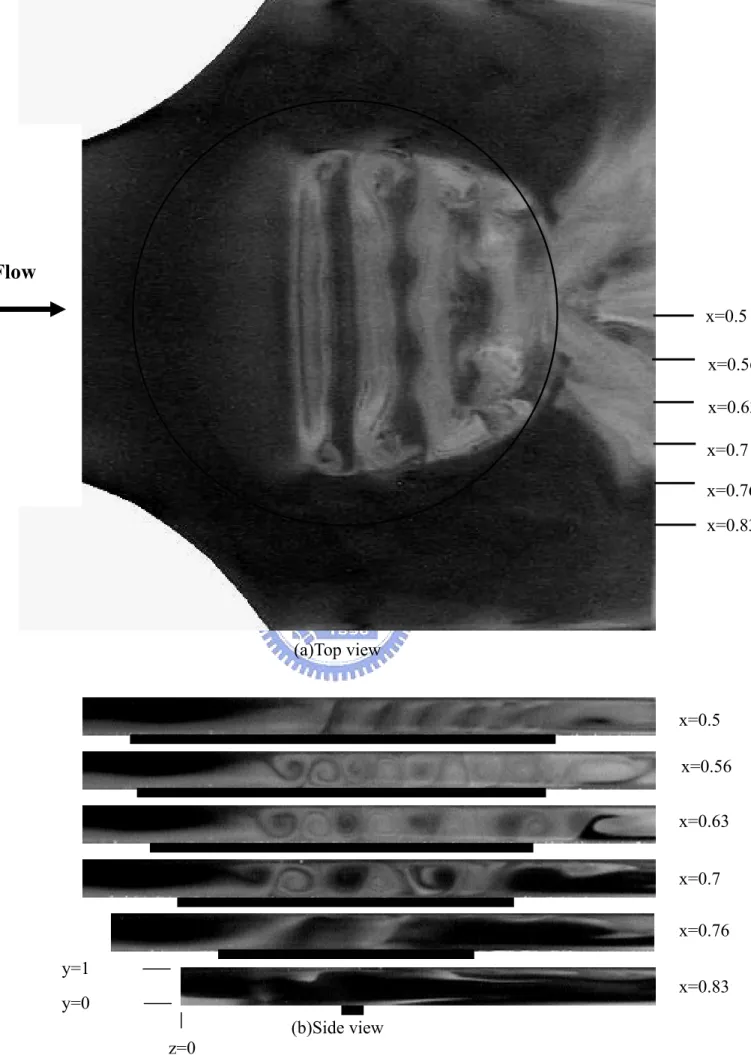
(54) Flow x=0.5 x=0.56 x=0.63 x=0.7 x=0.76 x=0.83. (a)Top view. x=0.5 x=0.56 x=0.63 x=0.7 x=0.76 y=1. x=0.83. y=0 (b)Side view z=0 Fig. 3.5. Top view flow photo taken at the middle horizontal plane y=1/2 (a) and side view flow photos taken at the selected vertical planes (b) at steady or statistical state for Re=10 and Ra=11,600 in the duct without the presence of the blocks. (The dark bars right below the side view photos signify the location of the heated circular disk) 37.
(55) Flow x=0.5 x=0.56 x=0.63 x=0.7 x=0.76 x=0.83. (a) Top view. x=0.5 x=0.56 x=0.63 x=0.7 x=0.76 y=1. x=0.83. y=0 z=0 Fig. 3.6. (b) Side view. Top view flow photo taken at the middle horizontal plane y=1/2 (a) and side view flow photos taken at the selected vertical planes (b) at steady or statistical state for Re=10 and Ra=11,600 in the duct with the blocks inserted at position (1). (The dark bars right below the side view photos signify the location of the heated circular disk) 38.
(56) Flow x=0.5 x=0.56 x=0.63 x=0.7 x=0.76 x=0.83. (a)Top view. X=0.5 x=0.5 X=0.56 x=0.56 X=0.63 x=0.63 X=0.7 x=0.7 X=0.76 x=0.76 y=1. X=0.83 x=0.83. y=0 z=0. (b)Side view. Fig.3.7 Top view flow photo taken at the middle horizontal plane y=1/2 (a) and side view flow photos taken at the selected vertical planes (b) at steady or statistical state for Re=5 and Ra=7,500 in the duct without the presence of the blocks. (The dark bars right below the side view photos signify the location of the heated circular disk) 39.
(57) Flow x=0.5 x=0.56 x=0.63 x=0.7 x=0.76 x=0.83. (a)Top view. x=0.5 x=0.56 x=0.63 x=0.7 x=0.76 y=1. x=0.83. y=0 (b)Side view z=0. Fig. 3.8 Top view flow photo taken at the middle horizontal plane y=1/2 (a) and side view flow photos taken at the selected vertical planes (b) at steady or statistical state for Re=5 and Ra=7500 in the duct with the blocks inserted at position (1). (The dark bars right below the side view photos signify the location of the heated circular disk) 40.
(58) Flow x=0.5 x=0.56 x=0.63 x=0.7 x=0.76 x=0.83. (a)Top view. x=0.5 x=0.56 x=0.63 x=0.7 x=0.76 y=1. x=0.83. y=0 (b)Side view z=0 Fig.3.9. Top view flow photo taken at the middle horizontal plane y=1/2 (a) and side view flow photos taken at the selected vertical planes (b) at steady or statistical state for Re=10 and Ra=16,050 in the duct without the presence of the blocks. (The dark bars right below the side view photos signify the location of the heated circular disk) 41.
(59) Flow x=0.5 x=0.56 x=0.63 x=0.7 x=0.76 x=0.83. (a)Top view. x=0.5 x=0.56 x=0.63 x=0.7 x=0.76 y=1. x=0.83. y=0 (b)Side view z=0 Fig. 3.10. Top view flow photo taken at the middle horizontal plane y=1/2 (a) and side view flow photos taken at the selected vertical planes (b) at steady or statistical state for Re=10 and Ra=16,050 in the duct with the blocks inserted at position (1). (The dark bars right below the side view photos signify the location of the heated circular disk) 42.
(60) (a). (b). (c). (d). Flow. (e). (f). (g). (h) Onset (i). (j). (k). Fig.3.11. Side view flow photos taken at the central vertical plane x=0.5 at steady or statistically stable state in the duct with the blocks placed at position (3) at Ra=11,600 for (a) Re=50.0, (b) Re=40.0, (c) Re=30.0, (d) Re=25.0, (e) Re=20.0, (f) Re=17.5, (g) Re=15.0 (h) Re=12.5, (i) Re=10.0, (j) Re=7.5, and (k) Re=5.0. 43.
(61) (a). (b). (c). (d). Flow. (e). Onset (f). (g). (h). (i). (j). (k). Fig. 3.12. Side view flow photos taken at the central vertical plane x=0.5 at steady or statistically stable state in the duct with the blocks placed at position (2) at Ra=11,600 for (a) Re=50.0, (b) Re=40.0, (c) Re=30.0, (d) Re=25.0, (e) Re=20.0, (f) Re=17.5, (g) Re=15.0 (h) Re=12.5, (i) Re=10.0, (j) Re=7.5, and (k) Re=5.0. 44.
(62) (a). (b). (c). (d). Flow. (e). (f). (g). (h) Onset (i). (j). (k). Fig. 3.13. Side view flow photos taken at the central vertical plane x=0.5 at steady or statistically stable state in the duct with the blocks placed at position (3) at Ra=7,500 for (a) Re=50.0, (b) Re=40.0, (c) Re=30.0, (d) Re=25.0, (e) Re=20.0, (f) Re=17.5, (g) Re=15.0 (h) Re=12.5, (i) Re=10.0, (j) Re=7.5, and (k) Re=5.0. 45.
(63) (a). (b). (c). (d). Flow. (e). (f). (g) Onset (h). (i). (j). (k). Fig. 3.14. Side view flow photos taken at the central vertical plane x=0.5 at steady or statistically stable state in the duct with the blocks placed at position (2) at Ra=7,500 for (a) Re=50.0, (b) Re=40.0, (c) Re=30.0, (d) Re=25.0, (e) Re=20.0, (f) Re=17.5, (g) Re=15.0 (h) Re=12.5, (i) Re=10.0, (j) Re=7.5, and (k) Re=5.0. 46.
(64) Flow x=0.5 x=0.56 x=0.63 x=0.7 x=0.76 x=0.83. (a)Top view. x=0.5 x=0.56 x=0.63 x=0.7 x=0.76 y=1. x=0.83. y=0 (b)Side view z=0. Fig. 3.15 Top view flow photo taken at the middle horizontal plane y=1/2 (a) and side view flow photos taken at the selected vertical planes (b) at steady or statistical state for Re=10 and Ra=11,600 in the duct with the blocks inserted at position (3). (The dark bars right below the side view photos signify the location of the heated circular disk) 47.
(65) Flow x=0.5 x=0.56 x=0.63 x=0.7 x=0.76 x=0.83. (a)Top view. x=0.5 x=0.56 x=0.63 x=0.7 x=0.76 y=1. x=0.83. y=0 z=0. (b)Side view. Fig. 3.16 Top view flow photo taken at the middle horizontal plane y=1/2 (a) and side view flow photos taken at the selected vertical planes (b) at steady or statistical state for Re=10 and Ra=11,600 in the duct with the blocks inserted at position (2). (The dark bars right below the side view photos signify the location of the heated circular disk) 48.
(66) Flow x=0.5 x=0.56 x=0.63 x=0.7 x=0.76 x=0.83. (a)Top view. x=0.5 x=0.56 x=0.63 x=0.7 x=0.76 y=1. x=0.83. y=0 (b)Side view z=0 Fig. 3.17. Top view flow photo taken at the middle horizontal plane y=1/2 (a) and side view flow photos taken at the selected vertical planes (b) at steady or statistical state for Re=5 and Ra=7,500 in the duct with the blocks inserted at position (3). (The dark bars right below the side view photos signify the location of the heated circular disk) 49.
(67) Flow x=0.5 x=0.56 x=0.63 x=0.7 x=0.76 x=0.83. (a)Top view. x=0.5 x=0.56 x=0.63 x=0.7 x=0.76 y=1. x=0.83. y=0 z=0. (b)Side view. Fig. 3.18 Top view flow photo taken at the middle horizontal plane y=1/2 (a) and side view flow photos taken at the selected vertical planes (b) at steady or statistical state for Re=5 and Ra=7500 in the duct with the blocks inserted at position (2). (The dark bars right below the side view photos signify the location of the heated circular disk) 50.
(68) Flow. Flow. Without the presence of the blocks. With the presence of the blocks. (a) Re=10.0. Flow. Flow. Without the presence of the blocks. With the presence of the blocks. (b) Re=7.5. Flow. Flow. Without the presence of the blocks. With the presence of the blocks. (c) Re=5.0. Fig.3.19. Side view flow photos taken at the vertical central plane x=0.5 at steady or statistically stable state in the duct without and with the presence of the blocks for Ra=11,600 at Re=10.0 (a), 7.5 (b), and 5.0 (c). The blocks are inserted at position (1). (The dark bars right below the side view photos signify the location of the heated circular disk) 50.
(69) Flow. Flow. (a). (e). (b). (f). (c). (g). (d). (h). Fig. 3.20 Top view flow photos taken at the middle horizontal plane y = 1/2 at steady or statistically stable state in the duct without the presence of the blocks for Ra=11,600 at Re =50.0 (a), 40.0 (b), 30.0 (c), 25.0 (d), 20.0 (e), 15.0 (f), 10.0 (g), and 5.0 (h). 51.
(70) Flow. Flow. (a). (e). (b). (f). (c). (g). (d). (h). Figs.3.21 Top view flow photos taken at the middle horizontal plane y = 1/2 at steady or statistically stable state with the blocks inserted at position (1) for Ra = 11,600 at Re =50.0 (a), 40.0 (b), 30.0 (c), 25.0 (d), 20.0 (e), 15.0 (f), 10.0 (g), and 5.0 (h). 52.
(71) 120. Experimental data (with the blocks inserted at position (1)) Experimental data (with the blocks inserted at position (2)) Experimental data (with the blocks inserted at position (3)) Experimental data (with the absence of the blocks) Correlations. 100. 80. Gr/Re2. 60. 40. 10. 15. 20. 25. 30. Re. Fig. 3.22 Critical condition for the onset of the return flow in the duct with the absence and the presence of the blocks.. 53.
(72) z=0.17. z=0.21. z=0.26. z=0.3. z=0.4. z=0.35. z=0.45. Θ 1.0 0.5 0.0. 1. 1. 1. 1. 1. 1. 1. 2.62°C 0.5. 0.5. 0. 0.5. 0 0. 0. 55. 110. 100. 0.5. 0 0. 55. 110. 0 0. 55. 110. 0.02. 0.00. 55. 110. 0.0. 0. 0.1. 0.2. 0.3. 0.4. 0 0. f1 = 0.16. 55. 110. f1 = 0.17. 0.02. 0.1. 0.2. 0.3. 0.4. 55. 110. t (sec). f1 = 0.17. 0.02. 0. 0 0. 0.5. 0. 0.01. 0.01. 0. 0.5. 0. 110. 0.01. 0. 0. 55. 0.02. 0.01. 0.5. 0 0. f1 = 0.16. 0.02. 0.01. 0.5. 0 0. f1 = 0.16. 0.03. PSD. 0.5. 0. 0.5. 0.1. 0.2. 0.3. 0.4. 0. 0.5. 0.1. 0.2. 0.3. 0.4. 0.5. (a) x=0.5. Θ 1.0 0.5 0.0. 1. 1. 1. 1. 1. 1. 1. 0.5. 0.5. 0.5. 0.5. 0.5. 0.5. 0.5. 0. 0. 0. 0. 55. 110. 100. 0. 0. 55. 110. 0. 0. 55. 110. 0. 0. 55. f1 = 0.16. 0.03. 0.02. PSD. 110. 0. 0. 55. 110. f1 = 0.16. 0.02. 0.00. 0.0 0. 0.1. 0.2. 0.3. 0.5. 0.4. 110. 0. 55. 110. 0. 55. 110. t (sec). f1 = 0.17. 0.02. 0. 0. 0. 55. 0.01. 0.01. 0.01. 0. 0. 0. 0.5. 0.1. 0.2. 0.3. 0.4. 0. 0.5. 0.1. 0.2. 0.3. 0.4. 0.5. (b) x=0.4. Θ 1.0. 1. 1. 1. 1. 1. 1. 1. 0.5. 0.5. 0.5. 0.5. 0.5. 0.5. 0.5. 0.5. 0.0. 0. 0. 0. 0. 55. 110. 0. 0. 55. 100. 110. 0. 0. 55. f1 = 0.16. 0.03. 0.02. PSD. 110. 55. 110. f1 = 0.16. 0.02. 0.0 0. 0.1. 0.2. 0.3. 0.4. 0.5 0.5. 55. 110. f1 = 0.16. 0.02. 0. 0.1. 0.2. 0.3. 0.4. 0.5. 0. 0. 55. 110. f1 = 0.17. 0.02. 0.01. 0. 0. 0. 0. 0. 0. 0.01. 0.01. 0.01. 0.00. 0. 0. 0. 0.1. 0.2. 0.3. 0.4. 0.5. 0. 0.1. 0.2. 0.3. 0.4. 0.5. (c) x=0.3 Fig. 3.23. Side view flow photos of vortex flow in duct without the blocks inserted at certain time instants at the statistical state and time records of air temperature at selected locations on the plane y=1/2 at x=0.5 (a), 0.4 (b) and 0.2 (c) for Re=10.1 and Ra=11,600. (The dark bars right below the side view photos signify the location of the heated circular disk) 54. t (sec).
(73) z=0.17. z=0.21. z=0.26. z=0.3. z=0.4. z=0.35. z=0.45. Θ 1.0. 1. 1. 1. 1. 1. 1. 1. 2.62°C. 0.5. 0.5. 0.0. 0.5. 0. 0.5. 0 0. 55. 0. 110. 100. 0.5. 0 0. 55. 110. 0 0. 0.03. PSD. 55. 110. 55. 110. 0.0 0. 0.1. 0.2. 0.3. 0. 0.5. 0.1. 0.2. 0.3. 0.4. 0 0. f1 = 0.20. 55. 110. 0. f1 = 0.19. 0.02. 0.1. 0.2. 0.3. 0.4. 110. t (sec). f1 = 0.19. 0.01. 0. 0 0. 0.5. 55. 0.02. 0.01. 0. 0.5. 0.4. 110. 0.01. 0. 0. 55. 0.02. 0.01. 0.5. 0 0. f1 = 0.20. 0.02. 0.01. 0.5. 0 0. f1 = 0.22. 0.02. 0.00. 0.5. 0. 0.5. 0.1. 0.2. 0.3. 0.4. 0. 0.5. 0.1. 0.2. 0.3. 0.4. 0.5. (a) x=0.5. Θ 1.0 0.5. 1. 1. 1. 1. 1. 1. 1. 0.5. 0.5. 0.5. 0.5. 0.5. 0.5. 0.5. 0.0. 0. 0. 0. 0. 0. 55. 110. 100. 0. 55. 110. 0 0. 55. 0. 110. 55. f1 = 0.20. 0.03. 0.02. PSD. 0. 110. 55. 110. 0. 0.1. 0.2. 0.3. 0.4. 0.5 0.5. 110. 0. f1 = 0.19. 0.1. 0.2. 0.3. 0.4. f1 = 0.19. 0 0. 0.5. 110. 0.01. 0 0. 55. 0.02. 0.01. 0. 0.0. 55. 0.02. 0.01. 0. t (sec). 0. 0. f1 = 0.20. 0.02. 0.01. 0.00. 0. 0. 0.1. 0.2. 0.3. 0.4. 0. 0.5. 0.1. 0.2. 0.3. 0.4. 0.5. (b) x=0.4. Θ 1.0. 1. 1. 1. 1. 1. 1. 1. 0.5. 0.5. 0.5. 0.5. 0.5. 0.5. 0.5. 0.5 0.0. 0. 0. 0. 0. 55. 110. 100. 0. 55. 110. 0. 0. 0. 55. 110. 55. 110. 0. 55. 110. 0 0. 55. 110. 0. 55. 110. f1 = 0.20. 0.03. 0.02. PSD. 0. 0. 0. 0.01. 0.00. 0. 0.0 0. 0.1. 0.2. 0.3. 0.4. 0.5 0.5. (c) x=0.3 Fig. 3.24. Side view flow photos of vortex flow in duct with the blocks inserted at position (1) at certain time instants at the statistical state and time records of air temperature at selected locations on the plane y=1/2 at x=0.5 (a), 0.4 (b) and 0.2 (c) for Re=10.1 and Ra=11,600. (The dark bars right below the side view photos signify the location of the heated circular disk) 55. t (sec).
(74) z=0.17. z=0.21. z=0.26. z=0.3. z=0.4. z=0.35. z=0.45. Θ 1.0. 1. 0.5. 0.5. 0.0. 1. 1. 1. 1. 1. 1. 2.62°C 0.5. 0. 0.5. 0 0. 55. 0. 110. 100. 0.5. 0 0. 55. 0.5. 0. 110. 0. 55. 110. 0.5. 0 0. 55. 110. 0.5. 0 0. 55. 110. 0 0. 55. 110. 0. 55. 110. 0. 55. 110. 0. 55. 110. t (sec). (a) x=0.5. Θ 1.0. 1. 1. 1. 1. 1. 1. 1. 0.5. 0.5. 0.5. 0.5. 0.5. 0.5. 0.5. 0.5. 0.0. 0. 0 0. 55. 110. 0 0. 55. 110. 0 0. 55. 110. 0 0. 55. 110. 0 0. 55. 110. 0 0. 55. 110. 100. 0. t (sec). (b) x=0.4. Θ 1.0. 1. 1. 1. 1. 1. 1. 1. 0.5. 0.5. 0.5. 0.5. 0.5. 0.5. 0.5. 0.5. 0.0. 0. 0 0. 0. 55. 110. 0 0. 55. 110. 0 0. 55. 110. 0 0. 55. 110. 0 0. 55. 110. 0 0. 55. 110. 100. (c) x=0.3 Figs.3.25. Side view flow photos of vortex flow in duct with the blocks inserted at position (3) at certain time instants at the statistical state and time records of air temperature at selected locations on the plane y=1/2 at x=0.5 (a), 0.4 (b) and 0.2 (c) for Re=10.1 and Ra=11,600. (The dark bars right below the side view photos signify the location of the heated circular disk) 56. t (sec).
(75) CHAPTER 4 CONCLUDING REMARKS Experimental flow visualization and temperature measurement have been conducted to explore how the buoyancy induced return flow is affected by the insertion of two curved blocks in a mixed convective air flow over a heated circular disk embedded in the bottom of a horizontal rectangular duct. In the experiment the Reynolds number is varied from 5 to 50 and Rayleigh number from 7,500 to 19,800 for the blocks inserted at three different locations. The major results obtained here can be summarized as follows: (1) When the blocks are inserted into the duct the return flow is significantly suppressed and the associated main flow acceleration causes the flow in the test section to become uni-directional over a wider range of the Reynolds number for a given Rayleigh number. (2) At the same buoyancy-to-inertia ratio the return flow is somewhat weaker in intensity and smaller in size with the presence of the blocks in the duct. (3) The presence of the blocks causes a substantial delayed onset of the transverse and longitudinal rolls, and the transverse rolls deform to a certain degree. (4) The suppression of the return flow is more significant when the blocks are placed closer to the heated plate. (5) The critical conditions for the onset of the return flow in the duct without and with the presence of the blocks are procured and empirical correlations are proposed. (6) The insertion of the blocks greatly suppresses the temporal oscillation of the flow. As the blocks are placed closer to the heated plate the buoyancy driven unstable flow oscillation can be completely suppressed. During the course of this investigation, it is recognized that the elimination of the 57.
(76) return flow is relatively important in the MOCVD processes. Simple methods to delay and even eliminate the return flow still need to be developed, aside from that considered in the present study.. 58.
(77) REFERENCES 1.. J.T. Lir, M.Y. Chang and T.F. Lin, Vortex Flow Patterns near Critical State for Onset of Convection in Air Flow through a Bottom Heated Horizontal Flat Duct, Int. J. of Heat and Mass Transfer 44 (2001) 705-719.. 2.. T.C. Cheng, J.T. Lir and T.F. Lin, Stationary Transverse Rolls and U-rolls in Limiting low Reynolds number Mixed Convective Air Flow near the Convective Threshold in a Horizontal Flat Duct, Int. J. Heat Mass Transfer 45 (2002) 1211-1227. 3.. Vladimir S. Ban, Transport Phenomena Measurements in Epitaxial Reactor, J.Electrochemical Soc. 125 (1978) 317-320.. 4. J.L. Tuh, Experimental Study on the Mixed Convective Air Flow Structure Driven by a Heated Circular Plate Embedded in the Bottom of a Horizontal Flat Duct, Ph.D.S. Thesis, Nation Chiao Tung University, Hsinchu, Taiwan, 2003. 5. H. Zhang, X.Y. Huang, H.S. Li and L.P. Chua, Flow Pattern and Heat Transfer Enhancement in low-Reynolds-Rayleigh-number Channel Flow, Applied Thermal Engineering 22 (2002) 1277-1288. 6. Y. Kamotani. and S. Ostrach, Effect of Thermal Instability on Thermally Developing Laminar Channel Flow, Int. J. Heat Mass Transfer 98 (1976) 62-66. 7. E. L. Koschmeider and S. G. Pallas, Heat Transfer Through a Shallow Horizontal Convecting Fluid Layer, Int. J. Heat Mass Transfer 17 (1974) 991-1002. 8. Yasuo Mori and Yutaka Uchida., Forced Convection Heat Transfer between Horizontal Flat Plates, Int. J. Heat Mass Transfer l9 (1966) 803-817. 9. J.M. Luijkx and J. K. Platten and J. C. Legros, On the Existence of Thermoconvective Rolls, Transverse to a Superimposed Mean Poiseuille Flow, Int. J. Heat Mass Transfer 24 (1981) 1287-1291.. 59.
數據

+7
相關文件
三角板、橢圓形板、正方形板、圈圈板、圓 規、量角器……等,但 不含具有桌面功能之 圖板 或製圖板),並得自備
PVC 管加工可使用彈簧及已繪製尺寸之模板(僅限平面式,不得有立體成型)
Hamilton 以很多方式從跟均曲率流 (mean curvature flow) 做類比 得到關於他的 Ricci 流的直觀。曲線縮短流 (curve shortening flow) 已被 Grayson 研究過,而
Our model system is written in quasi-conservative form with spatially varying fluxes in generalized coordinates Our grid system is a time-varying grid. Extension of the model to
In this section, we consider a solution of the Ricci flow starting from a compact manifold of dimension n 12 with positive isotropic curvature.. Our goal is to establish an analogue
The main interest in the interpretation and discussion of passages from the sutra is to get a clear picture of how women are portrayed in the sutra and to find out
and Dagtekin, I., “Mixed convection in two-sided lid-driven differentially heated square cavity,” International Journal of Heat and Mass Transfer, Vol.47, 2004, pp. M.,
An integrated photovoltaic /thermal (PV/T) air collector to collect hot air and drive air flow, and mixing the air flow from earth-air heat exchanger (EAHE) and hot air flow to
