國 立 交 通 大 學
經 營 管 理 研 究 所
博士論文
No. 108
納入自然資源投入之區域生產效率衡量
Measuring Regional Production Efficiency
with Natural Resource Inputs Considered
研 究 生:王世全
指導教授:胡均立 教授
國 立 交 通 大 學
經 營 管 理 研 究 所
博士論文
No. 108
納入自然資源投入之區域生產效率衡量
Measuring Regional Production Efficiency
with Natural Resource Inputs Considered
研 究 生:
王世全
研究指導委員會:
胡均立 教授
黃仁宏 教授
楊 千 教授
指導教授:
胡均立 教授
中 華 民 國 九 十 四 年 十 二 月
納入自然資源投入之區域生產效率衡量
Measuring Regional Production Efficiency with
Nature Resource Inputs Considered
研 究 生:王世全 Student: Wang, Shih-Chuan
指導教授:胡均立 Advisor: Hu, Jin-Li
國 立 交 通 大 學
經 營 管 理 研 究 所
博 士 論 文
A Dissertation
Submitted to Institute of Business and Management College of Management
National Chiao Tung University In Partial fulfillment of the Requirements
For the Degree of Doctor of Philosophy
in
Business and Management
December 2005
Taipei, Taiwan, Republic of China
納入自然資源投入之區域生產效率衡量
研究生:王世全
指導教授:胡均立 教授
國立交通大學經營管理研究所博士班
中 文 摘 要
持續的經濟發展仰賴充份自然資源的投入,然而許多重要的自然資
源皆有其供給的上限以及不可再生性。因此永續發展必須兼顧經濟發展
的幅度以及自然資源的消耗。自然資源的使用效率需要不斷提升以臻於
最佳化。本文納入能源及水資源,分別與勞動及資本存量形成經濟生產
的投入要素,並據以實證方式分析區域能源及水資源的使用效率。
本文利用資料包絡分析法,分析中國各區域能源消費的目標投入
量。再將此目標投入量除以實際投入量來建構出總要素能源效率 (TFEE)
指標。由於目標投入量即為擁有相同產出的最低投入量,此一能源效率
指標值將會介於 0 與 1 之間。在使用的投入產出模型中,國內生產毛額
(GDP) 為單一產出,而勞動、資本存量、能源消費量以及作為生質能代
理變數的可耕地面積為四個投入因素。研究分析 1995-2002 年間中國二
十九個行政區的能源使用效率。分析結果顯示此一新建構的總要素能源
效率指標較傳統的能源生產力效率指標更能顯現實際的結果。
本文亦探討中國各區域的水資源使用效率。中國的人均水資源量僅
i有世界平均值的四分之一,極度缺水的狀況將對過去二十年來快速發展
的經濟榮景產生隱憂。用水量調整率 (WATR) 指標同樣是以資料包絡分
析法所建構的生產效率前緣為基礎,納入水資源為投入要素分析而得。
本文分別對於各中國三十個行政區在 1997-2002 年間的生活用水及生產
用水效率依據此一新建構之指標進行分析。
在使用新建構能源及水資源效率指標的實證研究中,自然資源使用
效率值與人均收入的關係上,皆獲得與環境 Kuznets 曲線相符的 U 型曲
線。中國的中部地區具有最低的資源使用效率,而能源與水資源投入的
調整量更皆佔有中國全區總調整量的三分之二。高效率的生產方式以及
進步的技術需要引進及實行,從而改善其自然資源使用效率。
最後本文提出具有永續發展概念的綠色國家創新系統架構,主張現
有的國家創新系統應結合環境保護與資源保育的主旨,進而激勵相關的
創新與研發,防範可能的污染並以最佳效能來使用有限的自然資源。文
中美國及中國的個案分析闡述綠色國家創新系統的必要性以及此一系統
在不同國家環境下的可能架構。
關鍵詞:
資料包絡分析法 (DEA), 總要素能源效率 (TFEE), 用水量調整
率 (WATR), 綠色國家創新系統 (GNIS), 中國經濟, 能源投入,
水資源投入, 永續發展
iiMeasuring Regional Production Efficiency
with Natural Resource Inputs Considered
Student : Wang, Shih-Chuan Advisor : Dr. Hu, Jin-Li
Institute of Business and Management National Chiao Tung University
ABSTRACT
Economic growth can not sustain without sufficient input of natural resources, however most inevitable natural resources are finite and non-renewable. Sustainable development as an ultimate goal for the entire human beings relies on balance between consumption of these finite natural resources and level of economic growth. The efficiency of consuming these finite natural resources needs to be promoted to an optimal level. The empirical studies analyzing efficiency of energy and water consumption are made in this dissertation. Energy and water resources are considered as input factors in an economic production together with conventional inputs: labor employment and capital stock.
We employ methodology of data envelopment analysis (DEA) to find the target energy input of each region in China at each particular year. The index of total-factor energy efficiency (TFEE) is obtained with dividing the target energy input by the actual energy input. The value of this index will be between 0 and 1 since the founded target energy input is the minimum input level of maintaining the same output level. In our DEA model, labor, capital stock, energy consumption, and total sown area of farm crops used as a proxy of biomass energy are the four inputs and real GDP is the single output. This paper analyzes energy efficiencies of 29 administrative regions in China in period of 1995–2002 by using this newly introduced index. The conventional energy productivity ratio regarded as a partial-factor energy efficiency index is computed for comparison in contrast to TFEE; the latter appears fitting better to real cases.
This dissertation also brings water into consideration. Over the past two decades China has seen the fruit of its rapid economic growth, but problem of water shortage becomes severe behind this prosperous development scenario which could further jeopardize the country’s growth. The per capita amount of water resource is only one-fourth of the world’s average. The index of water adjustment target ratio (WATR) is established from a production frontier constructed by DEA as well that includes water as an input. Water efficiency of 30 regions in China during 1997-2002 is obtained from this newly constructed index with both residential and productive water use.
A U-shape curve is discovered that matches to environmental Kuznets curve. The U-shape curve is between both regional total-factor energy efficiency and total-factor water efficiency and per capita real income among regions of China. The central area has the worst efficiency ranking and total adjustment amount of both water and energy are around two-third of China’s total. High efficiency production processes and advanced technologies need to be adopted in the central area in order to improve its production efficiency with using natural resources.
Last, a conceptual framework of green national innovation system (GNIS) is introduced in this dissertation. The system combines existing national innovation systems with more innovations in title of environmental protection and preservation of natural resources. The related innovations and researches are therefore stimulated and formulated to prevent environmental pollutions at beginning stage. The consumption of natural resources is therefore promoted at the frontier of production efficiency. These are the core aspects of a GNIS. Case studies of the U.S. and China illustrate that the trend and necessity of a GNIS is regarded as further development to existing NIS. The distinct effective scenarios describe how this system works at different contexts.
Keywords : Data envelopment analysis (DEA), Total-factor energy efficiency (TFEE),
Water adjustment target ratio (WATR), Green national innovation system (GNIS), China economy, Energy input, Water input, Sustainable development
誌 謝
人生有夢、逐夢踏實。如願完成博士學位的喜悅與快活,實非筆墨
所能言喻。
首先必須感謝指導教授 胡均立博士在論文研究期間給予的指導:讓
我這個電機背景出身的門外漢,能夠一窺經濟與管理知識的博大精深;
更要感謝他的付出,時常為我的研究進度及論文修訂一起忙到深夜,才
使得個人的研究進度能夠有所突破。
同時感謝博士論文指導委員會師長 楊千博士以及 黃仁宏博士給予
的建議與鼓勵,使得論文研究的理論更為充實,研究的方向也益發明確。
特別要感謝口試委員 邱永和博士, 李育明博士, 邱俊榮博士以及
郭憲章博士的精闢意見,使得論文的內容與結構更加完備與詳實。
所上蕭慧娟小姐及林育萍小姐在論文格式及投稿期刊所提供的協
助,也要在此一併致謝。
內人詩雲的支持與體諒,讓我能夠全心投入研究;在論文資料的蒐
集以及編排上也助益良多。
感謝主恩賜的智慧與能力,引領我穿越重重的挑戰與困境。
最後要將博士學位的成果,獻給我敬愛的父親母親,感謝他們昔日
養育的辛勞,個人才能有今日的成果。
王世全 謹誌
中華民國九十四年十二月二十八日
vT
ABLE OF
C
ONTENTS
ABSTRACT ---i
ACKNOWLEDGEMENT---v
TABLE OF CONTENTS ---vi
LIST OF TABLES ---viii
LIST OF FIGURES ---ix
Chapter 1 INTRODUCTION ---1
1.1 REGIONAL PRODUCTIVITY WITH ENERGY INPUT CONCERNS -1 1.2 REGIONAL PRODUCTIVITY WITH WATER INPUT CONCERNS ---2
1.3 TOWARDS SUSTAINABILITY WITH INNOVATIONS ---4
Chapter 2 SUSTAINABLE REGIONAL DEVELOPMENT ---6
2.1 ENERGY EFFICIENCY AND SUSTAINABLE DEVELOPMENT ---7
2.2 ENERGY SOURCES IN CHINA ---9
2.3 WATER EFFICIENCY AND SUSTAINABLE DEVELOPMENT ---10
2.4 WATER RESOURCES IN CHIN ---11
Chapter 3 REGIONAL DESCRIPTION AND DATA COLLECTION---13
3.1 REGIONAL DESCRIPTION ---13
3.2 DATA COLLECTION ---15
3.2.1 REGIONAL ENERGY CONSUMPTION DATA IN CHINA ---15
3.2.2 REGIONAL WATER CONSUMPTION DATA IN CHINA ---16
Chapter 4 METHOD OF DATA ENVELOPMENT ANALYSIS (DEA) ---18
4.1 MEASURING TECHNICAL EFFICIENCY: THE DEA APPROACH -18 4.2 SLACK AND RADIAL ADJUSTMENTS ---20
4.3 THE ANALYSIS PROCESS ---21
Chapter 5 REGIONAL EFFICIENCY WITH ENERGY CONSIDERED ---23
5.1 DESCRIPTIVE STATISTICS ---23
5.2 REGIONAL TOTAL-FACTOR ENERGY EFFICIENCY ---25
5.3 TOTAL-FACTOR ENERGY EFFICIENCY IN AN AREA ---26
5.4 REGIONAL TOTAL ADJUSTMENTS OF ENERGY INPUT ---26
5.5 REGIONAL TFEE ---29
5.6 ENERGY EFFICIENCY VS. REGIONAL DEVELOPMENT ---31
5.7 COMPARISON TO PARTIAL-FACTOR ENERGY EFFICIENCIES --32
Chapter 6 REGIONAL EFFICIENCY WITH WATER CONSIDERED ---35
6.1 INDEX OF WATER ADJUSTMENT TARGET RATIO ---35
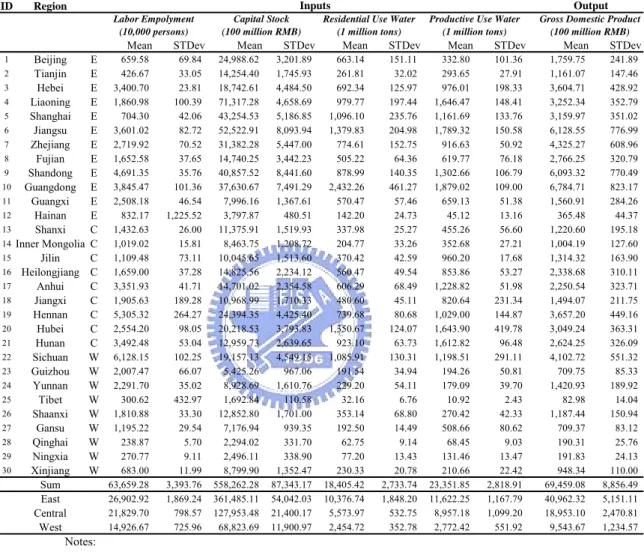
6.2 DESCRIPTIVE STATISTICS ---36
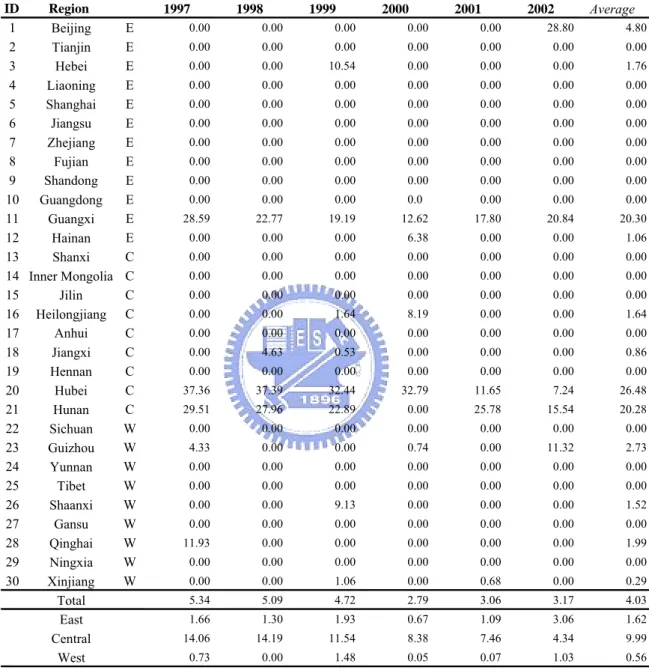
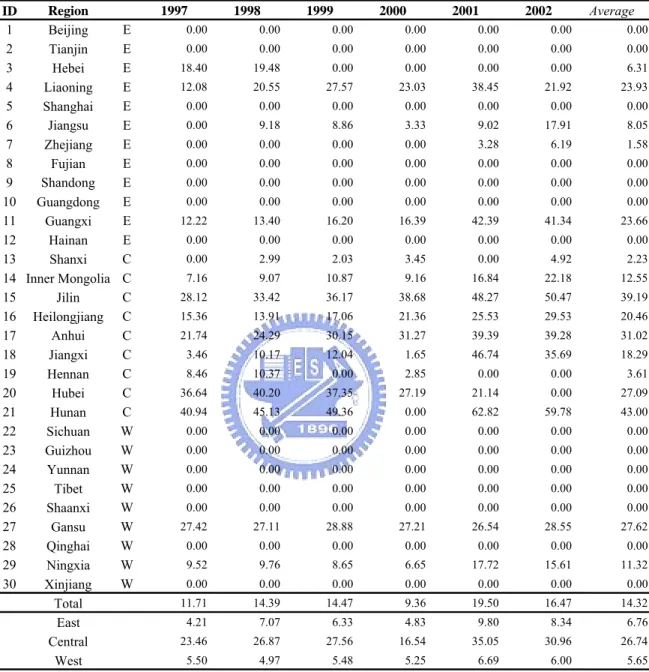
6.3 WATR OF RESIDENTIAL USE ---39
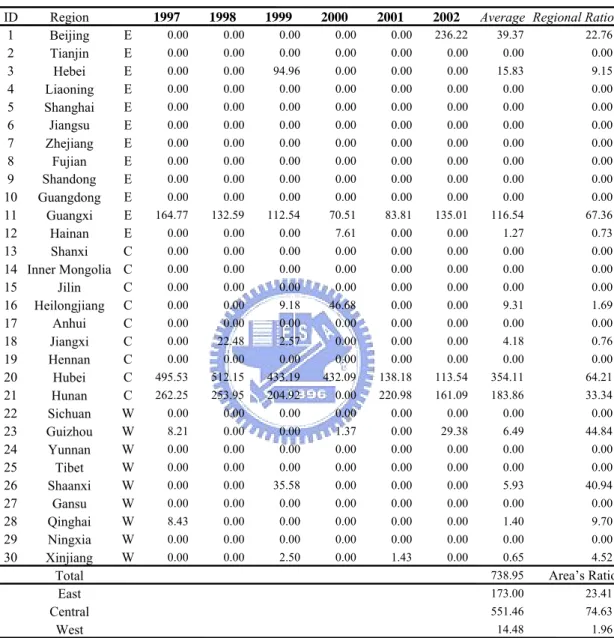
6.4 WATR OF PRODUCTIVE USE ---43
6.5 WATER EFFICIENCY VS. REGIONAL DEVELOPMENT ---47
Chapter 7 THE CONCEPTURAL FRAMEWORK FOR GNIS ---49
7.1 POLICY FORMULATION ---50
7.2 BASIC SCIENCE RESEARCH ---51
7.3 INDUSTRIAL APPLIED RESEARCH ---52
7.4 EDUCATION AND TRAINING ---53
7.5 CITIZEN ---53
7.6 KNOWLEDGE FLOW ---54
7.7 FINANCIAL FLOW ---54
7.8 REGULATORY FLOW ---55
7.9 MOBILITY OF HUMAN CAPITAL ---56
Chapter 8 CASE STUDIES OF THE UNITED STATES AND CHINA ---58
8.1 THE CASE OF THE UNITED STATES ---58
8.1.1 DIVERSE POLICY FORMULATION AT THE NATIONAL LEVEL ----58
8.1.2 HIGHLY FINANCED SCIENTIFIC RESEARCH ---59
8.1.3 ABUNDANT INDUSTRIAL APPLIED RESEARCH ---60
8.1.4 SOUND EDUCATION AND TRAINING ---60
8.2 THE CASE OF CHINA ---61
8.2.1 CENTRALIZED POLICY FORMULATION ---61
8.2.2 NEWLY ESTABLISHED BASIC SCIENCE RESEARCH ---62
8.2.3 POLICY TO FORCE INDUSTRIAL APPLIED RESEARCH ---63
8.2.4 EDUCATION AND CITIZEN PERSPECTIVE: BEING FORMULATED -64 Chapter 9 CONCLUSION ---66
9.1 EMPIRICAL ANALYSIS FINDINGS ---66
9.1.1 REGIONAL EFFICIENCY WITH ENERGY CONSIDERED ---66
9.1.2 REGIONAL EFFICIENCY WITH WATER CONSIDERED ---68
9.2 GREENING THE NIS ---70
9.2.1 INTEGRATION IN POLICY FORMULATION --- 70
9.2.2 TRANS-DISPLINARY KNOWLEDGE NETWORK ---71
9.2.3 DATA COLLECTION AND ANALYSIS ---71
9.2.4 MORE INNOVATIONS ACTIVATED ---71
REFERENCE ---72 vii
L
IST OF
T
ABLES
Table 1:SUMMARY STATISTICS WITH ENERGY AS INPUT BY REGION (1995-2002) ---24
Table 2:THE CORRELATION MATRIX FOR OUTPUT AND INPUTS WITH ENERGY (1995-2002) -25
Table 3:TOTAL ADJUSTMENTS AMOUNT OF ENERGY USE BY REGION (1995-2002) ---27
Table 4:TOTAL-FACTOR ENERGY EFFICIENCY BY REGION (1995-2002) ---30
Table 5:REGIONAL PARTIAL FACTOR ENERGY EFFICIENCY – THE ENERGY PRODUCTIVITY
RATIO (1995-2002) ---34 Table 6:SUMMARY STATISTICS WITH WATER AS INPUT BY REGION (1997-2002) ---37
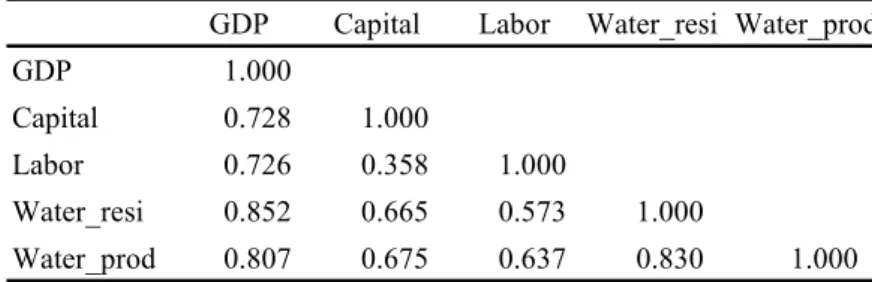
Table 7:THE CORRELATION MATRIX FOR OUTPUT AND INPUTS WITH WATER (1997-2002) --38
Table 8:WATR OF RESIDENTIAL USE BY REGION (1997-2002) ---40
Table 9:WAT AMOUNTS OF RESIDENTIAL USE FOR REGIONS AND AREAS IN
CHINA (1997-2002) ---41 Table 10:WATR OF PRODUCTIVE USE BY REGION (1997-2002) ---44 Table 11:WAT AMOUNTS OF PRODUCTIVE USE FOR REGIONS AND AREAS IN
CHINA (1997-2002) ---46 Table 12:SECTORS AND FLOWS IN A GREEN NATIONAL INNOVATION SYSTEM ---57
Table 13:DEPLOYMENT OF ENVIRONMENTAL BASIC SCIENCE RESEARCH INSTITUTIONS
IN CHINA (SOURCE: CHINA ENVIRONMENT STATISTIC YEARBOOK,
1997-2003) ---63
L
IST OF
F
IGURES
Figure 1:THE FOCUS IS SHIFTING ON ENVIRONMENTAL PROTECTION ---6 Figure 2: THE ADMINISTRATIVE REGIONS AND THREE MAJOR AREAS IN CHINA ---14
Figure 3: RADIAL ADJUSTMENT AND SLACK IDENTIFIED IN AN INPUT-ORIENTED
CRS DEA ---20 Figure 4: SLACK AND RADIAL ADJUSTMENT OF ENERGY BY AREA
AND YEAR (1995-2002).---29 Figure 5: THE U-SHAPE RELATION EXISTING BETWEEN TOTAL-FACTOR ENERGY
EFFICIENCYOF AN AREA AND PER CAPITA INCOME OF AN
AREA IN CHINA ---32 Figure 6: TOTAL ADJUSTMENT AMOUNT OF WATER USE BY AREA AND YEAR
(1997-2002) ---47 Figure 7: THE U-SHAPE RELATION EXISTING BETWEEN TOTAL-FACTOR WATER EFFICIENCY
AND PER CAPITA REAL INCOME FOR AREAS IN CHINA ---48
Figure 8:GNIS IS AN INNOVATION SYSTEM FOR A NATION TOWARDS SUSTAINABLE
DEVELOPMENT INCLUDING ASPECTS OF ENVIRONMENTAL CONSERVATION
AND SOCIETAL BALANCE IN PARALLEL TO ECONOMIC GROWTH ---49 Figure 9: GREEN VALUE CHAIN (WBSCD, 1995) ---52 Figure 10: THE FRAMEWORK OF GREEN-BASED NATIONAL INNOVATION
SYSTEM ---55 Figure 11: ENVIRONMENTAL AND NATURAL RESOURCE RELATED R&D FUNDS IN THE
UNITED STATES (NCSE, 2003) ---60
CHAPTER 1 INTRODUCTION
In the world, economy was quite developed in the recent several decades. Following with advantages from the growth, the natural resources are heavily consumed. The economic growth will not continue without input of these inevitable natural resources. It is important to get balance between economic growth and consumption of natural resources in order to remain sustainability for development.
China’s economic growth was proceeding aggressively in the past two decades and is still expanding at a 9.5% annual rate in the fourth quarter of 2004 (Business Asia, 2005). At the same time, its natural resources input are under a severe supply constraint following such a roaring development. China is therefore taken as an example to study empirically for input efficiency of these finite natural resources behind its prosperous economic growth. There are two natural resources considered as essential inputs for economic production and growth, which are energy and water.
1.1 REGIONAL PRODUCTIVITY WITH ENERGY INPUT CONCERNS
China is the second largest energy-consuming economy in the world. The demand for electric power in the country is increased by 69% from 2000 to 2004. Much of the fixed asset investments have moved into energy-intensive industries, yet there is nearly a one-third shortage of electricity consumption in China. One forecast (Kadoshin and Nishiyama, 2000) shows that by 2010, China will consume three times its 1992 energy input. That is, China’s share of the world’s total energy consumption will grow from 8.6% in 1992 to 15.9% in 2010. Along with this fast demand for energy, the efficiency of energy use should be of concern especially under China’s energy policy. Various plans are being carried out to increase investment and to speed up construction in order to establish a sufficient energy supply. However, the efficiency of energy consumption needs to be promoted simultaneously such that redundant energy consumption is eliminated.
Energy alone can not produce just any outputs. Energy must be put together with other inputs to consider in order producing outputs. Therefore, a multiple-input model is more reasonable to apply that correctly assess the energy efficiency in a region. In our study the regional targets of energy inputs can be found through the data envelopment analysis (DEA).
The out-of-date technology level and the inefficient production process generate a redundant portion of energy consumption that needs to be further adjusted. The amount of total adjustments, including slack and radial adjustments, is computed by DEA. The target level of energy use, called target energy input, is obtained when the amount of total adjustments is reduced from amount of the actual energy use. A new index of energy efficiency, named total-factor energy efficiency (TFEE), is constructed as the ratio of the target energy input that is suggested from DEA to the actual energy inputs in a region.
Energy efficiency improvement relies on total factor productivity improvement (Boyd and Pang, 2000). The TFEE index incorporates energies, labor, and capital stock as multiple inputs so as to produce economic output (GDP1). In contrast, a traditional energy efficiency index only takes energy into account as a single input (Patterson, 1996) to produce GDP output while neglecting other key inputs such as capital and labor. DEA can be easily applied to a multiple input–output framework to compute the index of TFEE. An empirical analysis of regional energy efficiency in China presents results from a real case application of the new index.
Sustainable development has to be considered with an energy policy (Gibbs, 2000) since energy supply is inevitable for economic growth. The concept should be introduced by covering areas on a local or regional level and then extending to the national level (Gibbs, 1998). Our study concentrates specifically on the regional level of energy efficiency in China where further improvements can be planned and executed accordingly. China is now in a transition period, having started from a high resource-consuming and low-efficiency economic development pattern (Fleisher and Chen, 1997). It is of particular importance to improve energy efficiency in the various regions within China in order to sustain its economic growth.
1.2 REGIONAL PRODUCTIVITY WITH WATER INPUT CONCERNS
Water is another essential input to economic production. However it is in sever shortage behind the prosperous economic booming in China. Many reports worry about how the situation will be improved and what could be scenario in the future. Water
1GDP represents gross domestic product.
resource is finite in China and also in the earth. Improving water efficiency to support sustainable development is a crucial task.
Same as energy, water alone as an input can not produce any outputs through production. It has to be accompanied by other inputs to produce real outputs. Therefore, a multiple-input model is reasonable to apply for evaluation of the water efficiency in a region. Regional targets of water input, including residential and productive use, can be found through DEA. The inefficient portion of the water input results in redundant water consumption and shall be reduced. This redundant water use portion is generated mainly from inefficient production processes and out-of-date technologies. The two types of redundant water use portion are slack and radial adjustments of water input and their summation is the total adjustment of water input. An index of water adjustment target ratio (WATR) is constructed via dividing the target water input by the actual water input in a region or in an economy.
Water efficiency improvement relies on total factor productivity improvement (Boyd and Pang, 2000). The index WATR incorporates water as input together with inputs in conventional economic analysis that are labor and capital stock. Multiple inputs therefore form an economic production function to produce the economic output (GDP). An analysis of regional water efficiency in China shows an empirical result of a real case application of this new developed index.
The perspective of sustainable development needs to consider water policy (Gibbs, 2000) since water is a finite source. Sustainable development should be introduced by covering areas on a local or regional level and then extending to the national level (Gibbs, 1998). This type of sub-national scale shall be emphasized as a key point. Our study concentrates specifically on water efficiency status at the regional level in China, which was of less concern before, but important now in order that further improvements can be planned and implemented accordingly. China is in a transition period starting from a high resource-consuming and low-efficiency economic development pattern (Yang, 2002; World Bank, 2001). It would be of particular importance to improve water efficiency in various regions in China in order to sustain its economic growth.
1.3 TOWARDS SUSTAINABILITY WITH INNOVATIONS
The national innovation system (NIS) is now regarded as the key driving force of economic growth and the primary source of competitiveness for a knowledge-based economy (OECD, 1999; 2002). The system is composed of a set of institutions as well as bridging mechanisms that act as intermediaries among all sectors (Niosi, 2003). The intermediaries between these institutions are the core where knowledge is generated, diffused, and adapted, that form a spiral of innovation. Flows of knowledge, finance, human capital, and regulation are the intermediaries which activate the system (OECD, 2002).
A ‘green’ innovation system therefore essentially addresses these issues through a feed-forward control methodology (Robbins, 1994). This methodology contains both radical and incremental levels of innovation (Patris et al., 2001), in order to fundamentally study environmental problems in beginning stages when the problems emerge instead of in the end-of-pipe and middle stages where hazards and pollution may have already been produced. The system is able to assist firms to eliminate constrains which introduce solutions to environmental problems, as well as conduct regulations, and compliances to allow EMS to be effectively implemented. Conway and Steward (1998) find that new technological products and processes must embody green characteristics. Porter and van der Linden (1995) state that green competitiveness can turn environmental concerns into economic competitive advantages, as radical change in advancing environmental innovation is inevitable for a nation desiring to enhance its long-term competitiveness.
‘Green’ has been widely adopted and well known as a word to represent and interpret concepts such as environmental protection and natural resources conservation. On the other hand, the concept of sustainable development emphasises that environmental and economic development should not be separated since the next generation still needs natural capital to meet its needs. These future needs should not be compromised in order to meet the needs of the present (Harrison, 2002). The concept of ‘green’ therefore should be embedded into economic development in order to achieve sustainable development.
We shall describe a framework of a GNIS, constructed to further sustainable development within a nation. The GNIS is developed on the basis of NIS with green
sustainability aspects embodied. The three major dimensions in sustainable development are ecological sustainability, social sustainability, and economic sustainability (Munro, 1995; Giddings et al., 2002). GNIS emphasizes the balance between sustainability of the ecological system and economic development, so that sustainable development can be achieved.
CHAPTER 2 SUSTAINABLE REGIONAL DEVELOPMENT
In recent decades, in parallel to rapid world economic growth, the problems of environmental pollution and natural resource consumption have become more serious. But on the other hand, awareness of environmental protection and natural resource conservation has been fostered by different parties ranging from governments and companies to individuals (Cerin and Karlson, 2002). Environmental policy in nations that transferred from end-of-pipe regulation to implementation of an environmental management system is now required to be reformed again in a direction towards sustainable development (Ashford, 2002), as far–sighted preventive measures and structural change are needed. The change can be seen from Figure 1. The end-of-pipe monitoring system is based on a methodology of feedback control (Robbins, 1994) was operated in the late-1970s. Action was taken by end-of-pipe measuring and monitoring, and the system basically performed problem control in a feedback methodology (Robbins, 1994). The environmental management system (EMS) was then launched in the mid-1990s and operated a methodology of concurrent control (Robbins, 1994). Several Environmental Management System (EMS) Environmental Innovation System (GNIS) End-of-pipe monitoring and measurement to achieve e control and pollution reduction mission Environmental compliances formed to embody environmental concepts into manufacturing processes and product design to solve environmental issues Environmental Innovations required to support and discover root solutions for solving critical agenda Environmental Monitoring and Measurement Feedback Control Concurrent Control Feedforward Control Strategy Purpose Method-ology 2000s Late 1970s Mid 1990s Figure 1
THE FOCUS IS SHIFTING ON ENVIRONMENTAL PROTECTION
environmental standards were introduced, for example, the international standard of EMS - ISO140002.
Although environmental regulations as a management system have been widely deployed in many nations (Jackson et al., 1997), firms in most industries actually face constrains such as a lack of both financial and R&D capability, short-term oriented environmental strategies, inflexible organizational structures, and relationships with external stakeholders (Brio and Junquera, 2003; Niosi, 2003). The result hardly leads the existing system to create the physical means to solve the critical environmental issues that a nation confronts.
2.1 ENERGY EFFICIENCY AND SUSTAINABLE DEVELOPMENT
Energy is fundamental to economic system. As economies develop and become more complex, energy needs increase greatly. According to the first law of thermodynamics that energy can be neither created nor destroyed. Entropy is defined in the second law of thermodynamics as a measure of unavailable part of energy. Most energy is formed as type with low entropy in beginning, every time energy is transformed to type with higher entropy after use. Eventually energy soon becomes an unavailable or bound form. This explains the specialty and scarcity of energy.
It relies on sufficient and continuous energy supply to reach at goal of sustainable development. Therefore it is important to discover new energy sources on the one hand. On the other hand, it is essential to consume energy in the most efficient way. The optimal energy efficiency is therefore emphasized to achieve in order to consume energy at the highest efficiency.
Patterson (1996) comments that energy efficiency is a policy objective to link to commercial, industrial competitiveness and energy security benefits, as well as increasingly to environmental benefits. Energy efficiency is a generic term, and there is no one
2 ISO14000 emerged in 1992 and is an international standard for EMS to promote common approach to EMS
and enhance organization’s ability to measure improvements in environmental performance. It covers environmental auditing, environmental performance evaluation, environmental labeling, life-cycle assessment, and environmental aspects in product standards.
unequivocal quantitative measure of ‘energy efficiency’. In general, energy efficiency refers to using less energy to produce the same amount of services or useful output.
There are four groups of indicators used for measurement of energy efficiency according to existing literatures. They are introduced respectively as following.
(1) Thermodynamic: These are energy efficiency indicators that rely entirely on measurements derived from the science of thermodynamics. Some of these indicators are simple ratios and some are more sophisticated measures that relate actual energy usage to an ideal process (Sioshansi, 1986):
∆Hout ∆Hin E∆H = , (1) where Enthalpic efficiency ; E∆H =
∆Hout = Sum of the useful energy output of a process ; ∆Hin = Sum of all of the energy inputs into a process.
(2) Physical-thermodynamics: These are hybrid indicators where the energy input is still measured in thermodynamic units (Collins, 1992), but the output is measured in physical units. These physical units attempt to measure the service delivery of the process – for example that in term of tones of product or passenger miles:
Output (e.g. vehicle kilometers) Energy input
EPT = ,
(2) where
EPT = Energy efficiency in physical-thermodynamic term.
(3) Economic-thermodynamic: These are also hybrid indicators where the service delivery (output) of the process is measured in terms of market prices (Patterson, 1996). The energy input, as with the thermodynamic and physical-thermodynamic indicators, is
measured in terms of conventional thermodynamic units and named as energy productivity ratio:
GDP Energy input Energy productivity ratio =
. (3) This type of indicator is the most common used one among all indicators. It simply evaluates energy efficiency, base on energy productivity ratio, by observing how much GDP is produced when how much of energy is input.
(4) Economic: These indicators measure changes in energy efficiency purely in terms of market values. That is, both the energy input and service delivery (output) are enumerated in monetary terms (Berndt, 1978):
GDP
Cost of energy consumption
EE = ,
(4) where
EE = Energy efficiency in economic term.
2.2 ENERGY SOURCES IN CHINA
China has been the largest coal production and consumption country in the world. The coal is the major energy source that supplies 60-65 % energy need in China as of 2000. However this type of energy generates severe pollutions, environmental degradation, and related operational problems. Crude oil and natural gas as energy sources from fossil fuels that supply 10-15 % energy need in the country. The level is 10-20 % lower than average in the region and the world. China faces an urgent need to diversify beyond crude oil, natural gas, and coal.
Biomass energy as the major renewable energy sources supply around 20% in China as of 2000. It contains straw, stalk, crop residue, fuel wood, and other varieties of organic wastes (Chang et al., 2003). Biomass energy is main energy source in rural area of China.
Energy consumption in China is rising so rapidly that even a national campaign to build
windmills or solar-powered houses will barely reduce the country's dependence on fossil fuels. 60 million people are not available with electricity by far. The demand for energy in China grows about 20 % every year since the country opened market to develop economy from 1989. Industry sector is the major portion of consuming energy around 42 % of the total in the country, which is 5-10 % higher than average in the region and the world. Industries require high inputs and high energy consumption contributes to production outputs that are around 4 % of GDP total, but they also cause demand increasing for energy input for 12 %.
The ‘11th Five-Year Plan’ is China's socio-economic development strategy for the next five years to 2010. It indicates the country will further deduct energy’s dependence on coal and replace with crude oil. At the same time, the alternative of renewable energy sources is emphasized to development. On the other hand, energy efficiency has to be promoted to reach at goal of saving energy use.
2.3 WATER EFFICIENCY AND SUSTAINABLE DEVELOPMENT
Water is a finite resource and only 0.3 percent is available for the world’s population to share for agricultural, residential, manufacturing, community, and personal needs. While both world population and the demand on freshwater resources are increasing, supply still remains constant (U.S. EPA, 2004).
However, water is an inevitable resource for all species’ living in the plant and for sustainable development of human society. Water efficiency is an essential topic to investigate and a long-term ethic of conserving water resources through the employment of water-saving technologies
Baumann et al. (1979) named that water conservation is any socially beneficial reduction in water use or water loss. Water use efficiency is of central importance to conservation. At the same time, his definition suggests that efficiency measures should make sense economically and socially in addition to reducing water use per unit of activity. In economic dimension of water use efficiency, normally it refers to a directly proportional to the prices charged for water servicing.
There are not much existing literatures on the quantitative analyses of water efficiency. Related researches (Mo et al., 2005; Huang et al., 2005) concentrated mainly on agricultural productivity such as yield of the crop or amount of food per unit of water consumed. The total-factor water efficiency of an economy or a region is still left to discuss in this research as the first.
2.4 WATER RESOURCES IN CHINA
China has uneven endowments of water resources among its regions: Some regions suffer from floods but others suffer from droughts. In China 81% of its water resources are in the country’s southern part, but the north part, the political center, having the largest part of arable land up to 64%, is in serious water scarce (Jin and Young, 2001). Water resources are characterized by richness in the south and shortage in the north, or richness in the east and shortage in the west (Zhong, 1999). On the other hand, the quantity of water resources greatly changes from year to year and also from season to season, making great difficulties in developing and using water resources (Zhong, 1999).
The total amount of continental fresh water was 2413 billion cubic meters in 2004, however per capita quantities of water were only 427 cubic meters. This amount is far away from 1700 cubic meters that defined by expertise of experiencing “water stress” (World Resources Institute, 2004). The national supply was 554.5 billion cubic meters in 2004, in which residential use portion was 46.1 billion cubic meters (8.3% of the total) and productive use was 500.2 billion cubic meters (90.2% of the total) (Ministry of Water Resources, 2004). That is, productive use is the dominant portion of the total water use in China.
No matter whether China's policymakers push for less-efficient, capital-intensive water-transfer projects or opt for more efficient recycling and conservation in the north, China's unreliable water supplies could significantly affect its growth. Failure to solve water shortages problem could reduce China's annual GDP growth by 1.5% to 1.9% (Varis and Vakkilainen, 2001). Resulting from the high uneven endowed distribution of water resources among regions in China and also the water resource is so high correlated to its productive use portion; it is worthy to investigate efficiency of water use by regions especially at their productive use portion.
Regional efficiency of water use is analyzed on basis of these three major areas. We would like to analyze efficiency level of water use among these areas. The result can therefore be reference for water supply improvement.
CHAPTER 3 REGIONAL DESCRIPTION AND DATA COLLECTION
3.1 REGIONAL DESCRIPTION
From the perspective of China’s development and political factors, its provinces, autonomous regions, and municipalities are usually divided into three major areas: the east, central, and west as shown in Figure 2.
The east area is constituted by twelve regions that stretch from the province of Liaoning to Guangxi, including the coastal provinces of Shandong, Hebei, Jiangsu, Zhejiang, Fujian, Guandong, and Hainan, and the three municipalities of Beijing, Tianjin, and Shanghai. The east area is well known and has experienced the most rapid economic growth in China and its GDP output is around half of China’s total. The east area has also attracted the most foreign investment, technology, and managerial know-how. The central area consists of nine regions that are all inland provinces: Heilongjiang, Jilin, Inner Mongolia, Henan, Shanxi, Anhui, Hubei, Hunan, and Jiangxi. This area has a large population and is a home base for farming. Foreign investment in this area is less and technology lags do exist. The west area covers more than half of the territory in China including the provinces of Gansu, Guizhou, Ningxia, Qinghai, Shaanxi, Tibet, Yunnan, Xinjiang, Sichuan, and the municipality Chongqing. Compared to the other two areas, this area has low population density and is the least developed area in China.
Since Chongqing was promoted to be the fourth municipality in China only in 1997, this municipality is still combined with the Sichuan province and they together are regarded as one region in this research. The energy input data of Tibet were not available for this research. Thus, a total of eight regions in the west area are included in this study. The three areas are abbreviated as E, C, and W for the east, central, and west areas, respectively. A total of twenty-nine regions are this study’s targets to be analyzed for their energy efficiency.
16 15 04 29 01 14 02 03 28 13 09 27 26 19 06 25 17 05 20 22 07 21 18 08 23 24 10 11 12
1 Beijing 8 Fujian 13 Shanxi 18 Jiangxi 22 Sichuan 27 Qinghai 2 Tianjin 9 Shandong 14 Inner Mongolia 19 Hennan 23 Guizhou 28 Ningxia 3 Hebei 10 Guangdong 15 Jilin 20 Hubei 24 Yunnan 29 Xinjiang 4 Liaoning 11 Guangxi 16 Heilongjiang 21 Hunan 25 Shaanxi
5 Shanghai 12 Hainan 17 Anhui 26 Gansu 6 Jiangsu 16 Heilongjiang 25 Shaanxi 7 Zhejiang 17 Anhui 26 Gansu
West Area (8 Regions)
East Area (12 Regions) Central Area (9 Regions)
Figure 2
THE ADMINISTRATIVE REGIONS AND THREE MAJOR AREAS IN CHINA
3.2 DATA COLLECTION
3.2.1 REGIONAL ENERGY CONSUMPTION DATA IN CHINA
A panel dataset of twenty-nine regions from 19953 to 2002 is collected for analysis of total-factor energy efficiency. Data of labor employment and GDP are both collected from the China Statistical Yearbook. Data of capital stock are not available in any statistical yearbooks of China. In this study every regional capital stock in a specific year is calculated by the authors according to the formula (Li, 2003):
Capital stock in the current year
= capital stock (previous year) + capital formation (current year)
− capital depreciation (current year). (5) The regional capital stocks in 1995 price are calculated accordingly with real price
conversion from 1978’s value and GDP deflators4. The GDP data are also deflated to
1995’s value for analysis since 1995 is taken as fundamental period for analysis of energy efficiency.
Regional energy consumption levels are collected from the China Energy Statistical Yearbook. The data are available from 1995 to 2002 excluding that for region of Tibet. These energy datasets contain only the conventional energy consumption — mainly coal, petroleum, and natural gas. Those energy resources with a low calorific value are excluded, most of which are renewable energies. Biomass energy is almost 100% of this renewable energy source in China (Chang et al., 2003). There are also other renewable sources such as solar, wind, geothermal, and oceanic energies, but all are consumed at very low levels (International Energy Agency (IEA), 2004).
Biomass energy is one of the main sources for noncommercial energy use in China’s rural areas, constituting 38.7% of China’s total energy consumption in 1970, but then later dropping to 19.9% of China’s total in 2000 (Chang et al., 2003). Few data sources of
3Complete data for regional energy efficiency are available from 1995 and for only twenty-nine regions. The year 1995 is
therefore the fundamental period for analysis of energy efficiency.
4 Real capital stock data from Li is 1978 price. Therefore data need to convert to 1995 price first with GDP
deflators for analysis in this study.
biomass energy consumption could be found, and those had been offered were incomplete for this study and relied on estimations (Sinton and Fridley, 2002).
Biomass energy still counts for around 20% of the total energy consumption in China as of 2000. China Rural Energy Statistical Yearbook once provides regional data of biomass energy consumption, but only up to 1999. Since biomass energy is mainly composed of straw, stalk, crop residue, and fuel wood (Chang et al., 2003), the total sown area of farm crops of the regions is selected as a proxy of the biomass energy consumption in this study5. The data of regional total sown area of farm crops (abbreviated as ‘farm area’ hereafter) are available in the China Statistical Yearbook for each sample year. A very high positive correlation coefficient of 0.841 is found between total biomass energy consumption level and farm area of regions in China during our 1995–1996 data collection. The factor farm area of regions is hence an appropriate proxy of the biomass portion of energy input in this study. The data are therefore complete for an analysis of energy efficiency in regions of China.
3.2.2 REGIONAL WATER CONSUMPTION DATA IN CHINA
Regional data for inputs and the output are collected from distinct sources. Inputs including regional labor employment as well as water consumption are collected from the China Statistical Yearbook from 19976 to 2002. The water consumption is separated as two parts that are residential use and productive use according to data classification in the China Statistical Yearbook. The real capital stock as one of input factors is constructed according to the same Li’s method (Li, 2003) aforementioned. The data of real capital stock used in analysis of water efficiency are converted to 1997 prices. The single output is regional GDP and is collected from the China Statistical Yearbook. The collected GDP data are deflated to 1997 values as well with GDP deflator.
From China Statistical Yearbook, we establish a dataset for 30 regions in China (27 provinces and 3 municipalities) during 1997 to 2002. Note that Chongqing became a municipality out of Sichuan just since 1997 and some of its data are split from Sichuan
5We have tried to use the forest area as a proxy of fuel wood as one of the biomass energy sources. However, the sign of
the correlation coefficient between real GDP and forest area is negative, hence violating the ‘isotonicity’ requirement between an input and an output.
6Complete data for regional water consumption in China is only available from 1997; therefore 1997 is fundamental
period for analysis of water efficiency which is different from analysis of energy efficiency.
some years later. Therefore we combine outputs and inputs of this municipality together with Sichuan in this study for easier comparison and panel dataset for total thirty regions is therefore constructed. Macroeconomic performance is evaluated in a region of its capability to maximize the single desirable output GDP and to minimize the three input factors. Water is especially important since it is an inevitable natural resource to economic development.
The total thirty regions are categorized as three areas (shown in Figure 2). The three areas are the east area (abbreviated as ‘E’), the central area (abbreviated as ‘C’), and the west area (abbreviated as ‘W’).
CHAPTER 4 METHOD OF DATA ENVELOPMENT ANALYSIS (DEA)
In this section the DEA approach is introduced for analysis and measurement of overall technical efficiency.
4.1 MEASURING TECHNICAL EFFICIENCY: THE DEA APPROACH
DEA is known as a mathematical procedure using a linear programming technique to assess the efficiencies of decision-making units (DMU) that refer to a set of firms (Coelli, 1996) and a set of regions in this study. All DMUs take an identical variety of inputs to produce an identical variety of outputs (Ramanathan, 1999), but through distinct production processes and technologies decided and used in each DMU, the input and output levels and their production efficiency are eventually decided upon. A non-parametric piecewise frontier composed of DMUs, which own the optimal efficiency over the datasets, is constructed by DEA for comparative efficiency measurement. Those DMUs located on the efficiency frontier have their maximum outputs generated among all DMUs by taking the minimum level of inputs, which are efficient DMUs and own the best efficiency among all DMUs.
DEA needs to specify neither the production functional form nor weights on different inputs and outputs. It produces detailed information on the efficiency of the unit, not only relative to the efficiency frontier, but also to specific efficient units which can be identified as role models or comparators (Hawdon, 2003; Hu and Wang, forthcoming). Comprehensive reviews of the development of efficiency measurement can be found in Lovell (1993). There are K inputs and M outputs for each of these N DMUs. The envelopment of the ith DMU can be derived from the following linear programming problem: Min θ, λ θ subject to -yi + Yλ ≥ 0, θ xi – Xλ ≥ 0, λ ≥ 0, (6) 18
where θ is a scalar representing the overall technical efficiency (OTE) score; λ is an N×1 matrix of constants; yi is an M×1 output vector of DMU i; xi is an K×1 input vector of DMU
i; Y is an M×N output matrix; and X is an K×N input matrix. This satisfies 0 ≤ θ ≤ 1 and a
value of one indicates a point on the frontier, hence a technically efficient DMU (Coelli et al., 1998). The above procedure constructs a piecewise linear approximation to the frontier by minimizing the quantities of the K inputs required to meet the output levels of the ith DMU. The weight λ serves to form a convex combination of observed inputs and outputs. It is an input-orientated measurement of efficiency.
Eq. (6) is known as the constant returns to scale (CRS) DEA model (Charnes et al., 1978). Banker et al. (1984) suggested an extension of the CRS DEA model to account for variable returns to scale (VRS) situation with adding following convexity constraint:
N1’ λ = 1, (7)
where N1’ is an N×1 vector of ones.
The solution of the VRS DEA model, which is the pure technical efficiency (PTE), helps further decompose the overall technical efficiency of each DMU into pure technical efficiency (PTE) and scale efficiency (SE). That is, OTE = PTE × SE. In order to pursue overall technical efficiency with inputs of natural resources, our study adopts the CRS DEA model since this model finds OTE of each DMU. Furthermore, both output-oriented and input-oriented CRS DEA models generate exactly the same efficiency scores, target inputs, and target outputs. However, results of a VRS DEA model can be drastically changed by shifting from out-put orientation to input orientation.
The efficiency frontier in DEA is constituted by those efficient decision-making units (DMUs). The existing gap from any DMU to this efficiency frontier shows how far the DMU should be improved to reach the optimal efficiency level. The distance of the gap can also be computed through DEA. We use the software Deap 2.1, kindly provided by Coelli (1996), to solve the linear programming problems.
4.2 SLACK AND RADIAL ADJUSTMENTS
DEA identifies the most efficient point on the frontier as a target for those inefficient DMUs to achieve through a sequence of linear programming computation (Coelli, 1996). For the ith DMU, the distance from an inefficient point where it is located to the projected point on the frontier by radial adjusting the level of inputs, (1-θ)xi, is called ‘radial adjustment’. Moreover, the mostly seen piecewise-linear form of the non-parametric frontier causes the second stage to shift from the projected point to a point at the practical minimum level of the inputs on the frontier. The distance of shifting along with the frontier in between is called ‘slack’.
How a point with a practical minimum level for inputs on the frontier can be identified in DEA is illustrated in Figure 3 with a case of M = 1 and K =2. The maximum level y output by the DMUs located on the frontier is normalized to unity and generated from the specified (natural resources) inputs and other inputs which are also normalized by dividing y. Point B is the actual input set and point B’ is the projected point on the frontier for DMU B as the target in order to improve its efficiency accordingly by reducing the radial adjustment BB’. Output = 1 B C A D A’ B’ Natural Resourc es Inpu ts Out put Other Inputs Output E Figure 3
RADIAL ADJUSTMENT AND SLACK IDENTIFIED IN AN INPUT-ORIENTED CRS DEA
However, as aforementioned, the practical frontier is a piecewise linear format that requires the second-stage adjustment to determine a practical minimum point for inputs. In Figure 3, point A’ is the projected point on the frontier for another DMU A as the target to reach by reducing the radial adjustment AA’. However, the input level at point A’ could be further reduced to input level at point C while maintaining the same output level. The amount CA’ that shall further be adjusted for the input level at point A’ along with the frontier is called ‘slack’.
The summation amount of slack (CA’) and radial adjustment (A’A) for inputs is called the amount of total adjustments (CA), meaning that it is the total amount for inputs which should be adjusted by a DMU so as to reach its optimal production efficiency. The adjustments require both a promotion of technology level and an improvement of production process so that OTE is optimized. The amount of total adjustments is then removed and the output level is maximized when a DMU operates at the optimal position on frontier of production efficiency. The practice minimum input level is therefore called the target input level for a DMU.
Point E in Figure 3 indicates that DMU E has been operating on the frontier of production efficiency. The DMU E has already reached at the target input level of specified (natural resources) inputs in production. It can be observed that no amount of total adjustments exists for this input (natural resources). There is only slack amount of the ‘other inputs’ needs further adjustment, which is DE. The production efficiency at DMU E therefore moves to point D after DE is adjusted on the ‘other inputs’. The DMU E then has the practical minimum input for all inputs on the frontier.
The CRS model of DEA can suggest the slack and radical adjustment of individual input for all observed units to be efficient and amount of target input amount can either be calculated accordingly. DEA calculation then decides this ‘amount of total adjustments’ for each DMU for production efficiency analysis.
4.3 THE ANALYSIS PROCESS
The growth of a nation’s output depends on capital formation as well as efficiency and productivity improvement. Labor and capital are two major inputs in production. When measuring a nation’s overall output, gross domestic product (GDP) is commonly used. For
a nation, while GDP (income) preferred to increase more, consumption of natural resources is preferred to be less and efficient. The question between change of GDP and consumption of natural resources is in an output and input relation: First, the increasing of GDP would be closely related to input consumption of natural resources directly because these resources are generally key input for production. In reverse, the supply of these resources in a region are at certain levels and impossibly supply unlimited for GDP growth. An important point emerges upon this relationship: How these natural resources is consumed in a region and is the consumption efficient? The GDP growth goal and energy consumption level should be put together in order to set growth goal in region appropriately, the improvement and concerns to efficiency of natural resources’ consumption are key subjects to study and understand.
In this study, labor employment and gross capital are regarded as two major input factors in generation of GDP. The energy and water consumption are taken separately as a control variable to observe change of efficiency in this input and out relationship, thus efficiency of energy and water consumption can be analyzed and compared. In the following analytical process, labor employment, capital stock with energy consumption are considered as input terms to evaluate macroeconomic performance, the GDP, in terms of the regions with BCC (Banker et al., 1984) models.
CHAPTER 5 REGIONAL EFFICIENCY WITH ENERGY CONSIDERED
5.1 DESCRIPTIVE STATISTICS
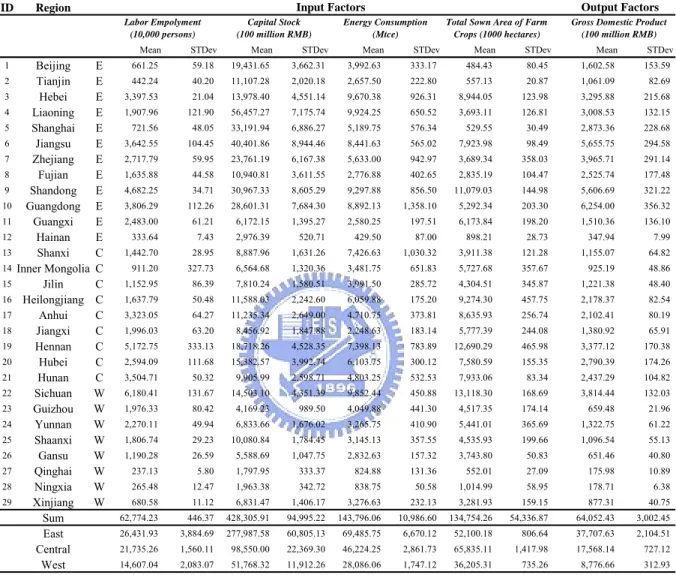
The descriptive statistics of China’s regions for their GDP performances in terms of production output, labor employment, capital stock, and energy consumption, including farm area as production inputs in our energy efficiency analysis, are first given in Table 1. A panel dataset for the analysis of total-factor energy efficiency is collected and constructed during 1995 to 2002 and from total twenty-nine regions. All monetary data, such as GDP and capital stock, are converted to 1995 price with GDP deflators7.
The east area, frequently called the coastal area, includes regions that show the fastest development progress in China. Mean GDP output in this area is 3.77 trillion RMB8, which is much higher than 1.75 trillion RMB of the central area and 0.88 trillion RMB of the west area during the sample years. The standard deviation of GDP output shows the same tendency and matches the economic growth pattern among these areas. The east area has a standard deviation of 210.4 billion RMB, which is also much higher than the other two areas, which are 72.7 billion RMB in the central area and 31.3 billion RMB in the west area. The fast-developing east area receives the largest investment—three times that of the central area and five times the west area.
The situation of energy consumption appears to be the same as that of the GDP result. The east area, as its economic growth shows, consumes the largest portion of energy amount in China. As shown in Table 1, the east area consumed 69.5 billion metric tons of standard coal equivalent (Btce) on an average from 1995 to 2002. This is much higher than 28.1 Btce consumed by the west area and 46.2 Btce consumed by the central area. While analyzing deviations of energy consumption among these areas, we find that the east area increased its energy consumption the fastest from 1995 to 2002 versus the central and west areas. As aforementioned, the central area is the home base of farming, and it consumes the largest level of biomass energy. The east area consumes the second biggest amount and the west area has the lowest level in accordance with farm area data shown in Table 1.
7 Detail explanation refers to Section 3.2.1 in page 15.
8 The RMB is an abbreviation of Ren-Min-Bi, meaning ‘people’s currency’ in Chinese. The RMB is the official currency
of the People’s Republic of China.
Table 1 SUMMARY STATISTICS WITH ENERGY AS INPUT BY REGION (1995-2002)
ID Region
Mean STDev Mean STDev Mean STDev Mean STDev Mean STDev 1 Beijing E 661.25 59.18 19,431.65 3,662.31 3,992.63 333.17 484.43 80.45 1,602.58 153.59 2 Tianjin E 442.24 40.20 11,107.28 2,020.18 2,657.50 222.80 557.13 20.87 1,061.09 82.69 3 Hebei E 3,397.53 21.04 13,978.40 4,551.14 9,670.38 926.31 8,944.05 123.98 3,295.88 215.68 4 Liaoning E 1,907.96 121.90 56,457.27 7,175.74 9,924.25 650.52 3,693.11 126.81 3,008.53 132.15 5 Shanghai E 721.56 48.05 33,191.94 6,886.27 5,189.75 576.34 529.55 30.49 2,873.36 228.68 6 Jiangsu E 3,642.55 104.45 40,401.86 8,944.46 8,441.63 565.02 7,923.98 98.49 5,655.75 294.58 7 Zhejiang E 2,717.79 59.95 23,761.19 6,167.38 5,633.00 942.97 3,689.34 358.03 3,965.71 291.14 8 Fujian E 1,635.88 44.58 10,940.81 3,611.55 2,776.88 402.65 2,835.19 104.47 2,525.74 177.48 9 Shandong E 4,682.25 34.71 30,967.33 8,605.29 9,297.88 856.50 11,079.03 144.98 5,606.69 321.22 10 Guangdong E 3,806.29 112.26 28,601.31 7,684.30 8,892.13 1,358.10 5,292.34 203.30 6,254.00 356.32 11 Guangxi E 2,483.00 61.21 6,172.15 1,395.27 2,580.25 197.51 6,173.84 198.20 1,510.36 136.10 12 Hainan E 333.64 7.43 2,976.39 520.71 429.50 87.00 898.21 28.73 347.94 7.99 13 Shanxi C 1,442.70 28.95 8,887.96 1,631.26 7,426.63 1,030.32 3,911.38 121.28 1,155.07 64.82 14Inner Mongolia C 911.20 327.73 6,564.68 1,320.36 3,481.75 651.83 5,727.68 357.67 925.19 48.86 15 Jilin C 1,152.95 86.39 7,810.24 1,580.51 3,991.50 285.72 4,304.51 345.87 1,221.38 48.40 16 Heilongjiang C 1,637.79 50.48 11,588.03 2,242.60 6,059.88 175.20 9,274.30 457.75 2,178.37 82.54 17 Anhui C 3,323.05 64.27 11,235.34 2,649.00 4,710.75 373.81 8,635.93 256.74 2,102.41 80.19 18 Jiangxi C 1,996.03 63.20 8,456.92 1,847.88 2,248.63 183.14 5,777.39 244.08 1,380.92 65.91 19 Hennan C 5,172.75 333.13 18,718.26 4,528.35 7,398.13 783.89 12,690.29 465.98 3,377.12 170.38 20 Hubei C 2,594.09 111.68 15,382.57 3,992.74 6,103.75 300.12 7,580.59 155.35 2,790.39 174.26 21 Hunan C 3,504.71 50.32 9,905.99 2,598.71 4,803.25 532.53 7,933.06 83.34 2,437.29 104.82 22 Sichuan W 6,180.41 131.67 14,503.10 4,351.39 9,852.44 450.88 13,118.30 168.69 3,814.44 132.03 23 Guizhou W 1,976.33 80.42 4,169.23 989.50 4,049.88 441.30 4,517.35 174.14 659.48 21.96 24 Yunnan W 2,270.11 49.94 6,833.66 1,676.02 3,265.75 410.90 5,441.01 365.69 1,322.75 61.22 25 Shaanxi W 1,806.74 29.23 10,080.84 1,784.45 3,145.13 357.55 4,535.93 199.66 1,096.54 55.13 26 Gansu W 1,190.28 26.59 5,588.69 1,047.75 2,832.63 157.32 3,743.80 50.83 651.46 40.80 27 Qinghai W 237.13 5.80 1,797.95 333.37 824.88 131.36 552.01 27.09 175.98 10.89 28 Ningxia W 265.48 12.47 1,963.38 342.72 838.75 50.58 1,014.99 58.95 178.71 6.38 29 Xinjiang W 680.58 11.12 6,831.47 1,406.17 3,276.63 232.13 3,281.93 159.15 877.31 40.75 Sum 62,774.23 446.37 428,305.91 94,995.22 143,796.06 10,986.60 134,754.26 54,336.87 64,052.43 3,002.45 East 26,431.93 3,884.69 277,987.58 60,805.13 69,485.75 6,670.12 52,100.18 806.64 37,707.63 2,104.51 Central 21,735.26 1,560.11 98,550.00 22,369.30 46,224.25 2,861.73 65,835.11 1,417.98 17,568.14 727.12 West 14,607.04 2,083.07 51,768.32 11,912.26 28,086.06 1,747.12 36,205.31 735.26 8,776.66 312.93 Capital Stock (100 million RMB) Energy Consumption (Mtce)
Gross Domestic Product (100 million RMB)
Output Factors
Labor Empolyment (10,000 persons)
Total Sown Area of Farm Crops (1000 hectares)
Input Factors
Notes:
(1) All monetary values are in 1995 prices.
(2) Source: China Energy Statistical Yearbook, 1991-1996, 1997-1999, 2000-2002, China Statistical Yearbook, 1995-2002.
(3) E is the abbreviation for the east area, C is the abbreviation for the central area, and W is the abbreviation for the west area.
(4) Data for the administration region Chongqing are regarded as a part of Sichuan in this paper since they were promoted as one of the municipalities in China only from 1997.
(5) Data of energy consumption in Tibet are not included since they are not available in the sample period.
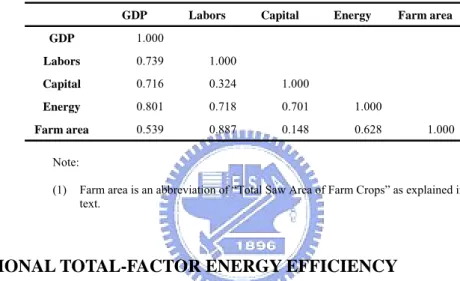
A correlation matrix is shown in Table 2, whereby a high correlation exists between these inputs and output. The correlation coefficient between the energy input and GDP output is 0.801 (P<0.005). A positive correlation coefficient of 0.539 is found between the farm area input and GDP output as well. These results all show ‘isotonicity’ of the four inputs and the one output in our DEA model. The energy input efficiency shall be analyzed in this study in order to understand individual energy efficiency states among all regions of China.
Table 2 THE CORRELATION MATRIX FOR OUTPUT AND INPUTS WITH ENERGY (1995-2002)
GDP Labors Capital Energy Farm area
GDP 1.000 Labors 0.739 1.000 Capital 0.716 0.324 1.000 Energy 0.801 0.718 0.701 1.000 Farm area 0.539 0.887 0.148 0.628 1.000 Note:
(1) Farm area is an abbreviation of “Total Saw Area of Farm Crops” as explained in text.
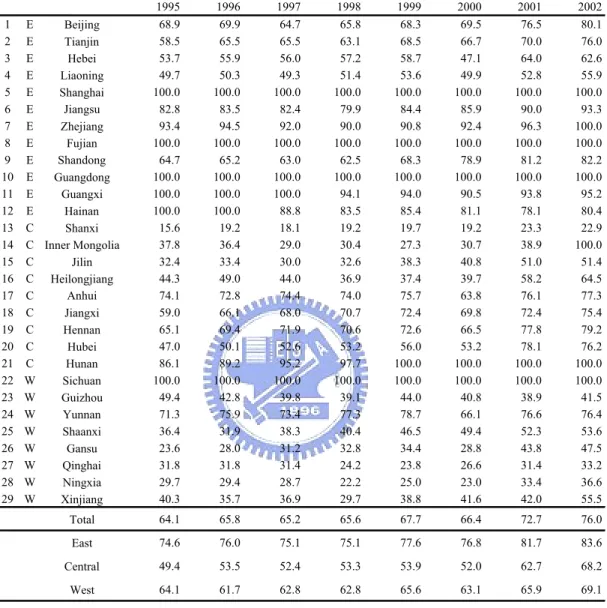
5.2 REGIONAL TOTAL-FACTOR ENERGY EFFICIENCY
The amount of total adjustments in energy input is regarded as the inefficient portion of actual energy consumption in a region. The more the amount of total adjustments, the less efficient the energy consumed in the region. Thus, if there does not exist an amount of total adjustments of energy input (equal to zero), then the region is utilizing energy at the “target energy input” level, which is the optimal efficiency of energy consumption when its output is maximized. Therefore, energy efficiency in a region is defined in Eq. (8) as below, which is named total-factor energy efficiency (TFEE) for region i at time t since the index is established based on the viewpoint of total factor productivity:
Target Energy Input (i , t ) Actual Energy Input (i , t )
TFEE (i , t ) = ,
(8) which implies in the ith region and in the tth year.
As Eq. (8) shows, the index TFEE represents the efficiency level of energy consumption in a region. As the target energy input is the best practical minimum level of energy input in a region, the actual energy input is therefore always larger than or equal to this target energy input. This makes the index TFEE score to always be between zero and unity. When the actual energy input level of a DMU is equal to the suggested target energy input level, a TFEE score of unity is achieved. Conversely, if the actual energy input level is far away from the suggested target energy input level, then the index approaches to zero, which represents low efficiency. This index is shown in percentile format in this study for easier reading.
5.3 TOTAL-FACTOR ENERGY EFFICIENCY IN AN AREA
Index TFEE is also employed to analyze energy efficiency in an area. Assume area a covers r regions. Area a’s TFEE at time t is defined in Eq. (9):
Target Energy Input (r , t ) Actual Energy Input (r , t )
, TFEE (a , t ) = (9)
∑
∈a r∑
∈a rwhich implies that the rth region belongs to area a.
Eq. (9) shows that the TFEE in an area is calculated by dividing the summation of target energy inputs by the total actual energy inputs of the area. This is a summation of actual energy input consumed in regions of the area. We calculate TFEE of an area in China in Section 5.5 in order to find its relation with per capita income of regions in China.
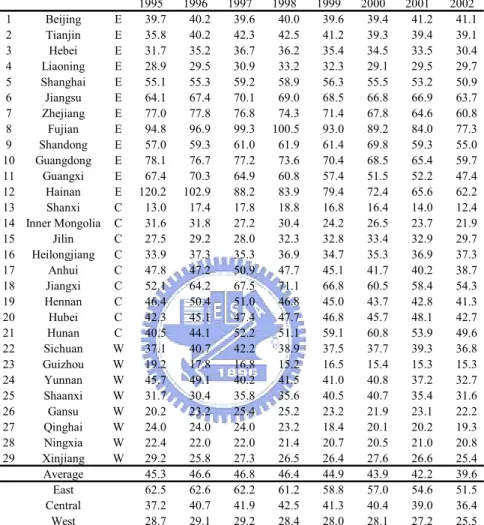
5.4 REGIONAL TOTAL ADJUSTMENTS OF ENERGY INPUT
Regions in the east area - the fast developing area - have an amount of total adjustments of their energy input at 15.96 Btce in 1995 and then it decreased to 13.49 Btce in 2002. The amount remained at around one-third of China’s total and fell slowly during the research period. Liaoning (4) and Hebei (3) are the two major regions generating around two-thirds of the area’s total. Shandong (9) reduced its 1995 adjustments’ amount
t o h a l f i n 2 0 0 2 w i t h c o n t i n u o u s i m p r o v e m e n t . S h a n g h a i ( 5 ) , F u j i a n ( 8 ) , a n d
Table 3 TOTAL ADJUSTMENTS AMOUNT OF ENERGY USE BY REGION (1995-2002) 1 E Beijing 1094.53 1104.27 1352.68 1336.31 1263.44 1286.48 1015.54 893.98 2 E Tianjin 1065.11 862.70 849.51 901.04 804.54 930.04 874.57 726.68 3 E Hebei 4163.53 3939.70 3970.14 3918.68 3875.62 5234.86 3744.19 4330.84 4 E Liaoning 4861.31 4835.12 4804.35 4429.55 4353.00 5395.54 5025.00 4674.92 5 E Shanghai 0.00 0.00 0.00 0.00 0.00 0.00 0.00 0.00 6 E Jiangsu 1380.76 1336.77 1407.30 1628.80 1275.31 1213.20 887.79 643.60 7 E Zhejiang 300.77 267.72 407.36 523.66 500.49 453.79 244.08 0.02 8 E Fujian 0.00 0.00 0.00 0.00 0.00 0.00 0.00 0.00 9 E Shandong 3097.46 3192.84 3386.02 3383.65 2873.38 1733.27 1874.18 1963.33 10 E Guangdong 0.00 0.00 0.00 0.00 0.00 0.00 0.00 0.00 11 E Guangxi 0.00 0.00 0.00 144.91 148.98 254.73 165.16 142.77 12 E Hainan 0.00 0.00 43.57 67.09 63.07 90.75 114.03 109.68 13 C Shanxi 7101.27 5530.22 5718.63 5353.53 5221.58 5441.85 6111.53 7198.79 14 C Inner Mongolia 1638.16 1794.48 2396.75 2123.93 2764.61 2453.90 2487.75 0.00 15 C Jilin 2777.67 2779.12 3032.67 2526.71 2278.99 2164.73 1893.43 2115.88 16 C Heilongjiang 3306.50 2990.52 3605.66 3768.90 3794.19 3720.32 2522.89 2130.47 17 C Anhui 1088.29 1229.93 1128.05 1188.91 1137.28 1766.90 1222.61 1208.48 18 C Jiangxi 981.60 729.64 682.28 593.77 588.93 670.12 643.48 638.50 19 C Hennan 2257.33 2037.60 1887.76 2131.44 2018.51 2637.65 1828.89 1792.59 20 C Hubei 2994.68 2995.86 2893.44 2829.05 2632.96 2935.00 1323.62 1599.69 21 C Hunan 752.89 589.36 232.20 113.95 0.00 0.00 0.00 0.00 22 W Sichuan 0.00 0.00 0.00 0.00 0.00 0.00 0.00 0.00 23 W Guizhou 1610.57 2110.22 2384.96 2629.90 2251.12 2560.81 2710.67 2615.53 24 W Yunnan 757.67 667.57 910.47 761.95 700.91 1087.97 815.62 928.05 25 W Shaanxi 1994.61 2400.16 1919.72 1801.29 1427.53 1382.74 1554.33 1721.28 26 W Gansu 2093.02 2018.59 1775.31 1806.03 1914.44 2144.81 1631.17 1583.77 27 W Qinghai 469.33 476.00 485.12 560.22 715.36 645.59 638.22 680.50 28 W Ningxia 533.22 565.65 573.56 643.56 636.07 669.05 592.73 577.14 29 W Xinjiang 1690.38 2072.03 2036.59 2304.41 1965.99 1937.36 2029.38 1610.38 Summary 48010.66 46526.06 47884.10 47471.22 45206.28 48811.47 41950.82 39886.84 East 15963.47 15539.13 16220.93 16333.69 15157.81 16592.66 13944.51 13485.80 Central 22898.39 20676.71 21577.44 20630.18 20437.05 21790.47 18034.20 16684.41 West 9148.80 10310.22 10085.73 10507.35 9611.43 10428.33 9972.11 9716.64 1995 1996 1997 1998 1999 2000 2001 2002 Notes:
(1) The unit is 10,000 tce.
(2) E is the abbreviation for the east area, C is the abbreviation for the central area, and W is the abbreviation for the west area.
(3) Data for the administration region Chongqing are regarded as a part of Sichuan in this paper since it was promoted as one of the municipalities in China only from 1997.
(4) Data of energy consumption in Tibet are not included since they are not available in the sample period.