Examining the Internationalization of Taiwan’
s Higher Education
through Student Immigration: A Project Proposal
Ai-hsuan S. Ma Department of Sociology National Chengchi University
Taipei, Taiwan
Abstract
International migration has become more significant and complex in the process of globalization. Among the types of international migration, student migration deserves special attention due to its increasing number and impact. Student mobility is often discussed from two perspectives: the expansion of internationally mobile labor force and the growth of a global market for higher education. On the one hand, student migration demonstrates a significant part of professional migration. On the other hand, student migration may be seen as a result of the internationalization and commercialization of higher education.
Taiwan provides an excellent case for student migration due to its rich experiences on student emigration and immigration. On the one hand, Taiwan for a long time was one of the countries in the world suffering the most from the outflows of the highly skilled, which mostly started with student emigration. On the other hand, Taiwan has gradually become a destination for student migrants. Taiwan has tried to attract foreign students to study since the 1950s; originally the focus of attraction was on overseas ethnic Chinese, in recent years the effort of recruitment has expanded to foreign students in general. However, because of the limited literature on the subject, much more needs to be learned on the phenomenon of student migration to Taiwan.
The proposed project will explore the phenomenon of student migration to Taiwan and its
linkage to the internationalization of Taiwan’s higher education. The investigation consists of
two levels. At the micro level, it will examine migration experiences of foreign students in
Taiwan’s higher educational system; including migration decision making, social networks,
adjustment experiences, and post-graduation plans. At the macro level, it will discover the structural contexts in which student migration is formed and maintained, the ways policies shape international migration of students, the scope of internationalization of the higher education system in Taiwan, and the linkage between student migration to Taiwan and the
internationalization of Taiwan’s higher education.
The proposed research is designed to be a two-year project and will employ both qualitative and quantitative measures. In the first project year, existing data and literature on student migration will be collected and reviewed, and a qualitative study of 50 in-depth interviews with foreign students will be conducted. A survey questionnaire will be developed based on the information from the interviews. In the second project year, a survey of 500 foreign students will be administered to collect more information on the subject in study. This project is both an independent study and a part of an internationally collaborated research endeavor on student migration. The results of this project will make significant contributions, empirically and theoretically, to the fields of international migration and education. Furthermore, this research project on student migration to Taiwan will make possible the inclusion of Taiwan in the establishment of a comprehensive dataset on the subject of several Asian countries, thus enables interested scholars to engage in cross-national comparative study on the subject.
中文摘要 國際遷移的現象隨著全球化的發展而日益地複雜與顯著。在國際遷移的不同型態中,學 生遷移現象因其逐漸增加的數量及影響力,而值得特別的注意。學界對於學生遷移現象 的討論,通常是從國際流動性勞動力的擴張及高等教育的商業化與國際化這兩種觀點切 入。一方面,學生遷移表現了專業人口遷移的重要成份。另一方面,學生遷移可被視為 是高等教育國際化與商業化的結果。 台灣由於在學生移出及移入方面均具有豐富經驗,因此很適合成為研究學生遷移的地 區。一方面,台灣在過去有很長一段時間,是世界上經歷人才外流最嚴重的國家之一, 而當中大部分的高階人力是經由學生遷移而流出。另一方面,台灣近年來已逐漸成為吸 引學生移民的目的地。自 1950 年代起,台灣即設法吸引外籍生來台求學,最初的吸引 對象是僑生,近幾年則將積極招募的範圍擴大至一般外籍生。但是,由於現有的相關文 獻相當有限,外籍學生在台留學的現象亟待進一步探究。 此研究計畫探討學生遷移來台的現象,並考察此現象與台灣高等教育國際化間的關連 性。此研究將分兩個層面進行檢視。在微視層面,本研究將對在台高等教育體系的外籍 生之遷移經驗進行瞭解,這將包括:遷移決策,社會網絡,適應過程,畢業後之計畫等。 在鉅視層面,此研究將探索:形成學生遷移的結構性成因,政策如何形塑及引導學生進 行跨國遷移,台灣高等教育國際化的範圍及程度,及外籍生來台現象與台灣高等教育國 際化之間的關連性。 此研究將進行兩年,並會以質性及量性方法進行研究。在第一年中,研究者將會蒐集並 整理現有相關之文獻及資料,並進行質性方面的資料蒐集,以深入訪談方式面訪 50 位 外籍生。質性資料並將作為量性調查問卷設計的基礎。在第二年中,本研究將對 500 名 外籍生進行面訪調查以蒐集更多的資訊。本研究是獨立研究,亦是跨國合作研究學生遷 移的一部份。此研究之結果將會對國際遷移及教育等領域做出實證及理論方面的貢獻。 此外,此研究將使台灣的資料能被囊括於亞洲學生遷移的大型資料庫中,有利於相關學 者進行跨國的比較性研究。 關鍵詞:遷移,學生,教育,國際化,全球化
Introduction
In the recent decades, we have witnessed the sweeping force of globalization. All countries in the world are urged to strengthen ties with other countries by join regional and global alliances. The advancement and prevalence of transportation and media technologies further compress time and space, enabling people to take long-distance travel with low cost and to communicate easily with people around the world (Cohen and Kennedy, 2000; Harvey, 1989; Held et al., 1992; Robertson, 1992).
Being a part of the globalization process, international migration has become more significant and intricate (Castle, 2000). Over the past century, the volume and significance of international migration has grown rapidly. All regions of the world, and most of the states within them, are now participating in the global system of migration (Timur, 2000). In addition, globalization is taken a new aspect, sustaining the grouping of countries at regional level. Regional agreements among states sustain and formalize the economic, political, social cooperation. The circulation of goods, finances and peoples is made easier (Martin and Widgren, 2002). As the number of migrants continues to be on the rise at the regional and global level, the characteristics of migrants have become more diversified and the causes for their moves more multi-faceted (Kritz, Lim, and Zlotnik, 1992; Meissner, et al. 1993; Portes, 1995; Arango, 2000; Castles, 2000). These increasing moves and exchanges may be regarded also as a strong agent reinforcing the links among societies. In this respect, migration at the international as well as regional levels may appear to be one of the most likely forces of social and political transformations (Castle, 2000; Kastoryano, 2000).
Among the various types of international migration, one deserves special attention; i.e., student migration. Student migration represents a unique and important aspect of the international migration, due to its significance in both number and impact (Ma, 1999). Taking Taiwan as a case study, this proposed research project will explore
internationalization ofTaiwan’shighereducation.This exploration will comprise two aspects: on the one hand, the study will examine the migration experience of foreign students to Taiwan; on the other hand, it will investigate whether and how student migration to Taiwan is shaped as well as shaping the internationalization of the higher education system in Taiwan.
In the following presentation, I will first outline the current development of international migration in general and student migration in particular. I will also briefly review the theoretical perspectives articulated in related fields to understand the phenomena. Second, I will delineate the research framework with research questions and methods which will be used to implement the study. Third, the potential contributions of this study are suggested to highlight the importance of this proposed study.
People on the Move: Phenomenon and Theory
International MigrationThe phenomenon of international migration in the world today has been most remarkable than ever, and we are witnessing a significant increase of the number of people residing in a country other than where they are born. According to a statistical report from UN, the number of migrants has more than doubled since 1975. In 2002, there were about 175 million persons (about 3% of the world population) residing outside the country of their birth, in which 60% oftheworld’smigrantsresided in the more developed regions and 40% in the less developed regions (UN, 2002). The importance of such a phenomenon has gained the recognition by scholars and policy makersalike.In 2001,theOECD Councilidentified “internationalmigration”asoneof the OECD's priorities. It stated that: "Migration is an increasingly pressing issue, for immigrant and emigrant countries, their governments and the general public. It raises a
hostofsocial,economic,developmentand foreign policy challengesand opportunities.” (OECD, 2005, quoted from the OECD Website “About International Migration”:
http://www.oecd.org/about/0,2337,en_2649_37415_1_1_1_1_37415,00.html).
In the field of international migration, several theoretical perspectives have developed in an attempt to grasp the complexity of human migration, including its causes, processes, and consequences (Arango, 2000; Ma, 2000; Massey and Espinosa, 1997; Portes, 1995; Stalker, 1994). Push-pull theory, based on neo-classical theory of rational choice, perceives migration as a result ofan individual’srationalcalculation on the “push” and “pull” factors structured in the countries of origin and destination. Human capital theory assumes migration as a mean to maximize the return of human capital. Neo-Marxist theory focuses on the historical and structural factors through which international migration is able to create and maintain international imbalance in power and division of labor. Neo-classical institutional theory views international migration as a surviving strategy utilized by family to pull resources and minimize risks. Theories of social network and social capital address the importance of transnational social networks in developing and maintaining international migration.
Empirically, several factors have been attributed to the increasing volume and significance of international migration: demographic decline (due to aging and low fertility), labor shortage, inequalities (such as differential development and income discrepancies) among countries and regions, historical ties between sending and receiving countries, increase in foreign investment, social networks, and change in migration policies (see, for example, Massey and Espinosa, 1997; Coppel, Dumont, and Visco, 2001; OECD, 2005; Rumbaut, Foner, and Gold, 1999).
With in mind these theoretical and empirical views on international migration, we now focus on the subject of student migration and examine the ways it is conceptualized in theory and empirical research.
Student Migration and the Internationalization of Higher Education
From the viewpoint of globalization, economic, political, and social integrations all demand for diversified linguistic and cultural knowledge, which becomes a driving force for students seeking trainings abroad. Moreover, the advancement in communication and transportation further makes the mobility easier (OECD, 2001).
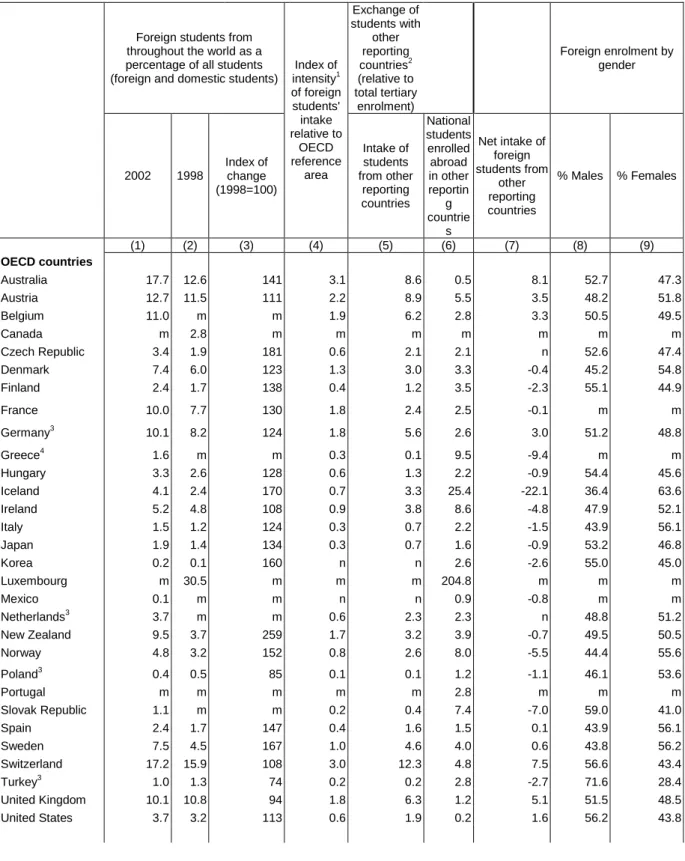
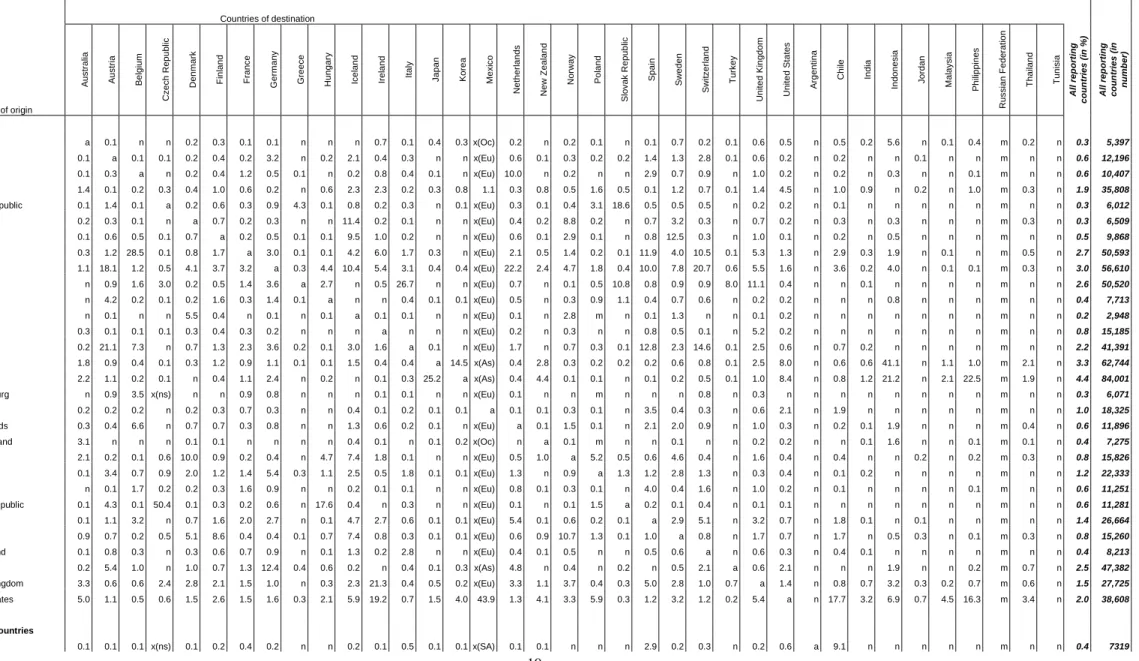
The flows of students studying abroad have been on a steady rise, so is its impact. The majority of foreign students are in higher/tertiary education (OECD, 2001). Table 1 showed that the percentage of foreign students in many OECD countries increased significantly in 2002. In 2002, there were about 1.9 millions of students pursuing higher education overseas, in which Asia was the main sending region (see Table 2). This trend is largely due to the fact that a number of countries (Australia, Canada and France, in particular) have introduced policies to attract more foreign students and to make it easier for them to find work and stay when they finish their studies. Between 2001 and 2003 the inflow of foreign students increased by more than 36% in the United Kingdom, 30% in France and 13% in Australia. Flows have been decreasing in the United States during the same period (-26%). Student mobility is also increasingly developing at a regional level (OECD, 2001). This trend applies in Asia where data display a significant development of the student immigration in Japan, Korea and China (OECD, 2004). The OECD statistics demonstrated some striking evidence of the intensity of the student migration within the Asian zone. For instance, Table 2 shows that 87.1% of the foreign students studying in Japan come from Asia. In Korea they are 66.9%, and 59.8% in Philippines. Last but not the least, Asia, being the top sending region of student migration, accounted for 45% of the overall student migrants worldwide (OECD, 2004).
For one thing, student mobility is considered to be part of the brain circulation (Salt, 1997). Student migrants carry both short-term and long-term impacts on the skilled labor markets and economies in both countries of origin and destination. With
the development of knowledge-based economy, there are growing efforts of national policy makers and of the firms to attract and keep foreign graduates. In several countries, policies further facilitate the recruitment of foreign graduates in making easier the transition of their student visas into employment visas (Ma, 1999; OECD, 2001, 2002). Apart from the academic competitiveness, enrollment of foreign students in public universities may be regarded as a part of the political and economical strategies to increase the human capital resources and to develop the productivity of the overall society (North, 1995).
Meanwhile, the internationalization of educational systems in many countries is in process: universities all over the world are competing for foreign students. On the one hand, as they have to pay the fees in most cases, they are contributing to some extent to the financing of the educational system in the host country. On the other hand, they are equally contributing to the economy as consumers. Indirect and long-term impacts can be foreseen, when taking into account the personal and institutional linkages and networking that result from living and studyingabroad.The“alumni”system allows universities to develop extended social networks among graduates, native and foreign alike.
What motivates students to move overseas to study? It is suggested that the factors determining student mobility includes the effect of centers of expertise, the role of linguistic and cultural barriers, and the influence of institutional factors (such as government policies and agreements between universities as well as states) (OECD, 2001). According to Mazzarol and Soutar (2001),students’decision to study overseas are influenced by the following five factors: (1) a perception that an overseas course of study isbetterthan a localone;(2)astudent’sability to gain entry to localprogram;(3) the lack of access to higher educational opportunities locally; (4) a desire to get a better understanding of the West; (5) an intention to eventual migration after graduation. To many individuals and countries, foreign study represents an important educational option. This option not only can serve as a supplement where the local systems and
resources of higher education are limited, it also can satisfy the desire for cross-cultural experiences. In some cases, it can even be utilized as a mean to relieve from the high demands of local academic systems (Barber, 1984). From a policy-oriented perspective, the internationalization of higher education not only brings welcoming diversities to the academic structure and programs, but also creates a channel for attracting the highly skilled labor force by training them (Goedegebuure et al, 1993; OECD, 2001).
The phenomenon of student migration is often discussed from two perspectives: the expansion of internationally mobile labor force and the growth of a global market for higher education. From the first perspective, student migration demonstrates a significant part of professional migration, for the international movement of professionals often begins with their entry to college and graduate programs at the universities at host countries (Choi, 1995, Ma, 1999; NSF, 1998). The migration of the highly skilled has become increasingly significant in numbers and influence (Ma, 1999; OECD, 2005). The mobility of the highly skilled is stimulated by the development of the international labor market, the expansion of world trade and the growth of transnational cooperation (Salt, 1997; OECD, 2002). Professionals not only are drawn to capital-intensive countries for better returns, they also move along with the capitals flowing across regions and states (Stalker, 1994, 2000). Moreover, economic objectives, always a feature of immigration policy, have increasingly become a driving force in immigration policy-making in many countries, leading to policies that favor the highly skilled (Portes and Böröcz, 1989; Ma, 1999; Salt, 1989; Tapinos, 2000).
From the second perspective, international migration of students is considered as a result of the commercialization and internationalization of higher education. The development of a mass higher education is deeply tied to social, economic, cultural, scientific, and academic modernalizations (Scott, 1995). The growing need from the general public for greater educational and economic opportunities, along with the movement to life-long learning, sets off the development of a mass higher education (Knight, 2002; Stadtman, 1980). This calls for a rapid expansion and diversification of
higher education system, which make way for the commodification and internationalization of higher education (Shumar, 1997; OECD, 2001).
Commercial practices in higher education are not a new phenomenon. In the early 1900s, some universities in the United States had started utilized means (such as advertising) to attract students and enhance visibility. What is new about today’s commercial practices in higher education is their unprecedented size and scope (Bok, 2003). The growth in international education as an “export industry” has recently encouraged social scientists to analyze students and their impact on public policy (Altbach et al., 1985; Altbach et al., 1989; Mazzarol and Soutar, 2001). Among a variety of delivery schemes incorporated in international trade of education services today, student migration is still the mostly commonly utilized method; i.e., students moving from their countries of origin to countries of destination to pursue their study.1
Using American higher education as example, Bok (2003) argued that the commercialization of higher education is caused by the following factors: (1) government financial cutbacks; (2) the growing spirit of private enterprise and entrepreneurship; (3) a lack of clarity about academic values; (4) rigorous competition among institutions for students, resources, and reputation; and (5) a more technologically sophisticated, knowledge-based economy which provides academic institutions with more money-making opportunities. The commercialization of higher education entails both benefits and costs. On the one hand, it brings profits to universities, which in turn creates incentives for universities to benefit the public. On the other hand, it results in undermining academic standards, damaging the academic community, and risking the reputation of academic institutions (Bok, 2003).
For most parts of Asia, higher education is distinguished with the elite nature (Yee, 1995). Entry exams in Asia are typically competitive and comprise of 1 In the late-20th century, new delivery systems involving information and communication technologies (ICT) and the establishment of offshore teching programs by host country institutions started to emerge as alternative options (Mazzarol and Soutar, 2001).
subject-oriented tests. As many Asian countries are dependent on a technologically literate population and actively developing vocational education, the traditional university system is still widely perceived as a highway to success. In Taiwan, Japan,
Singapore, Hong Kong, and South Korea, one’s success is strongly tied to a prestigious
university (Boyd and Lee, 1995). At the same time, systems of higher education in Asia are also characterized by diversity. The supply of student places at prestigious universities in many Asian countries has not changed to keep pace with the increasing demand for higher education. Therefore, profit-oriented enterprises proliferate to provide educational services beyond the scope of public and reputable private schools. The expanding commercialization of higher education often results in negative consequences, especially when quality controls are weak and ineffective (Yee and Ghee, 1995).
Student Migration to Taiwan: The Experience and Unresolved Issues
After reviewing the current theoretical and empirical discussions on international migration in general and student migration in particular, I will bring the focus further down to the case of Taiwan. Taiwan provides an excellent choice to study the topic of student migration, for Taiwan has experienced significant outflows and inflows of student migrants. For decades, Taiwan was one of the countries in the world suffering the most from the outflows of the highly skilled human power, and many migrated as students pursuing advanced degrees in developed countries (mainly the United States) (Ma, 1999). Several factors contributed to such a huge outflow of student migration: changes in U.S. immigration laws, the ease of strict restrictions from the Taiwanese government for student migration and the increase in the number of government sponsorship for overseas studies (Chang, 1992; Ma, 1999; Ruth, 1970). However, starting in the mid-1980s, more and more students returned (Executive Yuan, 1992; Ministry of Education et al., 1996).
Taiwanese is the increase of foreign students in Taiwan pursuing higher education and other trainings (such as language training). The presence of foreign students in Taiwan is not new, for since the 1950s Taiwanese government has made great efforts to attract students from overseas (教育計畫小組及僑民教育委員會,1982;陳月萍,2003). Nevertheless, for a long time this effort focused mainly on overseas ethnic Chinese, only until recent years did it expand its scope to attract foreign students in general. Taiwanese government started establishing educational plans for overseas ethnic Chinese ( 華僑 ) in the 1950s with the aids from the United States. The KMT government was clear of the economic resources and power possessed by overseas ethnic Chinese, especially those in South-East Asia. Yet, it also well understood the fact
that most overseas Chinese much strongly identified with China as their “home”than
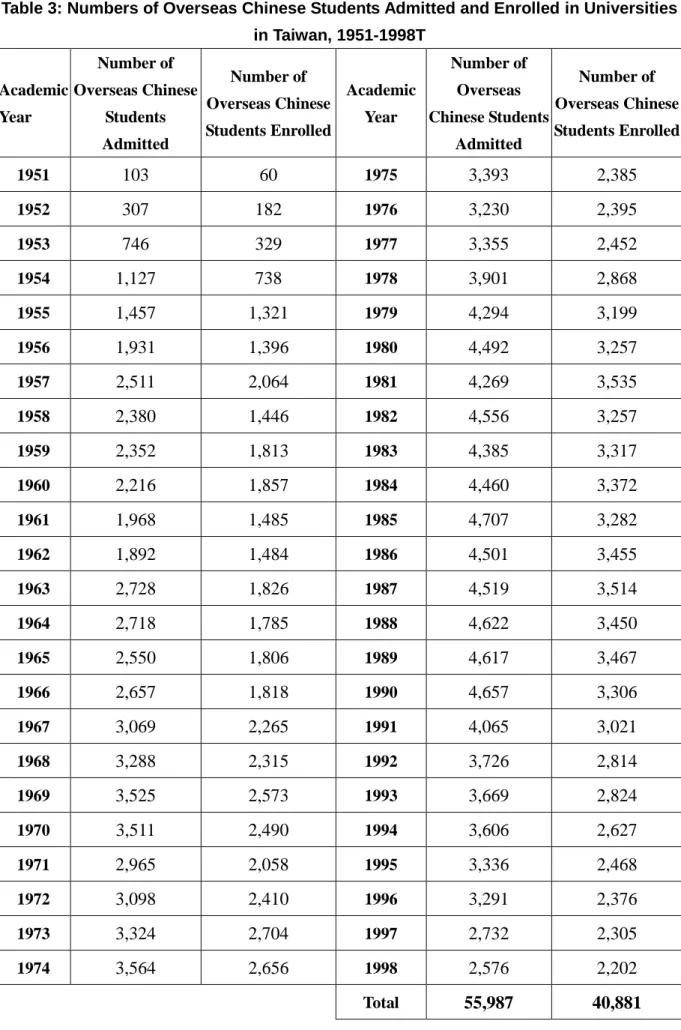
with Taiwan.By providing opportunitiesto overseasethnicChineseto receive“Chinese culture” and to pursue higher education, these educational plans enabled Taiwan to establish strong ties with overseas ethnic Chinese once they returned to their home countries. In addition, education was utilized by the Taiwanese government as an effective mechanism of nationalism and anti-communism to cultivate overseas ethnic Chinese students (僑生) (張希哲,1991;陳月萍,2003;教育部教育計畫小組及僑 民教育委員會,1982). The result of these educational plans has been perceived as relatively successful. The numbers of overseas ethnic Chinese studying in Taiwan soon surged, with a peak of 3,514 in 1987 (see Table 3). However, the flows gradually decline, possibly due to the changes in educational policy in Taiwan as well as the rapid economic developments in South-East Asian countries (李明儀,1991).
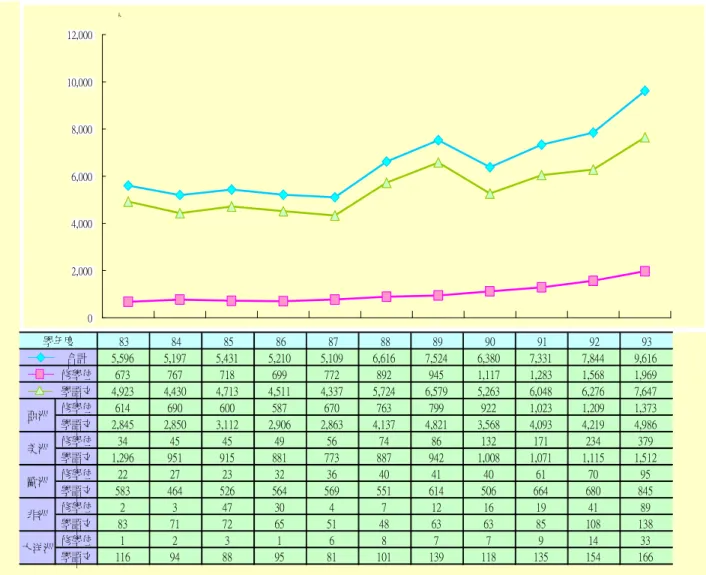
Although the immigration of overseas ethnic Chinese students started to decrease in the late 1980s, the total number of foreign students in Taiwan has been on the rise, and the composition of these student migrants have become more versatile. Taiwan has gradually become the destination for foreign students; they study not only for Chinese language, but also for college and advanced degrees. Figure 1 and Table 4 show that from 1994 to 2004, the numbers of foreign students studying in Taiwan had
almost doubled (from 5,596 to 9,616), in which over 50% of foreign students came from Asia alone. In addition, the data also demonstrated that more and more foreign students in Taiwan are pursuing formal college or advanced degrees than receiving language training. According to the statistical reports from the Ministry of Education, in 2004 Taiwan has foreign students from 128 countries and all five continents, in which Asian countries provides the highest numbers students studying in Taiwan (教育部網頁,
2005,http://www.edu.tw/EDU_WEB/EDU_MGT/STATISTICS/EDU7220001/overview/brief.)
The increasing flows of foreign students in Taiwan may be a result from the policy orientation of the Taiwanese government in the internationalization of higher
education. In recent years, the Ministry of Education in Taiwan has clearly stated “the
internationalization of higher education”to be one of the policy imperatives. This policy imperative consists of two parts: one is to attract more students from abroad to study in Taiwan, and the other is to encourage students to study abroad for higher education. In order to stimulate student migration to Taiwan for higher education, the Ministry not only sets up fellowships and plans to increase the number of fellowships in the future; it also encourages colleges and universities in Taiwan to provide fellowship opportunities for foreign students. In addition, colleges and universities are asked to promote themselves in the international market of higher education to enhance their visibility and competitiveness (文建會,2005).
Nevertheless, much more needs to be learned on the phenomenon of student migration to Taiwan. Current studies on foreign students in Taiwan were mostly on overseas ethnic Chinese, and they mainly focused on the policy issues or the adjustment experiences of these students. The data were generally very small in size (see, for example, 方慧,1996;黃璉華,1996). Studied on foreign students who are not ethnic Chinese are scarce, possibly due to the fact that the increasing flows of foreign student immigration is a rather recent phenomenon. Moreover, the linkage between student migration to Taiwan and the internationalization (and commercialization) of higher education in Taiwan is far from clear. A comprehensive and up-dated investigation on
this issue is much needed.
Research Questions and Methods
Research Framework and QuestionsIn response to this call, this proposed project will focus on two levels of examination on the subject. At the individual level, I would like to grasp the migration experiences offoreign studentsin Taiwan’shighereducation.Theresearch questions entailed are:
(1) What is their migration decision-making process? That is, why and how
do they decide to study overseas, and particularly in Taiwan?
(2) What are their experiences of social and cultural adjustments in the host
country (Taiwan)?
(3) How are their social networks established and maintained in the
countries of origin and destination?
(4) What are their post-graduation plans?
At the structural level, I would like to investigate the structural contexts in which student migration is formed, maintained, and developed. Especially, I would like to focus my investigation on the linkage between student migration and the internationalization of higher education in Taiwan. The main issues in exploration are:
(1) What are the policies, at national and university levels, guiding student
migration? How significant is their impact on the phenomenon of student migration?
(2) The characteristics of social, cultural, economic, and political milieus
(3) The demographic features of foreign student migrants.
(4) The development of higher education in Taiwan, especially on the aspect
of internationalization and commercialization of the system.
(5) The linkage between student migration to Taiwan and the
internationalization of Taiwan’s higher education.
Due to a heavy representation of Asians in the population of foreign students in Taiwan,theproposed study willfocusthesubjectofexploration on Asian students’ migration to Taiwan.
Research Methods
The proposed research is designed to be a two-year project. It will utilize both quantitative and qualitative measures to study the topic, and it will consist of three data resources. First, existing statistical data and literature on the issue of student migration will be collected and reviewed. In addition, data on government policies related to student migration will also be assembled and compiled.
Second, a qualitative field study will be conduct in the first project year. The purpose of the in-depth interviews consists of two dimensions. First, it will collect rich information from these informants on their migration experiences (including condition of their departure and factors considered in their migration decision-making process), the contexts of reception in Taiwan (accommodation condition, learning environment, work environment, etc.), their adjustment experiences and integration strategies, study plans, social networks, and post-graduation plans. Second, the results of this qualitative study will be utilized to develop a survey questionnaire for the quantitative study scheduled in the following project year. A drafted outline of interview questions is placed in Appendix 1 for reference.
two universities that have the highest numbers of foreign students. The following three-step strategy is used to identify the field site(s) as well as respondents for both in-depth interviews and the survey:
(1) Number of foreign students in Taiwan. If possible, I will make a distinction
between those foreign students enrolled in language programs and those who are enrolled in degree-granting programs.
(2) The percentage of foreign students in the capital region (Taipei).
(3) Select the top two universities with the highest foreign student enrollment in
the capital region (Taipei) (for the survey, respondents will be drawn from the Taipei metropolitan area).
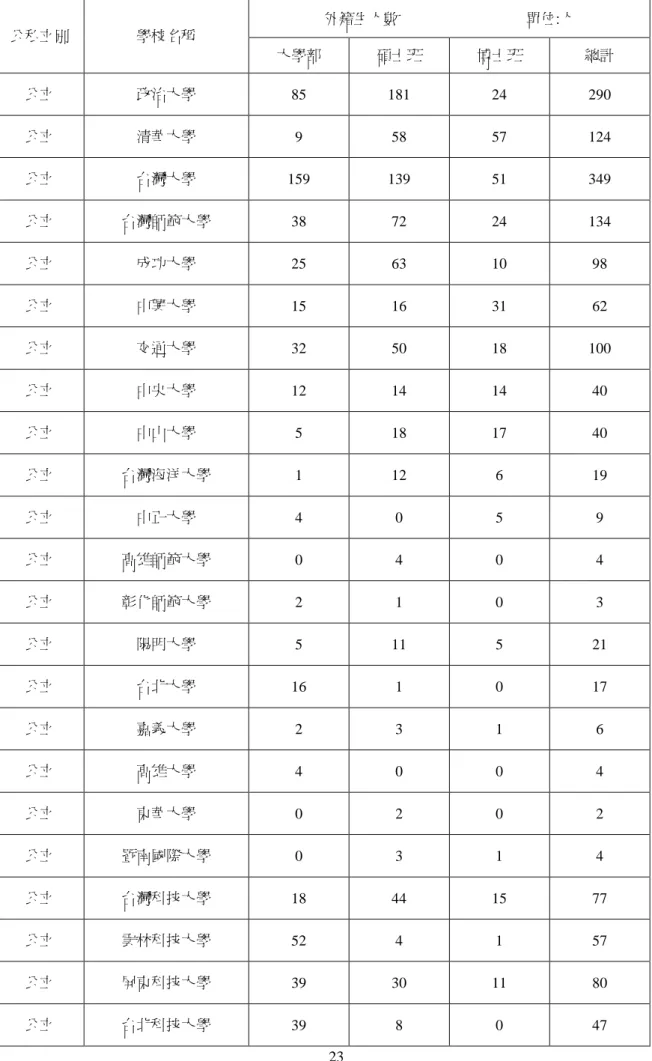
Based on the latest statistical data from the Ministry of Education, colleges and universities in the Taipei metropolitan area maintain the majority of foreign students, in which National Taiwan University is top on the list, followed by National Chengchi University; these two universities alone consist of 22.5% of the whole population of foreign students in higher education (see Table 5). Therefore, these two universities will be chosen as field sites for the case study.
Before the interviews, informants will be contacted (through departments and programs) and given introduction of this study as well as any necessary supplementary information (such as a consent form). The interviews will be semi-structured and conducted in either Chinese or English, depending on the preference of the informants.
The conversation will be recorded and transcribed, and the method of “grounded
theory”will be employed to analyze interview data.
Third, a survey on foreign students in Taiwan will be administered in person in the second project year to collect quantitative information. A sample of 500 will be drawn from the colleges and universities in the Taipei metropolitan area. The selection
of respondents is achieved using a purposive quota sampling strategy along the following five variables:
(1) Graduates versus Non-Graduate Students
The guideline is to select the graduate/undergraduate students according to the actual proportions of foreign students in Taiwan. For example, if there are 20% foreign graduates and 80% foreign undergraduates in Taiwan, the sample should reflect these proportions.
(2) Gender
The guideline is also to select males/ females according to actual proportions in the population.
(3) Country of Origin
20% from 1st
highest sending country;
20% from 2nd
highest sending country,
10% from the 3rd
highest sending country,
30% from all other East, South and Southeast Asian countries; and 20% non-Asians
(4) Discipline of Study
The guideline is to select the science/non-science students according to the actual proportions of foreign students in Taiwan.
(5) Ethnic Chinese Overseas Student vs. Others
Considering the significant presence of ethnic Chinese overseas students in the body of foreign students in Taiwan, the guideline is to select ethnic Chinese overseas student versus other foreign students who do not hold a Chinese ancestry according
to the actual proportions of these two groups in Taiwan.
Only foreign students who are enrolled in courses of study lasting for more than twelve months will be considered for the field study as well as the survey. These include students who are enrolled in language programs. A synthesis of research findings from both field study as well as the survey will be made toward the end of the second project year. For the more detailed timetable of this proposed research project, please refer to Table 6.
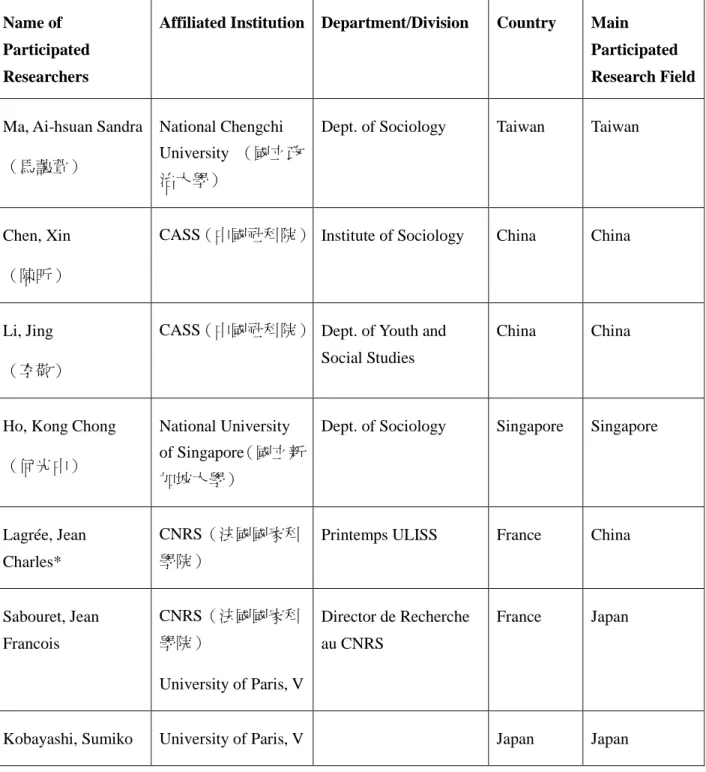
Although the proposed research is an independent study on student migration to Taiwan, it is also designed to be part of a collaborative investigation. Collaborate ties are formed among researchers from Taiwan, China, Japan, Singapore and France interested in student migration in Asia and planning on conducting research on the subject of student migration in their respective countries. A list of researchers in this team can be found in Table 7, and the research team’sobjectives can be found in Table 6. Meetings and workshops will be held during the project years to facilitate our cooperation (please refer to Table 7 for details).
Potential Contributions of the Study
This proposed project will bear many fruitful results. First, the results of this study will answer many questions concerning the phenomenon of student migration to Taiwan. At the micro level, the findings will help us to grasp the migration experiences of foreign students in Taiwan, their migration decision-making process as well as the contexts in which they make their decisions and moves. At the structural level, the
research outcomes of this study will illuminate the scope and intensity of Taiwan’s
higher educational system, discover its role and experience in the training and mobility of the highly skilled from overseas, and help us to envision the future development of both the higher educational system in Taiwan as well as student migration to Taiwan.
The results of this study will also be able to provide useful and insightful policy recommendations.
Second, by taking a part in this international research program on student mobility, Taiwan will not be a missing piece in an international effort to conduct a collaborative research on student migration in Asia and to build a comprehensive data bank (both qualitative and quantitative) on this subject. It has been pointed out by many researchers and organizations in international migration the difficulty in conducting cross-country comparative studies due to the incomparability of data among countries and regions (Kritz, 1987; OECD, 2001, 2005). Differences among host countries in their
definitions of “immigrant”and their policies in obtaining nationality, differences among
countries to implement and regulate migration policies, lack of commitment and resources on the part of agencies responsible for migration data –these all contribute to the difficulty in conducting cross-country comparative studies with high-quality and comparable data. In the case of Taiwan, the need to collect such data is especially pressing. It is very important to Taiwan considering that current major world statistics often do not present the information of Taiwan. Because Taiwan is considered by most
countries as a “part of China”and not an independent country, the data of Taiwan is
either missing or “hidden”in the data of China. This project on Taiwan will not only
inform us with the experience of Taiwan regarding student migration and higher education, the data bank compiled by the internationally collaborated research team will enable interested scholars to compare Taiwan with other countries in its experience on student immigration and the internationalization of higher education. I, as well as the rest of the researchers in this international research team, firmly believe that the findings of this project on Taiwan as well as our collaborated program on student mobility in Asia not only will make important contributions to the societies and academic communities in Taiwan and other countries in Asia, but also will be very significant to the international community.
Table 1. Exchange of students in tertiary education (2002)
Foreign students enrolled as a percentage of all students (foreign plus domestic) and exchange of students as a percentage of total tertiary enrolment
Reading the first column: 12.7% of all students in tertiary education in Austria are foreign students (from throughout the
world).
Reading the fourth column: Australia enrolls 3.1 times more foreign tertiary students than the average OECD country,
while
Finland's proportion of foreign students is 0.4 times the OECD average.
Reading the fifth column: Foreign tertiary students from other countries that report foreign students represent 8.9% of all
tertiary students in Austria.
Reading the sixth column: 5.5% of all tertiary students in Austria study in other countries that report foreign students.
Column 7 represents the difference between column 5 and column 6.
Foreign students from throughout the world as a percentage of all students (foreign and domestic students)
Exchange of students with other reporting countries2 (relative to total tertiary enrolment) Foreign enrolment by gender 2002 1998 Index of change (1998=100) Index of intensity1 of foreign students' intake relative to OECD reference area Intake of students from other reporting countries National students enrolled abroad in other reportin g countrie s Net intake of foreign students from other reporting countries % Males % Females (1) (2) (3) (4) (5) (6) (7) (8) (9) OECD countries Australia 17.7 12.6 141 3.1 8.6 0.5 8.1 52.7 47.3 Austria 12.7 11.5 111 2.2 8.9 5.5 3.5 48.2 51.8 Belgium 11.0 m m 1.9 6.2 2.8 3.3 50.5 49.5 Canada m 2.8 m m m m m m m Czech Republic 3.4 1.9 181 0.6 2.1 2.1 n 52.6 47.4 Denmark 7.4 6.0 123 1.3 3.0 3.3 -0.4 45.2 54.8 Finland 2.4 1.7 138 0.4 1.2 3.5 -2.3 55.1 44.9 France 10.0 7.7 130 1.8 2.4 2.5 -0.1 m m Germany3 10.1 8.2 124 1.8 5.6 2.6 3.0 51.2 48.8 Greece4 1.6 m m 0.3 0.1 9.5 -9.4 m m Hungary 3.3 2.6 128 0.6 1.3 2.2 -0.9 54.4 45.6 Iceland 4.1 2.4 170 0.7 3.3 25.4 -22.1 36.4 63.6 Ireland 5.2 4.8 108 0.9 3.8 8.6 -4.8 47.9 52.1 Italy 1.5 1.2 124 0.3 0.7 2.2 -1.5 43.9 56.1 Japan 1.9 1.4 134 0.3 0.7 1.6 -0.9 53.2 46.8 Korea 0.2 0.1 160 n n 2.6 -2.6 55.0 45.0 Luxembourg m 30.5 m m m 204.8 m m m Mexico 0.1 m m n n 0.9 -0.8 m m Netherlands3 3.7 m m 0.6 2.3 2.3 n 48.8 51.2 New Zealand 9.5 3.7 259 1.7 3.2 3.9 -0.7 49.5 50.5 Norway 4.8 3.2 152 0.8 2.6 8.0 -5.5 44.4 55.6 Poland3 0.4 0.5 85 0.1 0.1 1.2 -1.1 46.1 53.6 Portugal m m m m m 2.8 m m m Slovak Republic 1.1 m m 0.2 0.4 7.4 -7.0 59.0 41.0 Spain 2.4 1.7 147 0.4 1.6 1.5 0.1 43.9 56.1 Sweden 7.5 4.5 167 1.0 4.6 4.0 0.6 43.8 56.2 Switzerland 17.2 15.9 108 3.0 12.3 4.8 7.5 56.6 43.4 Turkey3 1.0 1.3 74 0.2 0.2 2.8 -2.7 71.6 28.4 United Kingdom 10.1 10.8 94 1.8 6.3 1.2 5.1 51.5 48.5 United States 3.7 3.2 113 0.6 1.9 0.2 1.6 56.2 43.8
Country mean 5.7 5.8 1.0 3.3 4.15 50.7 49.3 Partner countries Argentina3, 6, 7 0.2 m m n n 0.4 -0.3 m m Brazil m m m m m 0.5 m m m Chile 0.9 m m 0.2 0.4 1.0 -0.6 m m China m m m m m 1.4 m m m India7 0.1 m m n n 0.9 -0.9 m m Indonesia n m m n n 1.1 -1.1 m m Israel m m m m m 2.8 m m m Jamaica m m m m m 10.8 m m m Jordan4, 7 2.7 m m 0.5 0.1 3.5 -3.4 m m Malaysia7 3.0 m m 0.5 1.2 6.8 -5.5 m m Paraguay m m m m m 1.1 m m m Peru m m m m m 1.0 m m m Philippines 0.1 m m n 0.1 0.2 -0.2 m m Russian Federation3 0.9 m m 0.2 n 0.3 -0.3 m m Thailand8 0.2 m m n n 1.0 -1.0 m m Tunisia 1.1 m m 0.2 n 4.7 -4.7 m m Uruguay m m m m m 1.5 m m m Zimbabwe m m m m m 9.8 m m m
1. The index compares the numbers of foreign students as a proportion of domestic enrolments with the average order of magnitude for OECD countries. This makes it possible to refine the scale of foreign student intakes based on the size of the tertiary education system. An index higher (lower) than 1 reflects a higher (lower) intake as a proportion of enrolments compared with the OECD mean.
2. Data in columns 5 to 7 do not show the exchange of students throughout the world. Coverage is limited to the OECD and non-OECD countries shown in the table that report data in column 1. Therefore data are not comparable to those reported in column 1.
3. Excluding advanced research programs. 4. Excluding tertiary-type B programs. 5. Country mean excludes Luxembourg. 6. Excluding tertiary-type A programs. 7. Year of reference 2001.
8. The number of foreign students is significantly under-estimated. See annex 3 for details and notes (www.oecd.org/edu/eag2004).
Source: OECD, 2004, Education at a Glance-Tables
Table 2. Foreign students in tertiary education by country of origin (2002)
Number of foreign students enrolled in tertiary education from a given country of origin as a percentage of all foreign students in the country of destination, numbers of foreign students from all countries of origins, and numbers of foreign students in all countries of destination, based on head counts
The table shows for each country the proportion of foreign students in tertiary education that have Citizenship of a given country of origin. Reading the third column: 28.5% of Belgium foreign tertiary students are French citizens, 6.6% of Belgium foreign students are Dutch citizens, etc.
Reading the first row: 0.2% of foreign tertiary students in Denmark are Australian citizens, 0.7% of foreign tertiary students in Ireland are Australian citizens, etc.
Countries of destination Countries of origin A u s tr a lia A u s tr ia B e lg iu m C z e c h R e p u b lic D e n m a rk F in la n d F ra n c e G e rm a n y G re e c e H u n g a ry Ic e la n d Ir e la n d It a ly J a p a n K o re a M e x ic o N e th e rl a n d s N e w Z e a la n d N o rw a y P o la n d S lo v a k R e p u b lic S p a in S w e d e n S w it z e rl a n d T u rk e y U n it e d K in g d o m U n it e d S ta te s A rg e n ti n a C h ile In d ia In d o n e s ia J o rd a n M a la y s ia P h ili p p in e s R u s s ia n F e d e ra ti o n T h a ila n d T u n is ia A ll re p o rt in g c o u n tr ie s (i n % ) A ll re p o rt in g c o u n tr ie s (i n n u m b e r) Australia a 0.1 n n 0.2 0.3 0.1 0.1 n n n 0.7 0.1 0.4 0.3 x(Oc) 0.2 n 0.2 0.1 n 0.1 0.7 0.2 0.1 0.6 0.5 n 0.5 0.2 5.6 n 0.1 0.4 m 0.2 n 0.3 5,397 Austria 0.1 a 0.1 0.1 0.2 0.4 0.2 3.2 n 0.2 2.1 0.4 0.3 n n x(Eu) 0.6 0.1 0.3 0.2 0.2 1.4 1.3 2.8 0.1 0.6 0.2 n 0.2 n n 0.1 n n m n n 0.6 12,196 Belgium 0.1 0.3 a n 0.2 0.4 1.2 0.5 0.1 n 0.2 0.8 0.4 0.1 n x(Eu) 10.0 n 0.2 n n 2.9 0.7 0.9 n 1.0 0.2 n 0.2 n 0.3 n n 0.1 m n n 0.6 10,407 Canada 1.4 0.1 0.2 0.3 0.4 1.0 0.6 0.2 n 0.6 2.3 2.3 0.2 0.3 0.8 1.1 0.3 0.8 0.5 1.6 0.5 0.1 1.2 0.7 0.1 1.4 4.5 n 1.0 0.9 n 0.2 n 1.0 m 0.3 n 1.9 35,808
Czech Republic 0.1 1.4 0.1 a 0.2 0.6 0.3 0.9 4.3 0.1 0.8 0.2 0.3 n 0.1 x(Eu) 0.3 0.1 0.4 3.1 18.6 0.5 0.5 0.5 n 0.2 0.2 n 0.1 n n n n n m n n 0.3 6,012
Denmark 0.2 0.3 0.1 n a 0.7 0.2 0.3 n n 11.4 0.2 0.1 n n x(Eu) 0.4 0.2 8.8 0.2 n 0.7 3.2 0.3 n 0.7 0.2 n 0.3 n 0.3 n n n m 0.3 n 0.3 6,509 Finland 0.1 0.6 0.5 0.1 0.7 a 0.2 0.5 0.1 0.1 9.5 1.0 0.2 n n x(Eu) 0.6 0.1 2.9 0.1 n 0.8 12.5 0.3 n 1.0 0.1 n 0.2 n 0.5 n n n m n n 0.5 9,868 France 0.3 1.2 28.5 0.1 0.8 1.7 a 3.0 0.1 0.1 4.2 6.0 1.7 0.3 n x(Eu) 2.1 0.5 1.4 0.2 0.1 11.9 4.0 10.5 0.1 5.3 1.3 n 2.9 0.3 1.9 n 0.1 n m 0.5 n 2.7 50,593 Germany 1.1 18.1 1.2 0.5 4.1 3.7 3.2 a 0.3 4.4 10.4 5.4 3.1 0.4 0.4 x(Eu) 22.2 2.4 4.7 1.8 0.4 10.0 7.8 20.7 0.6 5.5 1.6 n 3.6 0.2 4.0 n 0.1 0.1 m 0.3 n 3.0 56,610 Greece n 0.9 1.6 3.0 0.2 0.5 1.4 3.6 a 2.7 n 0.5 26.7 n n x(Eu) 0.7 n 0.1 0.5 10.8 0.8 0.9 0.9 8.0 11.1 0.4 n n 0.1 n n n n m n n 2.6 50,520 Hungary n 4.2 0.2 0.1 0.2 1.6 0.3 1.4 0.1 a n n 0.4 0.1 0.1 x(Eu) 0.5 n 0.3 0.9 1.1 0.4 0.7 0.6 n 0.2 0.2 n n n 0.8 n n n m n n 0.4 7,713 Iceland n 0.1 n n 5.5 0.4 n 0.1 n 0.1 a 0.1 0.1 n n x(Eu) 0.1 n 2.8 m n 0.1 1.3 n n 0.1 0.2 n n n n n n n m n n 0.2 2,948 Ireland 0.3 0.1 0.1 0.1 0.3 0.4 0.3 0.2 n n n a n n n x(Eu) 0.2 n 0.3 n n 0.8 0.5 0.1 n 5.2 0.2 n n n n n n n m n n 0.8 15,185 Italy 0.2 21.1 7.3 n 0.7 1.3 2.3 3.6 0.2 0.1 3.0 1.6 a 0.1 n x(Eu) 1.7 n 0.7 0.3 0.1 12.8 2.3 14.6 0.1 2.5 0.6 n 0.7 0.2 n n n n m n n 2.2 41,391 Japan 1.8 0.9 0.4 0.1 0.3 1.2 0.9 1.1 0.1 0.1 1.5 0.4 0.4 a 14.5 x(As) 0.4 2.8 0.3 0.2 0.2 0.2 0.6 0.8 0.1 2.5 8.0 n 0.6 0.6 41.1 n 1.1 1.0 m 2.1 n 3.3 62,744 Korea 2.2 1.1 0.2 0.1 n 0.4 1.1 2.4 n 0.2 n 0.1 0.3 25.2 a x(As) 0.4 4.4 0.1 0.1 n 0.1 0.2 0.5 0.1 1.0 8.4 n 0.8 1.2 21.2 n 2.1 22.5 m 1.9 n 4.4 84,001 Luxembourg n 0.9 3.5 x(ns) n n 0.9 0.8 n n n 0.1 0.1 n n x(Eu) 0.1 n n m n n n 0.8 n 0.3 n n n n n n n n m n n 0.3 6,071 Mexico 0.2 0.2 0.2 n 0.2 0.3 0.7 0.3 n n 0.4 0.1 0.2 0.1 0.1 a 0.1 0.1 0.3 0.1 n 3.5 0.4 0.3 n 0.6 2.1 n 1.9 n n n n n m n n 1.0 18,325 Netherlands 0.3 0.4 6.6 n 0.7 0.7 0.3 0.8 n n 1.3 0.6 0.2 0.1 n x(Eu) a 0.1 1.5 0.1 n 2.1 2.0 0.9 n 1.0 0.3 n 0.2 0.1 1.9 n n n m 0.4 n 0.6 11,896
New Zealand 3.1 n n n 0.1 0.1 n n n n 0.4 0.1 n 0.1 0.2 x(Oc) n a 0.1 m n n 0.1 n n 0.2 0.2 n n 0.1 1.6 n n 0.1 m 0.1 n 0.4 7,275
Norway 2.1 0.2 0.1 0.6 10.0 0.9 0.2 0.4 n 4.7 7.4 1.8 0.1 n n x(Eu) 0.5 1.0 a 5.2 0.5 0.6 4.6 0.4 n 1.6 0.4 n 0.4 n n 0.2 n 0.2 m 0.3 n 0.8 15,826
Poland 0.1 3.4 0.7 0.9 2.0 1.2 1.4 5.4 0.3 1.1 2.5 0.5 1.8 0.1 0.1 x(Eu) 1.3 n 0.9 a 1.3 1.2 2.8 1.3 n 0.3 0.4 n 0.1 0.2 n n n n m n n 1.2 22,333
Portugal n 0.1 1.7 0.2 0.2 0.3 1.6 0.9 n n 0.2 0.1 0.1 n n x(Eu) 0.8 0.1 0.3 0.1 n 4.0 0.4 1.6 n 1.0 0.2 n 0.1 n n n n 0.1 m n n 0.6 11,251
Slovak Republic 0.1 4.3 0.1 50.4 0.1 0.3 0.2 0.6 n 17.6 0.4 n 0.3 n n x(Eu) 0.1 n 0.1 1.5 a 0.2 0.1 0.4 n 0.1 0.1 n n n n n n n m n n 0.6 11,281
Spain 0.1 1.1 3.2 n 0.7 1.6 2.0 2.7 n 0.1 4.7 2.7 0.6 0.1 0.1 x(Eu) 5.4 0.1 0.6 0.2 0.1 a 2.9 5.1 n 3.2 0.7 n 1.8 0.1 n 0.1 n n m n n 1.4 26,664
Sweden 0.9 0.7 0.2 0.5 5.1 8.6 0.4 0.4 0.1 0.7 7.4 0.8 0.3 0.1 0.1 x(Eu) 0.6 0.9 10.7 1.3 0.1 1.0 a 0.8 n 1.7 0.7 n 1.7 n 0.5 0.3 n 0.1 m 0.3 n 0.8 15,260
Switzerland 0.1 0.8 0.3 n 0.3 0.6 0.7 0.9 n 0.1 1.3 0.2 2.8 n n x(Eu) 0.4 0.1 0.5 n n 0.5 0.6 a n 0.6 0.3 n 0.4 0.1 n n n n m n n 0.4 8,213
Turkey 0.2 5.4 1.0 n 1.0 0.7 1.3 12.4 0.4 0.6 0.2 n 0.4 0.1 0.3 x(As) 4.8 n 0.4 n 0.2 n 0.5 2.1 a 0.6 2.1 n n n 1.9 n n 0.2 m 0.7 n 2.5 47,382
United Kingdom 3.3 0.6 0.6 2.4 2.8 2.1 1.5 1.0 n 0.3 2.3 21.3 0.4 0.5 0.2 x(Eu) 3.3 1.1 3.7 0.4 0.3 5.0 2.8 1.0 0.7 a 1.4 n 0.8 0.7 3.2 0.3 0.2 0.7 m 0.6 n 1.5 27,725
United States 5.0 1.1 0.5 0.6 1.5 2.6 1.5 1.6 0.3 2.1 5.9 19.2 0.7 1.5 4.0 43.9 1.3 4.1 3.3 5.9 0.3 1.2 3.2 1.2 0.2 5.4 a n 17.7 3.2 6.9 0.7 4.5 16.3 m 3.4 n 2.0 38,608
Brazil 0.2 0.2 0.4 n 0.4 0.4 0.9 0.7 n n 0.2 n 0.9 0.5 0.1 x(SA) 0.3 0.1 0.3 0.4 0.2 2.7 0.3 0.8 n 0.4 1.5 5.9 3.9 n n n n n m n n 0.9 16362 Chile 0.1 0.1 0.3 n 0.1 0.2 0.2 0.2 n n n n 0.3 0.1 0.1 x(SA) 0.2 0.2 0.6 n 0.1 1.9 0.9 0.3 n 0.1 0.3 21.6 n n n n n n m n n 0.3 5346 China 9.7 1.4 2.0 0.1 2.6 15.2 3.3 6.4 0.2 0.5 2.1 1.7 0.4 55.0 48.6 x(As) 4.3 47.9 2.5 0.5 0.1 0.5 2.3 1.6 0.5 7.7 10.8 n 0.9 0.3 0.5 n 29.4 25.8 m 23.1 n 9.6 181684 Egypt 0.1 0.5 0.2 0.1 0.1 0.2 0.5 0.6 0.3 0.1 n 0.1 0.3 0.3 n x(Af) 0.1 n 0.1 n 1.2 0.1 0.1 0.2 0.3 0.3 0.4 n n 0.1 n 0.9 0.1 0.1 m n n 0.3 6215 India 5.3 0.3 0.3 0.4 0.2 0.8 0.2 1.0 n 0.5 0.2 1.2 0.5 0.3 1.0 x(As) 0.3 5.4 1.2 0.3 0.4 0.1 0.4 0.6 n 2.6 11.5 n 0.2 a 0.3 0.3 3.0 3.1 m 2.5 n 4.7 87987 Indonesia 7.6 0.1 0.2 n 0.1 0.3 0.1 1.0 n n 0.2 0.1 n 1.7 0.8 x(As) 3.0 2.1 0.1 0.1 n n 0.1 0.2 n 0.4 2.0 n n 1.2 a 0.3 28.4 3.6 m 0.6 n 1.9 36086 Jamaica n n n x(ns) n n n n n n n n m n n x(NA ) n n n m n n n n n 0.2 0.7 n 0.1 n n n n n m n n 0.3 4841 Jordan 0.2 0.2 n 0.3 n 0.1 0.1 0.5 0.7 0.2 0.4 0.2 0.4 n n x(As) n n 0.1 0.6 0.7 0.1 0.1 0.1 1.2 0.3 0.4 n n 0.7 0.3 n 0.9 n m n n 0.3 5646 Malaysia 9.8 n n n n 0.2 0.1 0.1 n n n 5.6 n 2.2 0.9 x(As) 0.1 5.0 0.1 n n n 0.1 n n 4.0 1.3 n n 1.9 n n n 0.5 m 1.4 n 2.0 37809 Paraguay n n n 0.1 n n n n n n n n n 0.1 0.3 x(SA) n n n n n 0.1 n n n n 0.1 11.2 1.0 n n n n 0.1 m n n 0.1 1037 Peru n 0.2 0.2 0.1 0.1 0.2 0.2 0.4 n n n 0.1 1.2 0.2 n x(SA) 0.1 0.1 0.2 0.1 0.1 2.4 0.2 0.6 n 0.1 0.5 10.3 15.6 n n n n n m n n 0.4 7747 Philippines 0.5 n 0.1 n 0.2 0.4 n 0.1 n n 0.6 n 0.1 0.6 1.0 x(As) 0.2 0.3 0.2 0.1 n 0.1 0.1 0.1 n 0.1 0.6 n n n 0.5 0.3 0.2 a m 0.9 n 0.3 5708
Russian Federation 0.3 0.9 0.7 2.1 1.3 13.5 1.2 4.1 0.9 1.8 2.3 0.6 0.8 0.4 2.0 x(Eu) 1.4 0.3 4.8 3.9 2.9 0.3 2.0 1.6 5.2 0.6 1.2 n 0.2 0.2 a 0.2 n 0.1 a 0.5 n 1.4 25671
Sri Lanka 1.5 n n 0.1 0.1 0.1 0.1 0.1 n n n 0.1 n 0.5 0.1 x(As) 0.1 0.6 1.0 n n n 0.2 0.1 n 0.7 0.4 n n 4.9 n 15.9 0.3 0.2 m 0.4 n 0.5 8538
Thailand 2.8 0.1 0.1 n 0.3 0.3 0.2 0.3 n n n 0.1 n 1.7 0.1 x(As) 0.1 1.9 0.2 n 0.1 n 0.3 0.1 n 1.1 2.0 n n 3.3 2.1 0.2 1.1 3.1 m a n 1.2 22498
Tunisia n 0.1 0.7 n n 0.1 4.7 0.7 n n 0.2 n 0.4 0.1 n x(Af) 0.1 n 0.1 0.2 n n n 0.7 0.1 n 0.1 n n n n 0.1 n n m n a 0.6 10589
Uruguay n n n n n n n n n n n n n n n x(SA) n 0.1 n m n 0.4 n 0.1 n n 0.1 15.0 1.3 n n 0.1 n n m n n 0.1 1470
Zimbabwe 0.4 n n 0.1 0.1 n n n n n n 0.1 n n n x(Af) n 0.1 0.2 n 0.1 n n n n 1.2 0.3 n n 0.1 n n n n m n n 0.3 5702
Total: OECD and partner countries
Total: Africa 3.5 2.2 28.8 2.3 2.9 11.3 53.3 9.5 2.1 1.4 1.9 5.4 7.7 1.0 1.3 1.0 14.2 1.1 8.2 3.7 7.2 9.7 2.3 6.6 2.3 8.3 6.5 x(ns) 0.2 38.1 0.8 3.2 9.5 3.2 m 0.4 72.1 11.0 207154
Total: Asia 66.7 12.7 7.0 8.4 8.3 25.8 13.9 34.5 85.9 15.1 6.8 24.9 10.4 92.2 88.6 1.4 20.1 78.4 11.6 15.1 24.8 2.6 8.9 8.4 64.3 35.6 62.5 x(ns) 3.9 49.6 70.6 93.1 84.2 76.5 43.4 74.6 25.1 45.4 857269
Total: Europe 10.4 82.2 59.7 66.4 44.5 55.0 25.6 50.5 11.4 80.6 80.1 46.6 72.5 2.9 3.7 5.9 57.0 7.4 54.6 72.7 66.5 61.7 60.0 78.8 32.9 45.4 13.8 x(ns) 14.5 2.3 13.5 2.7 1.5 1.6 24.6 3.3 2.9 30.4 573725
Total: North America 6.7 1.5 1.2 1.0 2.2 4.3 3.5 2.5 0.3 2.7 9.1 22.0 1.8 2.1 5.1 71.5 1.9 5.2 4.4 7.7 1.0 7.1 5.1 2.5 0.3 8.5 10.2 x(ns) 29.2 4.1 6.9 0.9 4.6 17.4 m 3.8 n 6.4 121032
Total: Oceania 4.4 0.1 n n 0.3 0.5 0.1 0.2 n n 0.4 0.8 0.1 0.6 0.5 0.1 0.2 7.4 0.3 0.1 n 0.1 0.8 0.2 0.2 0.8 0.8 x(ns) 0.5 0.6 8.2 n 0.1 1.2 m 0.3 n 0.9 17810
Total: South America 0.9 0.9 1.8 0.8 0.9 1.2 2.9 2.1 0.1 0.2 1.3 0.4 4.7 1.1 0.7 20.1 5.9 0.7 1.6 0.8 0.5 18.8 2.1 3.3 n 1.2 6.1 80.7 51.8 0.1 n 0.1 n 0.2 m n n 3.7 70036
Not specified 7.4 0.4 1.5 21.0 40.9 2.0 0.7 0.8 n n 0.4 n 2.9 n n n 0.5 n 19.2 n n n 20.7 0.2 n 0.3 n 19.3 n 5.2 n n n n 32.0 n n 2.3 1898250
Total (in %): All countries
of origin 100 100 100 100 100 100 100 100 100 100 100 100 100 100 100 100 100 100 100 100 100 100 100 100 100 100 100 100 100 100 100 100 100 100 100 100 100 Total (in number)
(worldwide) 1796 19 2845 2 4035 4 9753 1448 0 6760 1654 37 2190 39 8615 1178 3 472 9206 2844 7 7489 2 4956 1892 1888 8 1770 9 7679 7401 1643 4486 0 2285 9 2930 1 1632 8 2272 73 5829 92 3343 4883 7791 377 4363 1648 0 2609 7073 5 4092 2487 Note:
(1) x indicates that the data are included n the totals for Africa (x(A), Asia (x(As)), Europe (x(Eu)), North America (x(NA)), Oceania (x(Oc)), South America (x(SA)) or not specified
(2) Total numbers of foreign students received in all countries of destination and total numbers of students from all regions of origin indicate foreign students from both OECD non-OECD countries.
Source: 教育部統計處,1999。
Table 3: Numbers of Overseas Chinese Students Admitted and Enrolled in Universities in Taiwan, 1951-1998T Academic Year Number of Overseas Chinese Students Admitted Number of Overseas Chinese Students Enrolled Academic Year Number of Overseas Chinese Students Admitted Number of Overseas Chinese Students Enrolled 1951 103 60 1975 3,393 2,385 1952 307 182 1976 3,230 2,395 1953 746 329 1977 3,355 2,452 1954 1,127 738 1978 3,901 2,868 1955 1,457 1,321 1979 4,294 3,199 1956 1,931 1,396 1980 4,492 3,257 1957 2,511 2,064 1981 4,269 3,535 1958 2,380 1,446 1982 4,556 3,257 1959 2,352 1,813 1983 4,385 3,317 1960 2,216 1,857 1984 4,460 3,372 1961 1,968 1,485 1985 4,707 3,282 1962 1,892 1,484 1986 4,501 3,455 1963 2,728 1,826 1987 4,519 3,514 1964 2,718 1,785 1988 4,622 3,450 1965 2,550 1,806 1989 4,617 3,467 1966 2,657 1,818 1990 4,657 3,306 1967 3,069 2,265 1991 4,065 3,021 1968 3,288 2,315 1992 3,726 2,814 1969 3,525 2,573 1993 3,669 2,824 1970 3,511 2,490 1994 3,606 2,627 1971 2,965 2,058 1995 3,336 2,468 1972 3,098 2,410 1996 3,291 2,376 1973 3,324 2,704 1997 2,732 2,305 1974 3,564 2,656 1998 2,576 2,202 Total 55,987 40,881
Figure 1 and Table 4: Number of Foreign Students in Taiwan, 1994-2004 83 84 85 86 87 88 89 90 91 92 93 合計 5,596 5,197 5,431 5,210 5,109 6,616 7,524 6,380 7,331 7,844 9,616 修學位 673 767 718 699 772 892 945 1,117 1,283 1,568 1,969 學語文 4,923 4,430 4,713 4,511 4,337 5,724 6,579 5,263 6,048 6,276 7,647 修學位 614 690 600 587 670 763 799 922 1,023 1,209 1,373 學語文 2,845 2,850 3,112 2,906 2,863 4,137 4,821 3,568 4,093 4,219 4,986 修學位 34 45 45 49 56 74 86 132 171 234 379 學語文 1,296 951 915 881 773 887 942 1,008 1,071 1,115 1,512 修學位 22 27 23 32 36 40 41 40 61 70 95 學語文 583 464 526 564 569 551 614 506 664 680 845 修學位 2 3 47 30 4 7 12 16 19 41 89 學語文 83 71 72 65 51 48 63 63 85 108 138 修學位 1 2 3 1 6 8 7 7 9 14 33 學語文 116 94 88 95 81 101 139 118 135 154 166 非洲 大洋洲 學年度 亞洲 美洲 歐洲 0 2,000 4,000 6,000 8,000 10,000 12,000 人 Source: 教育部統計處網頁,「教育統計之國際比較」, (http://www.edu.tw/EDU_WEB/EDU_MGT/STATISTICS/EDU7220001/overview/brief/index.htm?FI LEID=126373&open
Table 5: Foreign Studentsin Taiwan’sHigherEducation,by University, 2005 外籍生人數 單位:人 公私立別 學校名稱 大學部 碩士班 博士班 總計 公立 政治大學 85 181 24 290 公立 清華大學 9 58 57 124 公立 台灣大學 159 139 51 349 公立 台灣師範大學 38 72 24 134 公立 成功大學 25 63 10 98 公立 中興大學 15 16 31 62 公立 交通大學 32 50 18 100 公立 中央大學 12 14 14 40 公立 中山大學 5 18 17 40 公立 台灣海洋大學 1 12 6 19 公立 中正大學 4 0 5 9 公立 高雄師範大學 0 4 0 4 公立 彰化師範大學 2 1 0 3 公立 陽明大學 5 11 5 21 公立 台北大學 16 1 0 17 公立 嘉義大學 2 3 1 6 公立 高雄大學 4 0 0 4 公立 東華大學 0 2 0 2 公立 暨南國際大學 0 3 1 4 公立 台灣科技大學 18 44 15 77 公立 雲林科技大學 52 4 1 57 公立 屏東科技大學 39 30 11 80 公立 台北科技大學 39 8 0 47
公立 高雄第一科技大學 9 12 1 22 公立 高雄應用科技大學 13 20 0 33 公立 台北藝術大學 1 2 0 3 公立 台灣藝術大學 16 4 0 20 公立 台東大學 2 0 0 2 公立 虎尾科技大學 2 1 0 3 公立 高雄海洋科技大學 2 0 0 2 公立 台南藝術大學 0 6 0 6 公立 屏東教育大學 0 3 1 4 公立 國立體育學院 3 0 1 4 公立 高雄餐旅學院 5 1 0 6 公立 台灣戲曲專科學校 (二專)1 0 0 1 私立 東海大學 10 10 3 23 私立 輔仁大學 73 15 6 94 私立 東吳大學 21 14 13 38 私立 中原大學 3 0 2 5 私立 淡江大學 57 40 8 105 私立 文化大學 33 11 7 51 私立 逢甲大學 55 10 3 68 私立 靜宜大學 28 3 0 31 私立 長庚大學 0 1 0 1 私立 元智大學 12 5 0 17 私立 中華大學 12 0 1 13 私立 大葉大學 4 15 1 20 私立 華梵大學 0 4 1 5 私立 義守大學 2 0 0 2
私立 世新大學 40 2 0 42 私立 銘傳大學 221 27 1 249 私立 實踐大學 21 1 0 22 私立 朝陽科技大學 21 0 0 21 私立 高雄醫學大學 32 0 0 32 私立 南華大學 34 15 0 49 私立 真理大學 2 1 0 3 私立 大同大學 2 0 0 2 私立 南台科大 6 39 0 45 私立 崑山科技大學 1 8 0 9 私立 嘉南藥理科技大學 2 0 0 2 私立 樹德科技大學 3 14 0 17 私立 慈濟大學 5 0 0 5 私立 台北醫學大學 13 0 0 13 私立 中山醫學大學 5 0 0 5 私立 龍華科技大學 2 0 0 2 私立 長榮大學 0 1 0 1 私立 中國醫藥學院 1 2 0 3 私立 清雲科技大學 1 1 0 2 私立 正修科技大學 0 2 0 2 私立 玄奘大學 8 4 0 12 私立 建國科技大學 1 0 0 1 私立 明志科技大學 1 0 0 1 私立 大仁科技大學 10 0 0 10 私立 中國科技大學 1 0 0 1 私立 亞洲大學 0 19 0 19
私立 開南管理學院 23 0 0 23 私立 立德管理學院 4 0 0 4 私立 興國管理學院 1 0 0 1 私立 景文管理學院 12 0 0 12 私立 中華技術學院 0 2 0 2 私立 (五專)11 私立 文藻外語學院 (大學)3 0 0 14 私立 永達技術學院 4 0 0 4 私立 中華醫事學院 (五專)1 0 0 1 私立 育達商業技術學院 5 0 0 5 私立 致理技術學院 1 0 0 1 私立 醒吾技術學院 1 0 0 1 私立 亞東技術學院 1 0 0 1 私立 環球技術學院 11 0 0 11 私立 美和技術學院 0 7 0 7 私立 修平技術學院 10 0 0 10 私立 佛光人文社會學院 2 2 0 4 私立 南開技術學院 1 0 0 1 私立 長庚技術學院 (五專)2 0 0 2 私立 親民技術學院 1 0 0 1 私立 高鳳技術學院 1 0 0 1 私立 馬偕醫護管理專科學校 (二專)2 0 0 2 私立 耕莘護理專科學校 (二專)1 0 0 1 私立 新生醫護管理專科學校 (二專)1 0 0 1 總計人數 1436 1058 340 2846 Source: 教育部統計處資料庫資料,2005 年 12 月 Note: 此表資料為教育部統計處之資料庫產出,非出版品之節錄。
Table 6: Time Frame for Research Project Activities
Time Frame: September, 2005 –December, 2008 Research Project Period: August, 2006 –July, 2008
Note: In order to accommodate the difference in grant period among participating researchers, the time lag among research projects carried in different countries may be up to 6 months.
Time Activity Objectives
September, 2005 (Paris, September 27-30) 1st Business Meeting (with international collaborators) 1. To agree on a set of common data collection objectives;
2. To agree on a set of data collection methods;
3. To specify the criteria for selection of respondents; 4. To decide on the time frame for research project and meetings;
August, 2006 –January, 2007
Literature review (Part I)
Fieldwork:
-- Case study (Qualitative Study)
-- Collect data on policies at the university and national levels on student migration
1. To conduct literature review;
2. To decide field sites and contact informants for in-depth interviews; 3. To collect 50 in-depth interviews of foreign students; 4. To transcribe these 50 interviews;
5. To collect information on policies at the university and national levels for (a)
attracting foreign students and (b) local students studying abroad;
February, 2007 –May, 2007 Data analysis
Report writing
1. To analyze interview data; 2. To analyze data policies related to student migration, with a focus on policy changes and the development of
student migration; June, 2007
(TBA)
2ndBusiness Meeting (with
international collaborators)
1. To present key findings from the case study;
2. To present an analytical overview of policies related to student-migration;
3. To develop a draft for the survey questionnaire;
June, 2007 –July, 2007 Survey pre-test
Finalize survey questionnaire
1. To conduct survey pre-test; 2. To finalize the content of the survey questionnaire; August, 2007 –November,
2007
Survey
Literature review (Part II)
1. To contact two universities for survey preparation;
2. To conduct survey with 500 respondents; 3. To conduct literature review; December, 2007 –June, 2008 Data Analysis Preliminary survey report writing Policy-related
secondary data up-date
1. To do data analysis for survey data;
2. To prepare a preliminary survey report presenting major findings;
3. To prepare final paper with literature review;
July, 2008 (TBA)
3rdBusiness Meeting (with
international collaborators)
1. To present survey report; 2. To present update of government policies; August, 2008 –December,
2008
Paper writing 1. Prepare final research paper
(based on research findings from the two-year project); December, 2008
(TBA)
Final Workshop with 1-2 experts as discussants
1. Present final paper; 2. Discuss publication of papers in journal special issue (with present composition of researchers) or book form (will need a minimum of 10 essays).
Table 7: List of Researchers Collaborated in the Project on Student Migration
Name of Participated Researchers
Affiliated Institution Department/Division Country Main Participated Research Field
Ma, Ai-hsuan Sandra (馬藹萱)
National Chengchi University (國立政 治大學)
Dept. of Sociology Taiwan Taiwan
Chen, Xin (陳昕)
CASS(中國社科院) Institute of Sociology China China
Li, Jing (李敬)
CASS(中國社科院) Dept. of Youth and Social Studies
China China
Ho, Kong Chong (何光中)
National University of Singapore(國立新 加坡大學)
Dept. of Sociology Singapore Singapore
Lagrée, Jean Charles*
CNRS(法國國家科 學院)
Printemps ULISS France China
Sabouret, Jean Francois CNRS(法國國家科 學院) University of Paris, V Director de Recherche au CNRS France Japan
Kobayashi, Sumiko University of Paris, V Japan Japan
Appendix 1: The Drafted Outline of Interview Questions for Field Study
Note: Researchers involved in the international research team on student migration will employ the same framework of interview questions, with some minor variations in detailed questions.
I. Personal Details:
A. Demographic background B. Educational background C. Language competence D. Family background
E. Previous history of mobility
II. Accounts for moving (to Taiwan) and the experience of migration: A. Factors involved in the migration decision-making process B. Context of migration decision making
C. Agents participating in the migration decision-making process and their respective roles
III. Migration experience
A. Channel(s) of migration and settlement B. The condition of living and learning in Taiwan C. The experiences of adjustment and maladjustment D. Modes and sources of support
1. financial 2. emotional 3. social 4. other
E. The thoughts and feelings of being a foreign student in Taiwan 1. The view of self
2. The view of the higher education in Taiwan 3. other
IV. Future plans
A. Study plan in the new future and the reasoning for having (or not having) a plan as such. B. Post-graduation plan and the reasoning for having (or not having) a plan as such.
References: 【中文】 方慧,1996,台北地區大學僑生生活調適之研究。中國文化大學碩士論文。 行政院文建會,2005。「族群與文化發展會議」會議手冊,93 年 10 月 16 日-10 月 18 日。 李明儀,1991,僑生回國就學政策之研究。國立中山大學碩士論文。 教育部統計處。1999。回國升學僑生人數統計。中華民國教育部。 教育部教育計畫小組及僑民教育委員會。1982。僑生教育之發展及其實施成效之研究報 告。中華民國教育部。 教育部網頁。2005。http://www.edu.tw/EDU_WEB/EDU_MGT/STATISTICS/EDU7220001/overview/brief 陳月萍,2003。美援僑生教育與反共鬥爭(1950-1965)。國立暨南大學碩士論文。 張希哲,1991. 中華民國的僑生教育。台北:中正。 黃璉華,1996。外籍生適應問題及其相關因素之探討。國科會補助專題研究報告 (NSC84-2412-H002-008) 楊國煌,2003。網際網路與跨地域認同—僑生網路社群之研究。 【英文】
Altbach, P. G., D. Kelly, Y. G. M. Lulat. 1985. Research on Foreign Students and International Study: An Overview and Bibliography. New York: Praeger.
Altbach, P. G., and J. Wang. 1989. Foreign Students and International Study: Bibliography and Analysis, 1984-1989. Washington D.C.: University Press of America.
Arango, Joaquín, 2000. “Explaining migration: A critical view.”International Social Science
Journal, 52(165): 283-296.
Barber, E. G., Altbach, P. G., and R. G. Myers, eds. 1984. Bridges to Knowledge: Foreign Students in Comparative Perspective. Chicago: University of Chicago Press.
Princeton, New Jersey: Princeton University Press.
Boyd, T. F., and C. Lee. 1995. “Educational Need and Economic Advancement: The Role of
Vocational Education in the Republic of China.”In East Asian Higher Education: Traditions and Transformations, edited by A. H. Yee, Pp. 193-210. Oxford: Pergamon.
Castle, Stephen. 2000. “International migration at the beginning of the twenty-first century:
Global trends and issues.”International Social Science Journal, 165(52): 269-281.
Chang, S. L. “Causes of brain drain and solutions: The Taiwan experience.” Studies in Comparative International Development, 27(1): 27-43.
Cohen, R., and P. Kennedy. 2000. Global Sociology. New York: New York University Press. Coppel, J., J. Dumont, and I. Visco. 2001. “Trends in Immigration and Economic
Consequences.” Economics Department Working Paper, No. 284. Paris: OECD.
(http://www.oecd.org/eco/eco/).
Demont,J.,and G.Lemaitre.2005.“Counting immigrantsand expatriatesin OECD countries: A new perspective.”DirectorateforEmploymentLabor and Social Affairs, DELSA. Paris: OECD. (http://www.oecd.org/dataoecd/27/5/33868740.pdf)
Executive Yuan, 1992. Statistical Yearbook of the Republic of China.
Goedegebuure, L., F. Kaiser, P. Maassen, L. Meek, F. van Vught, and E. de Weert. 1993. Higher Education Policy: An International Comparative Perspective. Oxford: Pergamon Press.
Harvey, D. 1989. The Condition of Postmodernity. Oxford : Blackwell.
Held, D., A. McGrew, D. Goldblatt, and J. Perraton, eds. 1999. Global Transformation : Politics, Economics and Culture. Cambridge : Polity.
Johnson, J. M., and M. C. Regets. 1998. International Mobility of Scientists and Engineers to the United States –Brain Drain or Brain Circulation? Issue Brief, NSF-98-316. Arlington, VA: National Science Foundation.
Kastoryano,R.2000.“Globaltrendsand issues:Settlement,transnationalcommunitiesand citizenship.”International Social Science Journal, 165(52): 307-312.
Knight, J. 2002. “Trade in higher education services: The implications of GATS.”A report
from The Observatory on Borderless Higher Education. Paris: OECD.
Kritz, M, M. 1987. “InternationalMigration Policies:ConceptualProblems.”International Migration Review, 21(4): 947-64.
Kritz, M. M., L. L. Lim, and H. Zlotnik, eds. 1992. International Migration Systems: A Global Approach. New York: Oxford University Press
Ma, Ai-hsuan S. 1999. Contextualizing Migration Decisions : The Migration Decision Making of Chinese and Taiwanese Scientists in the U.S. Ph.D. Dissertation, University of Michigan.
_______. 2000. “Rethinking Migration Decision Making in Contemporary Migration
Theories.” 國立政治大學社會學報第三十期,Pp. 145-188.
Martin, P., and J. Widgren. 2002.“Internationalmigration:Facing thechallenge.”Population Bulletin, 57(1): 3-40.
Massey, D. S., and K. E. Espinosa. 1997. “What’s Driving Mexico-U.S. Migration? A Theoretical,Empirical,and Policy Analysis.”American Journal of Sociology, 102(4): 939-99.
Mazzarol, T., and G. N. Soutar. 2001. The Global Market for Higher Education : Sustainable Competitive Strategies for the New Millennium. Cheltenham, UK : Edward Elgar.
Meissner, D. M., et al. 1993. “International migration challenges in a new era: Policy
perspectives and priorities for Europe, Japan, North America, and the international Community.”The Triangle Papers : 44 (a report to the Trilateral Commission). New York: The Trilateral Commission.
Ministry of Education, National Commission of Science, National Youth Commission. eds. 1996. Background Information for the Seminar on the Return of Overseas High-Level Manpower at the 1996 North Chinese American Conference. Republic of China (Taiwan), June, 1996.
National Science Foundation, 1998b. Statistical Profiles of Foreign Doctoral Recipients in Science and Engineering: Plans to Stay in the United States, NSF-99-304, by Jean M. Johnson (Arlington, VA, Nov. 1998).
North, D. S. 1995. Soothing the Establishment: The Impact of Foreign Born Scientists and Engineers on America. Lnaham, Maryland: University Press of America.