HEALTH
PERSPECTIVES
HEALTH
PERSPECTIVES
National Institutes of Health
U.S. Department of Health and Human Services
Air Pollution and Stillbirth: A Population-Based
Case-Control Study in Taiwan
Bing-Fang Hwang, Yungling Leo Lee, Jouni J.K. Jaakkola
doi: 10.1289/ehp.1003056 (available at http://dx.doi.org/)
Online 29 March 2011
ehponline.org
Air Pollution and Stillbirth: A Population-Based Case-Control Study in Taiwan.
Bing-Fang Hwang 1, Yungling Leo Lee 2, Jouni J.K. Jaakkola 3-4
1.
Department of Occupational Safety and Health, College of Public Health, China Medical University, Taichung, Taiwan
2.Institute of Preventive Medicine and Research Center for Genes, Environment and Human
Health, College of Public Health, National Taiwan University, Taipei, Taiwan
3.
Center for Environmental and Respiratory Health Research, Institute of Health Sciences, University of Oulu, Oulu, Finland
4.
Institute of Occupational and Environmental Medicine, The University of Birmingham, Birmingham, United Kingdom
Correspondence with Dr. Bing-Fang Hwang, Department of Occupational Safety and Health College of Public Health
China Medical University
No 91 Hsueh-Shih Rd, Taichung, Taiwan, 40402 R.O.C. E-mail: [email protected]
Telephone: +886-4-22053366 ext 6208 Telefax: +886-4-22071861
ACKNOWLEDGEMENTS
This study was supported by grant #CMU96-128 from China Medical University, China Medical University Hospital (1MS1), National Science Council (NSC 98-2815-C-039-033-B) and Health Effects Institute through a research agreement (#4790-RFA09-2/10-1). We have no competing financial interests. We thank the Taiwan Environmental Protection Agency (EPA) for providing air pollutant monitoring data and the Bureau of Health Promotion, Department of Health for access to the birth registration data. Professor Jouni J.K. Jaakkola was supported by grant # 1129419 from the Academy of Finland.
Running Head: Air Pollution and Stillbirth
Keywords: air pollution; particle; stillbirth; sulfur dioxide
ABBREVIATIONS CI = confidence interval CO = carbon monoxide NO2 = nitrogen dioxides O3 = ozone OR = odds ratio
PM10 = particles with an aerodynamic diameter of 10 µm or less
ppb= part per billion SO2= sulfur dioxide
ABSTRACT
Background: There is limited evidence suggesting that prenatal exposure to ambient air
pollutants may increase the risk of stillbirth, but previous epidemiological studies have not elaborated the most susceptible gestational period for the effects of air pollution exposure on stillbirth.
Objectives: To estimate associations between exposure to ambient air pollutants and stillbirth
with a special reference to the assessment of gestational periods when the fetus is most susceptible.
Methods: We conducted a population-based case-control study in Taiwan. The case group
consisted of 9,325 stillbirths and the control group included 93,250 births randomly selected from 1,510,064 Taiwanese singleton newborns in 2001-2007. Adjusted logistic regression models were used to estimate odds ratios per 10 ppb change for O3, NO2, 1 ppb change for SO2,
10 µg/m3 change for PM10, and 100 ppb change for CO during different gestational periods and
according to term or preterm (<37 weeks) birth status.
Results: Stillbirth was increased in association with a 1 ppb increase in first trimester SO2
(adjusted OR=1.02, 95% CI: 1.00, 1.04), particularly among preterm births (adjusted OR=1.04, 95% CI: 1.01, 1.07). Stillbirth was also associated with a 10 µg/m3 increase in PM10 during the
first (adjusted OR=1.02, 95% CI: 1.00, 1.05) and second (adjusted OR=1.02, 95% CI: 1.00, 1.04) month of gestation, and as for SO2, associations appeared to be restricted to preterm births (first
trimester adjusted OR=1.03, 95% CI: 1.00-1.07).
Conclusion: The study provides evidence that exposure to outdoor air SO2 and PM10 may
increase the risk of stillbirth, especially among preterm births, and that the most susceptible time periods for exposure are during the first trimester of gestation.
Introduction
Epidemiologic studies have since 1990’s provided evidence that prenatal exposure to ambient air pollution may increase the risk of low birth weight, small gestational age, and preterm birth (Lacasana et al. 2005; Glinianaia et al. 2004; Maisonet et al. 2004; Ritz and Yu 1999; Ritz et al. 2007). There is limited evidence suggesting that prenatal exposure to ambient air pollutants may increase the risk of stillbirth and previous studies have not identified which gestational periods are the most susceptible for the effects of air pollution on stillbirth (Bobak and Leon 1999; Pearce et al. 2010; Pereira et al. 1998; Sakai 1984). In a Japanese ecological study the risk for stillbirth was related to regional levels of NO2 and SO2 (Sakai 1984). Another ecological study
conducted in the Czech Republic reported an elevated, significant effect estimate of stillbirth for NOx, but no association between SO2 and suspended particulates (Bobak and Leon 1999). A
time-series study in Brazil reported a statistically significant association between daily exposure to NOx, SO2 and CO and the risk of stillbirth (Pereira et al. 1998). A recentstudy conducted in
northern England found no association between black smoke air pollution during pregnancy and the risk of stillbirth (Pearce et al. 2010).
We conducted a nationwide population-based case-control study in Taiwan to assess the effects of ambient air pollution exposure during pregnancy on the risk of stillbirth with a special reference to the assessment gestational periods when the fetus is most susceptible. These susceptible time windows of exposure could elucidate possible mechanisms underlying the effects of ambient air pollution on the risk of stillbirth. We focussed on predominantly traffic-related pollutants, such as nitrogen dioxides (NO2), carbon monoxide (CO), and ozone (O3), and
air pollutants mainly from other fossil fuel combustion sources, such as sulfur dioxide (SO2), and
Methods
Study design. We conducted a population-based case-control study based on a source population
comprising of 1,510,064 singleton births registered by the Taiwanese Birth Registry from January 1, 2001 to December 31, 2007.
All births are compulsorily reported to the Taiwan Birth Registration within 15 days of delivery. Taiwanese pregnant women are 99% covered by national health insurance, access to prenatal care is free of charge, and there are at least 10 prenatal care visits during pregnancy. A validation study of the Taiwanese birth registration data reported a low percentage of missing information (1.6%) and good validity (sensitivity and specificity was 92.8%, and 99.6% respectively) and reliability (Cohen’s k statistics was 0.92) for preterm birth (<37 weeks of gestational age) (Lin et al. 2004).
We identified all singleton stillbirths without any birth defects (ICD-9-CM: 740-758) from the Taiwanese Birth Registry from 2001 to 2007. Birth defects and other health conditions are mostly diagnosed by pediatricians, and follow-up continues through 7 days after birth. The gestational age was based on ultrasound examination. We included stillbirths after 20 weeks of gestational age and excluded 30 stillbirths due to maternal smoking and 21 stillbirths from townships without air pollution monitoring data, leaving a total of 9,325 stillbirths.The controls were 93,250 births randomly selected (one to ten) from the source population of singleton births without birth defects or maternal smoking during pregnancy (680 births excluded due to
maternal smoking), excluding births from 25 out of 365 townships located in the mountain area where there are no air monitoring stations.
Exposure assessment. Ambient air monitoring data for sulfur dioxide (SO2), nitrogen
of 10 µm or less (PM10) are available for 72 Environmental Protection Administration (EPA)
monitoring stations on Taiwan's main island since 1994. Concentrations of each pollutant are measured continuously and reported hourly—CO by non-dispersive infrared absorption, NO2 by
chemiluminescence, O3 by ultraviolet absorption, SO2 by ultraviolet fluorescence, and PM10 by
beta-gauge.
We identified the map coordinates of the monitoring stations and air pollution sources. The data were managed by a geographic information system (GIS) (ArcGIS 10). The air pollutant measurements from EPA monitoring stations were integrated into monthly point data and interpolated to pollutant surfaces using inverse distance weighting (IDW) method. The monitoring data were assigned to individual women at zip-code area level. The zip code typically corresponded to one block-face in urban areas but was larger in rural areas with low population density. This method provided high temporal resolution (daily measures for most days) and suitable spatial resolution (100 m) (Stroh et al. 2007). The air pollutant measurements from the 3 closest monitoring stations within 25 km of each residence were integrated the monthly average for each woman during pregnancy. The details of the approach are described elsewhere (Hwang and Jaakkola 2008).We also performed sensitivity analyses focusing on the monitoring station closest to the zip-code area of interest within 1km (nearest method). The air pollution estimates were similar based on the nearest monitor and IDW methods (correlation coefficients >0.87), therefore we report estimates based on IDW methods only.
Exposure parameters were calculated from the monthly 24-hour NO2, CO, SO2, PM10 and
8-hour O3 average concentrations for the duration of pregnancies between 2000 and 2007. Based
corresponding to the first 9 months of gestation. We also estimated average concentration for the entire pregnancy, as well as for each trimester.
Covariates. Maternal age, sex of the infant, and season of conception (spring; summer; fall;
winter) were routinely available from the birth registry. Municipal level data from the Directorate-general of Budget, Account, Statistics, Executive Yuan, were used to determine municipal level socioeconomic status (SES) based on the distribution of annul average incomes of households representing high (>75th percentile), medium (75th to 25th percentile), or low (<25th percentile) SES.
Statistical methods. We explored the relations of interest for each month of pregnancy,
each trimester, and the whole pregnancy to elaborate the relevant gestational period for stillbirth. We first applied logistic regression models including the covariates listed above only to identify covariates associated with stillbirth and with air pollution concentrations, which were subsequently including in models investigating the association between air pollution exposures and stillbirth. Further, we also selected potential confounders for a priori reasons and included them into the final model.
Second, we fitted one-pollutant models, and then considered two-pollutant models by fitting one traffic-related and one stationary fossil fuel combustion-related pollutant. Finally, we fitted two-pollutant models with O3 and another pollutant. The two-pollutant models provide estimates
of the independent effects of CO, NO2, SO2, PM10, and O3 on stillbirth controlling for the second
pollutant in the model. We also considered three-pollutant models with one traffic-related, one stationary fossil fuel combustion-related pollutant and O3. The effect of each pollutant on the
risk of stillbirth was estimated as odds ratios (ORs) per 10 ppb change for NO2, and O3, 1 ppb
confidence intervals (CIs).We further performed sensitivity analyses by comparing the effect estimates among preterm (gestational age <37 weeks) and term births (gestational age >37 weeks). Statistical significance was set at p<0.05 based on a two-side calculation.
Results
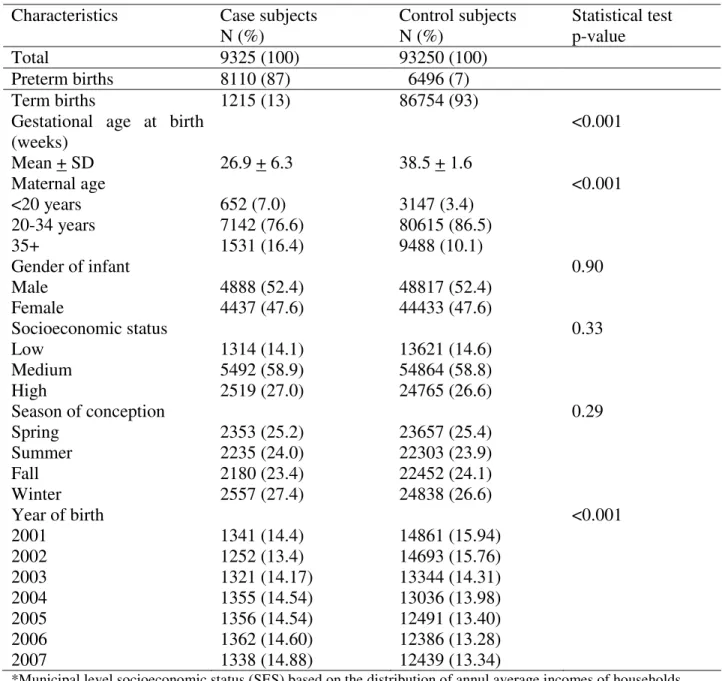
Characteristics of control and case subjects. Table 1 presents the study population. A larger
proportion of cases than controls had younger (maternal age <20 years) and older mothers (> 35 years). The mean of gestational age of cases was significant lower than controls. Only 13% of stillbirths were born ≥37 weeks, while the majority of births during the first trimester were stillborn. The distribution of cases over the birth year was different from the distribution of controls. We adjusted for these factors in the multivariate analysis.
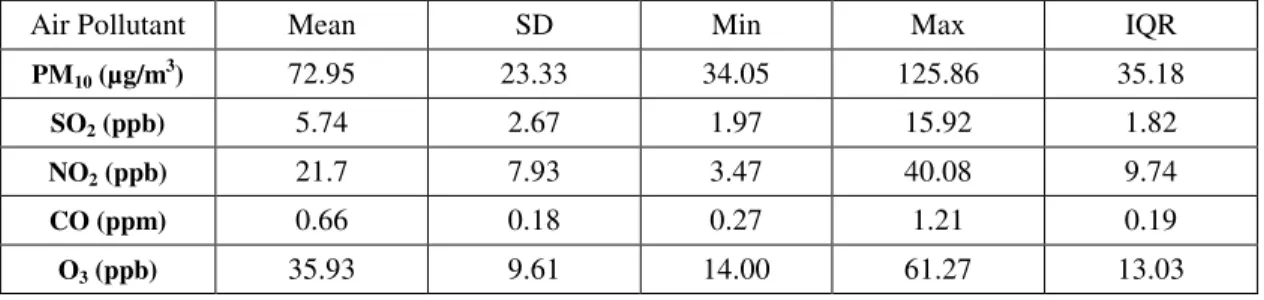
Air pollution. The distributions of the monthly mean air pollutant concentrations during the
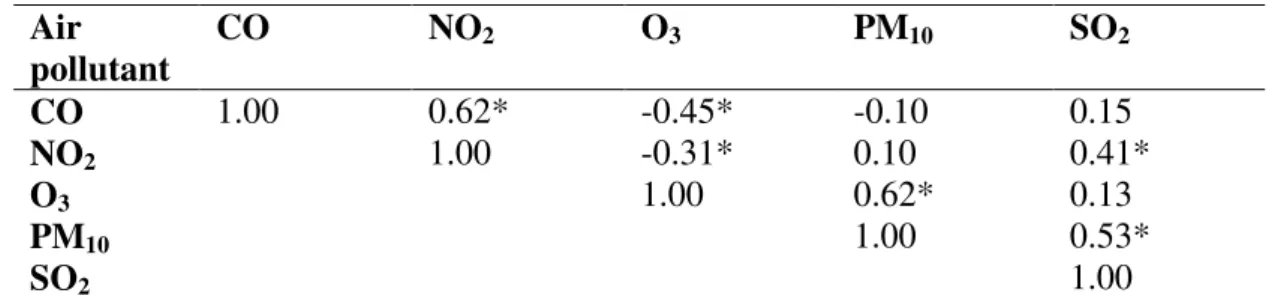
study period are presented in Table 2. The correlation between NO2 and CO average
concentrations during the first 9 months was high (r=0.62), which represent the common source of motor vehicles (Table 3). The concentrations of PM10 and SO2 were also moderately
correlated (r=0.53) indicating a common source of stationary fuel combustion, although SO2
concentrations were also associated with both traffic-related pollutants. The concentration of O3
was negatively associated with the mainly traffic-related pollutants, but positively with PM10 and
SO2, and it was only weakly associated with that of traffic-related and stationary fossil fuel
combustion-related air pollutants (Table 3).
Air pollution and stillbirth.
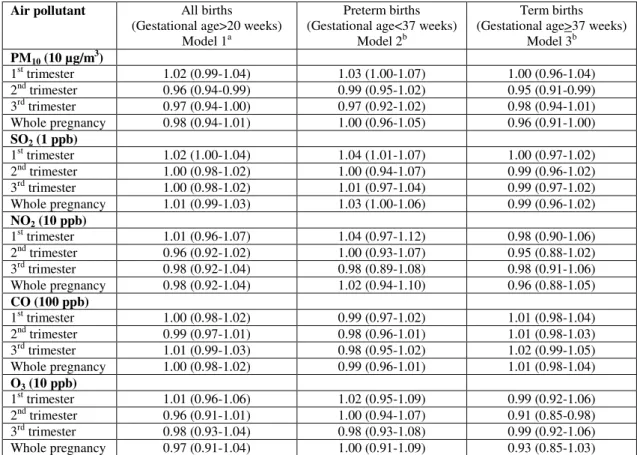
A 10 µg/m3 increase in PM10 during the first trimester was weakly but not significantly
association between first trimester PM10 and stillbirth among preterm births (OR 1.03; 95% CI,
1.00-1.07), but no evidence of an association among term births, or of associations with PM10
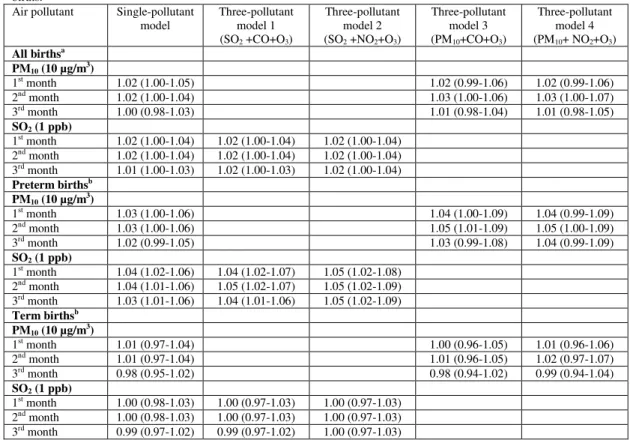
exposures during other time periods (overall or among preterm or term births) (Table 4). Associations with PM10 during the first, second and third months of gestation were similar to
those for the first trimester as a whole, but ORs for the first three months among preterm births were slightly stronger when adjusted for O3 and either CO or NO2 (Table 5)
A 1 ppb increase in SO2 during the first trimester was significantly associated with
stillbirth among all births (adjusted OR 1.02; 95% CI: 1.00-1.04), but stratified estimates indicated that the association was present only among preterm births (adjusted OR 1.04; 95% CI: 1.01-1.07) (Table 4). Associations with SO2 during the first, second and third months of
pregnancy were similar to those for the first trimester, and ORs for the first three months among preterm births were slightly stronger with adjustment for O3 and CO or NO2 (Table 5).
NO2, CO and O3 exposures were not associated with stillbirth in the study cohort
regardless of the timing of exposure or preterm versus term birth status (Table 4) or adjustment for other pollutants (data not shown).
Discussion
In our large population-based case-control study, the risk of stillbirth was increased in association with SO2 and PM10 levels during the first and second months of pregnancy. The
effect estimate indicating an approximately 2% increase in the odds of stillbirth per 1 ppb increase in SO2 level was stable with adjustment for different combinations of air pollutants in
the multi-pollutant models. However, the association with first trimester SO2 appeared to be
limited to preterm births with a 4-5% increase in the odds of stillbirth per 1 ppb increase in SO2.
overall (2-3% increased odds per 10 µg/m3 increase in PM10) and among preterm births
specifically (4-5% increased odds). The results provide evidence that SO2 and PM10 exposure
during early pregnancy may increase the risk of stillbirth.
Validity of results. Our outcome of interest was based on birth registration. Because
there is a possibility that the presence of birth defects may augur other exposure that also may mediate the risk of stillbirth, we excluded all case and control subjects with any birth defect. Potential confounding by gestational age, maternal age, seasonal of conception and social economic status were adjusted in the logistic regressions in all births. Potential confounding or effect modification by maternal smoking was eliminated by focusing on newborns of non-smoking mothers. From another study report (Shih et al. 2007) we know that the prevalence of smoking during pregnancy in Taiwan is much higher (4.0%) than the information in the records (0.3% among cases’ mothers and less than 0.05% among controls). It could reflect underreporting information on the records and therefore the residual confounding would be an issue.
It was not possible to adjust for some potential confounders including nutritional, behavioral, other environmental and occupational factors (Yakoob et al. 2009), because there was no such information available on Taiwanese birth registration. As these factors may vary seasonally and have regional variation, we adjusted for season of conception and a municipal-level measure of SES. However, residual confounding is still possible by unmeasured or poorly characterized factors or by other environmental toxicants.
Any known or unknown factors such as, physical activity, time spent outdoors, occupational status, air exchange, penetration, deposition, as well as emission strengths for indoor pollutants could be responsible for the observed association between personal exposure
and municipal level exposure. A major strength of our population-based case-control study based on Taiwanese birth registration is the large number of births, which reduces uncertainty due to random error that is a concern for smaller studies that collect detailed information on covariates directly from pregnant women (Ritz and Wilhelm 2008).
Our exposure assessment was based on residential zip-code rather than on address during pregnancy, and we used a geographic information system to integrate monthly air pollutant data from 72 EPA monitoring stations which was interpolated to pollutant surfaces using inverse distance weighting method. A previous study reported that using municipal level exposures obtained from air pollution monitoring stations as a proxy for personal exposure results in smaller effect estimates than estimates based on individual-level exposure. (Navidi and Lurmann 1995). A plausible source of information bias is that pregnant women may change residential location, which will lead to exposure misclassification. Based on reports from the United States (13%), Canada (12%) and Australia (19%), a substantial proportion of the population moves during pregnancy (Chen et al. 2010; Fell et al. 2004; Raynes-Greenow et al. 2008), which may decrease the accuracy of exposure assessment and introduce non-differential misclassification that would most likely result in underestimation of air pollution effects.
Although the validity of the Taiwanese register for preterm birth is fairly good (Lin et al. 2004), stillbirths may be undercounted. PM10 was measured using a beta-gauge method that is
sensitive to temperature and relative humidity, but monitoring station measured values were not corrected for these factors. We classified SES at the municipal level, which may not accurately capture individual SES in large cities.
Synthesis with previous knowledge. Three previous studies, conducted in Japan (Sakai
England (Pearce et al. 2010) have investigated associations between exposure to ambient air pollution and stillbirth. The Japanese and Czech studies focusing on effects of annual exposure were semi-ecological, i.e. the exposure assessment was based on regional air pollution levels, and the Brazilian time-series study assessed the effects of daily exposure up to 14 days prior to stillbirth only. The present study estimates associations with exposure in one-month time-windows over the entire pregnancy. We found a 2% increase in the odds of stillbirth per 1 ppb increase in SO2 exposure during the first trimester of gestation. This is consistent with the results
of the Japanese study of 4 districts (Sakai 1984), in which stillbirth was associated with the regional level of SO2, and with a Brazilian study (Pereira et al. 1998) that reported a
non-significant association between SO2 exposure and intrauterine mortality (coefficient = 0.0038 per
µg/m3; p<0.1). The Japanese study estimated associations with average SO2 exposure
concentration during pregnancy, whereas in the Brazilian study the effect estimate was presented for a 5-day moving average exposure. An ecological study of 45 districts in the Czech Republic (Bobak and Leon 1999),the adjusted odds ratio was reduced (OR=0.90, 95% CI=0.70-1.16 per 50 µg/m3), although not statistically significantly. In the present study stillbirth was also associated with a 10 µg/m3 increase in PM10 during the first and second month of gestation,
which is consistent with the Brazilian study (OR=1.01, 95% CI=1.00-1.02 per 10 µg/m3) (Pereira et al. 1998). Further, we found a positive association between PM10 exposure in the first trimester
and stillbirth among preterm births. A retrospective cohort study of 90,537 singleton births over 30 years (1962-1992) in a small city in the UK reported no association between stillbirth and particulate matter exposure (measured as black smoke) during any trimester or the entire pregnancy (OR=1.010, 95% CI=0.991-1.028 per 10 µg/m3) (Pearce et al. 2010). An apparent difference between the UK and our study may be just a result of different scales of measurement
error and bias. We did not observe and association between CO exposure and stillbirth. The Brazilian study (coefficient = 0.0223 per ppm; p<0.1) reported a non-significant association between a 1-ppm increase in short-term CO exposure and the risk of stillbirth. Neither the Japanese nor Czech study investigated associations with CO (Sakai 1984; Bobak and Leon 1999). A non-significant inverse association between stillbirth and a 10 ppb increase in each trimester and the whole pregnancy NO2 was found in the present study. It is possible that some
of our statistically significant findings could reflect chance given the large number of estimates generated. Although our findings suggest that SO2 and PM10 exposures were associated with
stillbirth, and that the most susceptible time window was during the first trimester, we cannot rule out the possibility of chance.
Biological mechanisms. It is not known how exposure to SO2 and PM10 in early fetal
period might contribute to stillbirth. A possible biological mechanism is that atmospheric sulfur oxides may increase methemoglobin levels, which interfere with the oxygen-carrying capacity of hemoglobin in children. Infants are more sensitive to such events because fetal hemoglobin is more likely to be oxidized to methemoglobin (Petr and Schmidt 1966). Maternal exposure to particulate air pollutants during pregnancy can result in increase concentration of DNA adducts or decreased efficiency of the transplacental function with consequent deterioration in fetal growth and development of stillbirth in humans (Zondervan et al. 1987; Perera et al. 1992). It is not clear yet whether toxic components of PM10 or other measured (SO2, CO, NO2 and O3) or
unmeasured compounds associated with PM10 (such as polycyclic aromatic hydrocarbons) might
Conclusions. The present study suggests that exposure to outdoor air SO2, andPM10 during
the first trimester of pregnancy may increase the risk of stillbirth, particularly among preterm births.
References
Bobak M, Leon DA. 1999. Pregnancy outcomes and outdoor air pollution: an ecological study in districts of the Czech Republic 1986-8. Occup Environ Med 56:539:543.
Chen L, Nell EM, Carton AR, Druschel CM, Lin S. 2010. Residential mobility during pregnancy and the potential for ambient air pollution exposure misclassification. Environ Res 110:162-168.
Fell D, Dodds L, King W. 2004. Residential mobility during pregnancy. Paediatr Perinat Epidemiol 18:408-414.
Hwang BF, Jaakkola JJK. 2008. Ozone and the other air pollutants and the risk of oral clefts. Environ Health Perspect 116:1411-1415.
Lacasana M, Esplugues A, Ballester F. 2005. Exposure to ambient air pollution and prenatal and early childhood health effects. Eur J Epidemiol 20:183-199.
Lin CM, Lee PC, Teng SW, et al. 2004. Validation of the Taiwan birth registration using obstetric records. J Formos Med Assoc 103:297-301.
Maisonet M, Correa A, Misra D, Jaakkola JJK. 2004. A review of the literature on the effects of ambient air pollution on fetal growth. Environ Res 95:106-115.
Navidi W, Lurmann F. 1995. Measurement error in air pollution exposure assessment. J Expo Anal Environ Epidemiol 5:111-124.
Pearce MS, Glinianaia SV, Rankin J, Rushton S, Charlton M, Parker L, Pless-Mulloli T. 2010. No association between ambient particulate matter exposure during pregnancy and stillbirth risk in the north of England, 1962-1992. Environ Res 110:118-122.
Pereira LA, Loomis D, Conceicao GM, Braga AL, Arcas RM, Kishi HS, et al. 1998. Association between air pollution and intrauterine mortality in Sao Paulo, Brazil. Environ Health Perspect 106:325-329.
Perera FP, Hemminki K, Gryzbowska E, Motykiewicz G, Michalska J, Santella RM, et al. 1992. Molecular and genetic damage in humans from environmental pollution in Poland. Nature 360:256-258.
Petr B, Schmidt P. 1966. Effect of air polluted with sulfur anhydride and nitrogen oxides on the body. Gig Sanit 31:91-98.
Raynes-Greenow C, Nassar N, Roberts C. 2008. Residential mobility in a cohort of primaparous women during pregnancy and post-partum. Aust N Z J Public Health 32:131-134.
Ritz B, Yu F. 1999. The effect of ambient carbon monoxide on low birth weight among children born in southern California between 1989 and 1993. Environ Health Perspect 107:17-25.
Ritz B, Wilhelm M, Hoggatt KJ, Ghosh JK. 2007. Ambient air pollution and preterm birth in the environment and pregnancy outcomes study at the University of California, Los Angeles. Am J Epidemiol 166:1045-1052.
Ritz B, Wilhelm M. 2008. Ambient air pollution and adverse birth outcomes: methodologic issues in an emerging field. Basic Clin Pharmacol Toxicol 102:182-190.
Sakai R. 1984. Fetal abnormality in a Japanese industrial zone. Int J Environ Stud 23:113-120.
Shil SF, Chen L, Wen CP, Yang WC, Shih YT. 2007. An investigation of the smoking behaviors of parents before during and after the birth of their children in Taiwan. BMC Public Heath 8:67.
Stroh E, Harrie L, Gustafsson S. 2007. A study of spatial resolution in pollution exposure modeling. Int J Health Geographics 6:19.
Yakoob MY, Menezes EV, Soomro T, Hsws RA, Darmstadt GL, Bhutta ZA. 2009. Reducing stillbirths: behavioral and nutritional interventions before and during pregnancy. BMC Pregnancy Childbirth 9 (Suppl 1):S3.
Zondervan HA, Oosting J, Hardeman MR, et al. 1987. The inference of maternal whole blood viscosity on fetal growth. Eur J Obstet Gynecol Reprod Biol 25:187-94.
Table 1. Distribution of characteristics among case and control subjects in a study of air pollution and stillbirth in Taiwan, 2001-2007
Characteristics Case subjects N (%) Control subjects N (%) Statistical test p-value Total 9325 (100) 93250 (100) Preterm births 8110 (87) 6496 (7) Term births 1215 (13) 86754 (93)
Gestational age at birth (weeks) <0.001 Mean + SD 26.9 + 6.3 38.5 + 1.6 Maternal age <0.001 <20 years 652 (7.0) 3147 (3.4) 20-34 years 7142 (76.6) 80615 (86.5) 35+ 1531 (16.4) 9488 (10.1) Gender of infant 0.90 Male 4888 (52.4) 48817 (52.4) Female 4437 (47.6) 44433 (47.6) Socioeconomic status 0.33 Low 1314 (14.1) 13621 (14.6) Medium 5492 (58.9) 54864 (58.8) High 2519 (27.0) 24765 (26.6) Season of conception 0.29 Spring 2353 (25.2) 23657 (25.4) Summer 2235 (24.0) 22303 (23.9) Fall 2180 (23.4) 22452 (24.1) Winter 2557 (27.4) 24838 (26.6) Year of birth <0.001 2001 1341 (14.4) 14861 (15.94) 2002 1252 (13.4) 14693 (15.76) 2003 1321 (14.17) 13344 (14.31) 2004 1355 (14.54) 13036 (13.98) 2005 1356 (14.54) 12491 (13.40) 2006 1362 (14.60) 12386 (13.28) 2007 1338 (14.88) 12439 (13.34)
*Municipal level socioeconomic status (SES) based on the distribution of annul average incomes of households representing high (>75th percentile), medium (75th to 25th percentile), or low (<25th percentile).
Table 2. Distributions of air pollution concentrations estimate by IDW methods during the study period.
Air Pollutant Mean SD Min Max IQR
PM10 (µg/m 3 ) 72.95 23.33 34.05 125.86 35.18 SO2 (ppb) 5.74 2.67 1.97 15.92 1.82 NO2 (ppb) 21.7 7.93 3.47 40.08 9.74 CO (ppm) 0.66 0.18 0.27 1.21 0.19 O3 (ppb) 35.93 9.61 14.00 61.27 13.03
Table 3. Correlations of trimester average concentrations of main air pollutants during pregnancy. Air pollutant CO NO2 O3 PM10 SO2 CO 1.00 0.62* -0.45* -0.10 0.15 NO2 1.00 -0.31* 0.10 0.41* O3 1.00 0.62* 0.13 PM10 1.00 0.53* SO2 1.00
Abbreviations: NO2, nitrogen dioxides; PM10, particles with aerodynamic diameter 10 µm or less;
SO2, sulfur dioxide; O3, ozone; CO, carbon monoxide.
Table 4. Adjusted ORs (95% CIs) for stillbirth by average concentrations of the trimester and whole pregnancy. Effect estimates are from single pollutant models and given for separately for the total study population, preterm, and term births.
Air pollutant All births (Gestational age>20 weeks)
Model 1a
Preterm births (Gestational age<37 weeks)
Model 2b
Term births (Gestational age>37 weeks)
Model 3b PM10 (10 µg/m 3 ) 1st trimester 1.02 (0.99-1.04) 1.03 (1.00-1.07) 1.00 (0.96-1.04) 2nd trimester 0.96 (0.94-0.99) 0.99 (0.95-1.02) 0.95 (0.91-0.99) 3rd trimester 0.97 (0.94-1.00) 0.97 (0.92-1.02) 0.98 (0.94-1.01) Whole pregnancy 0.98 (0.94-1.01) 1.00 (0.96-1.05) 0.96 (0.91-1.00) SO2 (1 ppb) 1st trimester 1.02 (1.00-1.04) 1.04 (1.01-1.07) 1.00 (0.97-1.02) 2nd trimester 1.00 (0.98-1.02) 1.00 (0.94-1.07) 0.99 (0.96-1.02) 3rd trimester 1.00 (0.98-1.02) 1.01 (0.97-1.04) 0.99 (0.97-1.02) Whole pregnancy 1.01 (0.99-1.03) 1.03 (1.00-1.06) 0.99 (0.96-1.02) NO2 (10 ppb) 1st trimester 1.01 (0.96-1.07) 1.04 (0.97-1.12) 0.98 (0.90-1.06) 2nd trimester 0.96 (0.92-1.02) 1.00 (0.93-1.07) 0.95 (0.88-1.02) 3rd trimester 0.98 (0.92-1.04) 0.98 (0.89-1.08) 0.98 (0.91-1.06) Whole pregnancy 0.98 (0.92-1.04) 1.02 (0.94-1.10) 0.96 (0.88-1.05) CO (100 ppb) 1st trimester 1.00 (0.98-1.02) 0.99 (0.97-1.02) 1.01 (0.98-1.04) 2nd trimester 0.99 (0.97-1.01) 0.98 (0.96-1.01) 1.01 (0.98-1.03) 3rd trimester 1.01 (0.99-1.03) 0.98 (0.95-1.02) 1.02 (0.99-1.05) Whole pregnancy 1.00 (0.98-1.02) 0.99 (0.96-1.01) 1.01 (0.98-1.04) O3 (10 ppb) 1st trimester 1.01 (0.96-1.06) 1.02 (0.95-1.09) 0.99 (0.92-1.06) 2nd trimester 0.96 (0.91-1.01) 1.00 (0.94-1.07) 0.91 (0.85-0.98) 3rd trimester 0.98 (0.93-1.04) 0.98 (0.93-1.08) 0.99 (0.92-1.06) Whole pregnancy 0.97 (0.91-1.04) 1.00 (0.91-1.09) 0.93 (0.85-1.03) a
Logistic regression analysis adjusting for sex, maternal age, gestational age, municipal-level SES, season of conception and year of birth in the model 1.
b
Logistic regression analysis adjusting for sex, maternal age, municipal-level SES, season of conception and year of birth in the model 2 and 3.
Table 5. Adjusted ORs (95% CIs) for stillbirth by average concentrations of the first three months of gestation. Effect estimates are from single pollutant models and multi-pollutant models given for separately for the total study population, preterm, and term births.
Air pollutant Single-pollutant model Three-pollutant model 1 (SO2 +CO+O3) Three-pollutant model 2 (SO2 +NO2+O3) Three-pollutant model 3 (PM10+CO+O3) Three-pollutant model 4 (PM10+ NO2+O3) All birthsa PM10 (10 µg/m3) 1st month 1.02 (1.00-1.05) 1.02 (0.99-1.06) 1.02 (0.99-1.06) 2nd month 1.02 (1.00-1.04) 1.03 (1.00-1.06) 1.03 (1.00-1.07) 3rd month 1.00 (0.98-1.03) 1.01 (0.98-1.04) 1.01 (0.98-1.05) SO2 (1 ppb) 1st month 1.02 (1.00-1.04) 1.02 (1.00-1.04) 1.02 (1.00-1.04) 2nd month 1.02 (1.00-1.04) 1.02 (1.00-1.04) 1.02 (1.00-1.04) 3rd month 1.01 (1.00-1.03) 1.02 (1.00-1.03) 1.02 (1.00-1.04) Preterm birthsb PM10 (10 µg/m3) 1st month 1.03 (1.00-1.06) 1.04 (1.00-1.09) 1.04 (0.99-1.09) 2nd month 1.03 (1.00-1.06) 1.05 (1.01-1.09) 1.05 (1.00-1.09) 3rd month 1.02 (0.99-1.05) 1.03 (0.99-1.08) 1.04 (0.99-1.09) SO2 (1 ppb) 1st month 1.04 (1.02-1.06) 1.04 (1.02-1.07) 1.05 (1.02-1.08) 2nd month 1.04 (1.01-1.06) 1.05 (1.02-1.07) 1.05 (1.02-1.09) 3rd month 1.03 (1.01-1.06) 1.04 (1.01-1.06) 1.05 (1.02-1.09) Term birthsb PM10 (10 µg/m3) 1st month 1.01 (0.97-1.04) 1.00 (0.96-1.05) 1.01 (0.96-1.06) 2nd month 1.01 (0.97-1.04) 1.01 (0.96-1.05) 1.02 (0.97-1.07) 3rd month 0.98 (0.95-1.02) 0.98 (0.94-1.02) 0.99 (0.94-1.04) SO2 (1 ppb) 1st month 1.00 (0.98-1.03) 1.00 (0.97-1.03) 1.00 (0.97-1.03) 2nd month 1.00 (0.98-1.03) 1.00 (0.97-1.03) 1.00 (0.97-1.03) 3rd month 0.99 (0.97-1.02) 0.99 (0.97-1.02) 1.00 (0.97-1.03)
aLogistic regression analysis adjusting for sex, maternal age, gestational age, municipal-level SES, season of conception and year
of birth in all births
bLogistic regression analysis adjusting for sex, maternal age, municipal-level SES, season of conception and year of birth in term