Gene Selection with Rough Sets for the Molecular Diagnosing of Tumor Based on Support Vector Machines
6
0
0
全文
(2) classification. of. gene. expression. data. by. utilizing. maps. In recent years, supervised methods such as k-nearest. data: gene _ exp ression = log 2 ( Ratio) , Ratio = Int(Cy5) / Int(Cy3) , where Int (Cy 5) and Int (Cy3) are the intensities of red. neighbor (KNN) and support vector machines (SVM) have. and green colors. Samples are generated under multiple. been broadly applied to gene expression profiles to classify. conditions which may be a time series during a biological. tumor samples [4][5][6][7][8][9]. However, informative gene selection plays a key role in. process or a collection of different tissue samples. Let G = { g1 , L g n } be a set of genes and S = {s1 ,L sm } be a set. the classification problem of gene expression data, so gene. of samples. The corresponding gene expression matrix can. unsupervised methods such as clustering and self-organizing. selection for classification is an important aspect of data mining and a very active research topic. Guyon et al [7]. dye. is. used. as. the. gene. expression. be represented as X = {xi , j | 1 ≤ i ≤ m,1 ≤ j ≤ n} . The matrix X. proposed a gene selection approach utilizing support vector. is composed of m row vectors si ∈ R n ; i = 1,2, L , m , m is. machines based on recursive feature elimination (RFE) by. the number of samples, and n is the number of genes. which the selected genes yield a better classification. measured.. performance and are biologically relevant to tumor. Yuhang. ⎡ x1,1 x1, 2 ⎢x x2 , 2 2 ,1 X =⎢ ⎢M M ⎢ ⎣ xm ,1 xm , 2. et al [12] developed a novel hybrid approach that combines gene ranking and clustering analysis. This approach applied feature filtering algorithms to select a set of top-ranked. L x1,n ⎤ L x2,n ⎥⎥ L M ⎥ ⎥ L x m ,n ⎦. genes and then applied hierarchical clustering on these genes to generate a dendrogram which was used as the basis of. Where xi , j is the expression level value of sample si on. marker gene selection. Rough set theory has been developed quickly in recent. gene g j , and usually n >> m . Each vector si in the gene. years and has been successfully applied to gene expression profiles. Herman Midelfart et al [10] presented a general. expression matrix may be thought of as a point in. rough set approach for the classification of tumor samples.. n-dimensional space. Each of the n columns consists of an. Bulashevska et al [20] applied rough set to extract. m-element expression vector for a single gene.. informative rules. Jianwen Fang et al [19] utilized rough set. Our task is to classify all samples into tumor samples and. approach to predict leukemia and to have found eight. normal samples, which is a binary classification problem. A. tumor-related genes and eight informative rules in the. simple way to build a binary classifier is to construct a. leukemia dataset. Those works show that rough set based learning combined with feature selection may become an. hyper-plane which separates tumor members from normal members in feature space. Suppose ωT and ω N be the two. important tool for microarray analysis.. subsets. of. 3: The Classification Methods. sample set , satisfying S ωT ∩ ω N = φ , ωT ∪ ω N = S , which means that each vector ideally belongs to one and only one class ωT or ω N .. 3.1: Preprocessing of DNA microarray Data. 3.2: The model of classification algorithm. DNA microarrays are composed of thousands of. There are four steps in our classification algorithm that. individual DNA sequences printed in a high density array on a glass microscope slide using a robotic array. The relative. will be introduced below in details. Step 1 For each gene g i in G , we firstly calculate its. abundance of these spotted DNA sequences in two DNA or. score according to the revised feature score criterion. RNA samples may be assessed by monitoring the differential. (RFSC)[14], and then rank the genes according to their. hybridization of the two samples to the sequences on the. scores. On the basis of gene ranking, we simply take the top-ranked genes with the highest F ( g i ) scores as our. array.. For. mRNA samples,. the. two. samples. are. reverse-transcribed into cDNA, labeled using different. selected gene subset Gtop , satisfying | Gtop |<<| G | .. fluorescent dyes mixed (red-fluorescent dye Cy5 and green-fluorescent dye Cy3). After the hybridization of these. Step 2 Applying the attribute reduction of rough set theory. samples with the arrayed DNA probes, the slides are imaged. to the top-ranked gene subset Gtop to further select the gene. using scanner that makes fluorescence measurements for. 1369 - subset Gr consisting of r genes as represents of G . each dye. The log ratio between the two intensities of- each top.
(3) Step 3 Firstly, splitting the dataset into training dataset and. attributes to objects such that f ( xi , a) ∈ Va , for all xi ∈ U. testing dataset, and then applying SVM classifier to classify the training dataset described by the gene subset Gr to. and a ∈ C . In our application, D = {d } is a singleton set,. obtain a classification model. Step 4 Using the model and SVM to predict the testing dataset.. where d denotes the classes of samples. Given a decision system DS =< U , A,V , f > , let B be a subset of A , and let xi and x j be members of U , a relation R(B) , called an indiscernibility relation over B , is. 3.3: Gene selection. defined as follows:. Gene selection and dimensional reduction are necessary. R ( B) = {( xi , x j ) ∈ U 2 | ∀a ∈ B, f ( xi , a) = f ( x j , a )}. (2). for performing the tumor classification with gene expression profiles. In measuring the classification information of genes,. Let C be a set of condition attributes and R(C ) be an. Golub et al [8] proposed a feature score criterion (FSC) as gene selection method. For each gene g i in G , The FSC. indiscernibility. method firstly calculate the mean μ i+ (resp. μ i− ) and standard deviation σ i+ (resp. σ i− ) which correspond to the gene g i of samples labeled +1(-1) , respectively, and then. on C . Let Y ⊆ U be a subset of objects representing a concept, and R * (C ) = { X 1 , X 2 ,L, X n } be the collection of. calculate. equivalence classes induced by the relation R(C ) . The. feature. F ( g i ) = ( μi+ − μi− ) /(σ i+ + σ i− ). score. with. the. formula. for each g i ∈ G , and rank the genes. relation on U , an ordered pair AS =< U , R (C ) > is called an approximation space based. lower approximation of a set Y in the approximation space. AS denoted as LOWR (C ) (Y ) , is defined as the union of. according to their scores. However, when the two expression means of a gene g i in normal tissue and tumor are equal, there is a fault in this formula that this gene g i is removed as noise from informative genes because of F ( g i ) = 0 . Therefore, we apply another revised formula RFSC[14]: F ( gi ) = 0.5 (μi+ − μi− ) /(σ i+ + σ i− ) + 0.5 ln((σ i + σ i ) /(2σ i+σ i− )) +2. −2. which. are. completely. contained. by. the. Y. ,. LOWR (C ) (Y ) = U{ X ∈ R * (C ) : X ⊆ Y }. Let R * ( D) = {Y1 , Y2 ,LYm } be the collection of equivalence. (1). to be used as our gene selection criterion. We simply take the top-ranked genes with the highest F ( g i ) scores as our gene subset Gtop . Suppose GTop = p ,. those equivalence classes in the collection of R * (C ). then we may obtain gene. classes of the relation R(D) . A positive region. POSC ( D) = U i =1,L,m {LOWR (C ) (Yi ) : Yi ∈ R * ( D)} The positive region POSC (D) includes all samples of the equivalence classes of R * (C ) in AS which can be certainly classified into classes of R * ( D) . Attribute reduction techniques can eliminate redundant. expression matrix X m× p .. attributes and create a minimal subset of attributes called. 3.4: Rough Set and Attribute Reduction Method [2]. reduct for a decision system. Such minimal subset of attributes is an essential part of the decision system which. Our learning problem is to predict the class of tumors. We. can discern all samples discernible by the original table and. may formalize this problem as a decision system which is defined as a quadruple: S =< U , A,V , f > , where universe. cannot be reduced any more. Finding reducts is also. U = {x1 , x 2 , L , x n } is a finite set of tumor or microarray. but heuristic search is also very time consuming.. expensive. An exhaustive search is obviously impossible,. samples; The set A is a finite set of attributes; the. Therefore, we use a feature selection approach to select. attributes in A are further classified into two disjoint subsets: condition attributes C for each gene and decision. genes with high discriminatory ability before finding reducts. attributes D , corresponding to a clinical parameter, such. expression values are real-valued, and must be discretized. that A = C ∪ D and C ∩ D = φ ; V = U a∈C Va is a set of. before gene selection [10].. gene expression values for each gene a and Va is the. 3.5: Support Vector Machines. domain of gene a ;. f :U × C → V. using rough set learning algorithm. Moreover, the gene. is an information. function which assigns particular values from domains of - 1370. SVM is a relatively new type of statistic learning theory,.
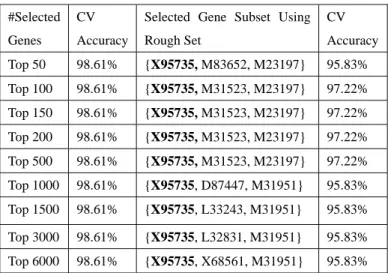
(4) originally introduced by Vapnik and successively extended. LIBSVM [13] to classify the two tumor-related datasets.. by a number of other researchers. SVM builds up a. Training SVM requires specifying the type of kernel and the. hyper-plane as the decision surface in such a way to. regularization parameter C . However, finding the best. maximize the margin of separation between positive and. choices for the kernel and parameters can be challenging. negative examples. Given a labeled set of m training samples S = {( xi , yi ) | ( xi , yi ) ∈ R n × {±1}, i = 1,2,L m} , where xi ∈ R n , yi ∈ {±1} is a label of sample xi , and the. when applied to real datasets. Generally, the recommended. discriminant hyper-plane is defined by: f (x) =. kernel for nonlinear problems is the Gaussian radial basis kernel K ( x, y ) = exp( −σ x − y 2 ) that is also used in our experiments. We adopt the cross-validated (CV) accuracy to. m. ∑α i =1. i. yi K ( xi , x) + b. (3). where K ( xi , x) is a kernel function and the sign of f (x). measure the classification performance of SVM classifier.. 4.3: Results and analysis. determines which class it belongs to. Constructing an optimal hyper-plane is equivalent to finding all the support vectors α i and a bias b .. Firstly, experiments are carried out using RFSC method to roughly select the top-ranked genes as represents of all genes, and then on the basis of the selected genes we employ rough set to find the tumor-related genes to be used as the. 4: Experiments. input of SVM classifier. Table 1 shows the experiment results of two methods for leukemia dataset. The first. 4.1: Sample Datasets. column means the number of the roughly selected genes We experiment with two dataset related to tumor. One is. according to gene ranking; the second column means the CV. leukemia dataset [8]; another is colon cancer dataset [18].. accuracy obtained from SVM using the roughly selected. Leukemia dataset is bone marrow samples that are taken. genes; the third column indicates the selected gene subset,. from 72 patients with either acute myeloid leukemia (AML). using RSES 2.2 software, whose CV accuracy is showed in. or acute lymphoblastic leukemia (ALL). It consists of 47. the forth column.. ALL samples and 25 AML samples. The dataset contains. Table 1. Recognition rate with gene selection methods for. expression levels for 7129 human genes produced by. leukemia dataset. Affymetrix high-density oligonucleotide microarrays. The. #Selected. CV. Selected Gene Subset Using. CV. scores in the dataset represent the intensity of gene. Genes. Accuracy. Rough Set. Accuracy. expression after being re-scaled to make overall intensities. Top 50. 98.61%. {X95735, M83652, M23197}. 95.83%. for each chip equivalent. The dataset is available at web site. Top 100. 98.61%. {X95735, M31523, M23197}. 97.22%. http://www.broad.mit.edu/cgi-bin/cancer/datasets.cgi.. Top 150. 98.61%. {X95735, M31523, M23197}. 97.22%. Colon cancer dataset involves comparing tumor and. Top 200. 98.61%. {X95735, M31523, M23197}. 97.22%. normal samples of the same tissue. The dataset consists of. Top 500. 98.61%. {X95735, M31523, M23197}. 97.22%. 62 samples of colon epithelial cells including 40 colon. Top 1000. 98.61%. {X95735, D87447, M31951}. 95.83%. cancer samples and 22 normal samples. Gene expression. Top 1500. 98.61%. {X95735, L33243, M31951}. 95.83%. Top 3000. 98.61%. {X95735, L32831, M31951}. 95.83%. Top 6000. 98.61%. {X95735, X68561, M31951}. 95.83%. level in these 62 samples was measured using high density oligonucleotide microarray. Among the 6000 genes detected in these microarrays, 2000 genes were selected based on the confidence in the measured expression level. The dataset is available. at. web. site. http://www.molbio.princeton.edu/colondata.. (Downloaded. {X95735, M23197, M31523} which achieves 97.22% CV relevant to leukemia. X95735 possesses LIM domain which is known to interact with leukemogenic bHLH proteins. In our experiments, we firstly apply the rough set software 2.2. M23197} has the same classification performance as the set accuracy. In fact, the genes X95735 and M23197 are. 4.2: Experiment Methods. RSES. Further experiments show that the subset {X95735,. from. the. web. site. http://logic.mimuw.edu.pl/~rses) to select genes that have a. - 1371 better discriminative ability. Then we use the SVM software. (TAL1, TAL2 and LYL1) [21]. M23197 has previously been identified as gene associated with myeloid leukemia and as “Coding for CD33, a differentiation antigen of myeloid progenitor cells” [22]. Fig.1 shows the scatter plot of the two genes. Along the ordinate axis are the expressional values of.
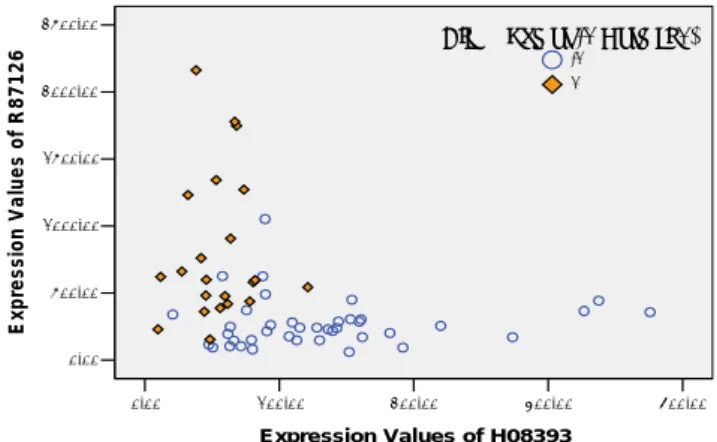
(5) gene M31523, and along the abscissa axis are the expression. R87126} can achieve the 88.71% CV accuracy that is higher. values of X95735. From this figure, we can see that the. than the gene subset {R36977, H08393, R87126, T62947}.. boundary between ALL and AML is very clear relatively.. H08393 and T62947 are two genes of colon cancer. Yuhang et al [12] utilize HykGene approach to obtain a. biomarkers that had been applied for United States patent. M31523,. whose number is 20050165556 in 2005. R36977 is not. HG2562-HT2658, J05243, M17886, U43885, J02982,. associated with colon cancer in previous literature, but is. M10612, M17733, X99728} which can achieve the 100%. linked to either some forms of neoplasia or to the regulation. CV accuracy using SVM classifier, but not all genes in this. of the cell cycle [24]. Fig.2 shows the scatter plot of the two. set are relevant to tumor. Another different gene candidate. genes. Along the ordinate axis are the expressional values of. subset {M23197, X95735, M31523, U46499, M27891,. gene R87126, and along the abscissa axis are the expression. L09209, M63138, HG1612-HT1612, M92287, M11722}. values of gene H08393. The boundary between colon tumor. can also achieve the 100% CV accuracy using the same. and normal tissues is fuzzy relatively.. gene. subset. {X95735,. M27783,. U41813,. classifier. This phenomena indicates that the gene subset that Therefore, although the CV accuracy is the better way to indicate the performance, to some extent it is hard to evaluate the different gene selection methods which achieve the same CV accuracy, so evaluating experiment results should concern much medical knowledge. Compared with our results, {X95735, M31523} is the intersection of these selected gene subsets.. Expression Values of R87126. can achieve the highest CV accuracy is not solitary.. 2500.00. C lass (T um or -1 N orm al1) -1 1. 2000.00. 1500.00. 1000.00. 500.00. 0.00 0.00. 100.00. 200.00. 300.00. 400.00. E xpression Values of H08393. Expression Values of M31523. 5000.00. C lass (A LL 1 A M L -1) -1 1. 4000.00. Fig.2 Scatter plot of two genes {H08393, R87126} in colon cancer dataset.. 3000.00. 5: Conclusion and future work 2000.00. Due to the gene redundancy in gene expression profiles,. 1000.00. eliminating a large quantity of redundant genes from 0.00. thousands of genes is a difficulty and important task for the 0.00. 2000.00. 4000.00. 6000.00. 8000.00. E xpression Values of X95735. tumor-related gene selection and tumor classification. In this paper, our main contribution is to introduce a novel hybrid. Fig.1 Scatter plot of two genes {X95735, M31523} in. approach which combines gene ranking based on RFSC and. leukemia dataset.. rough set attribute reduction to select biomarker genes for. Table 2. Gene selection for colon dataset and its CV. classification using SVM classifier. Experiments show that. accuracy of classification. our hybrid method performs well in selecting biomarker. #Selected. CV. Selected Gene Subset Using. CV. genes related to tumor and in improving the performance of. Genes. Accuracy. Rough Set. Accuracy. SVM classifier. The selected biomarkers are potential drug. Top 50. 88.71%. {M76378, U21090, H08393,. 87.1%. targets since they are relevant to the disease under study. We. R87126, R64115}. will further focus on developing the classification tool which. Top 100. 90.32%. {R36977, H08393, R87126, T62947}. 87.1%. Top 150. 90.32%. {R36977, H08393, R87126, T62947}. 87.1%. Top 200. 90.32%. {R36977, H08393, R87126, T62947}. 87.1%. Top 500. 90.32%. {R36977, H08393, R87126, T62947}. 87.1%. Top 1000. 90.32%. {R36977, H08393, R87126, T62947}. 87.1%. This research was funded by the National Natural Science. Top 1500. 90.32%. {R36977, H08393, R87126, T62947}. 87.1%. Foundation of China under the grant No. 60233020 and. Table 2 shows the experiment results of two methods for colon dataset. The meanings of columns are similar to table. - 1372 1. Further experiments show that the subset {H08393,. will integrate various feature selection methods to help doctor to diagnose and predict cancer.. Acknowledgement. Hunan Provincial Natural Science Foundation of China under the grant No. 04JJ6032..
(6) References. http://www.csie.ntu.edu.tw/~cjlin/libsvm. 14. Li Yingxin and Ruan Xiaogang. Feature selection for cancer classification based on Support Vector Machine. Journal of. 1. Vapnik V. N.. Statistical learning theory. Springer, New York,. Computer Research and Development, 2005, 42(10):1796~1801.. 1998.. 15. Topon Kumar Paul and Hitoshi Iba. Extraction of informative. 2. Pawlak Z.. Rough Sets: Theoretical Aspects of Reasoning about. genes from microarray data. Proceedings of the 2005 Conference. Data—Dordrecht, Kluwer Academic Publishers, 1991.. on Genetic and Evolution Computation. Washington DC, USA,. 3. Guyon I. and Elisseeff A.. An introduction to variable and. 2005, 453-406.. feature selection. Journal of Machine Learning Research, 2003,. 16. Daisuke Komura, Hiroshi Nakamura, and Shuichi Tsutsumi.. 3:1157-1182.. Multidimensional support vector machines for visualization of. 4. Edmundo Bonilla Huerta, Béatrice Duval, and Jin-Kao Hao. A. gene expression data. Bioinformatics, 2005, 21(4):439-444.. hybrid GA/SVM approach for gene selection and classification. 17. Michael P.S. Brown, William Noble Grundy, David Lin, Nello. of microarray data. EvoWorkshops, 2006, pp. 34-44. 5. Terrence S. Furey, Nello Cristianini, Nigel Duffy, David W.. Cristianini, Charles Walsh Sugnet, Terrence S. Furey, Manuel. Bednarski, Michel Schummer, and David Haussler. Support. Ares Jr., and David Haussler. Knowledge-based analysis of. vector machine classification and validation of cancer tissue. microarray gene expression data by using support vector. samples using microarray expression data. Bioinformatics, 2000,. machines. Proceedings of the National Academy of Sciences,. 16 (10):906-914.. 2000, 97(1):262-267.. 6. Krzysztof Simek, Krzysztof Fujarewicz, Andrzej Swierniak,. 18. Alon U., Barkai N., Notterman D.A., Gish K.,Ybarra S., Mack. Marek Kimmel, Barbara Jarzab, Malgorzata Wiench, and Joanna. D., and Levine A.. Broad patterns of gene expression revealed by. Rzeszowska. Using SVD and SVM methods for selection,. clustering analysis of tumor and normal colon tissues by. classification, clustering and modeling of DNA microarray data.. oligonucleotide arrays. Proc. Nat. Acad. Sci. USA, 1999, 96:. Engineering Applications of Artificial Intelligence, 2004,. 6745-6750. 19. Jianwen Fang and Jerzy W. Grzymala-Busse. Leukemia. 17:417-427. 7. Guyon I., Weston J., Barnhill S., and Vapnik V.. Gene selection. prediction from gene expression data—a rough set approach.. for cancer classification using support vector machines. Machine. 2006 Annual Kansas City Area Life Sciences Research Day,. Learning, 2002, 46:389-422.. Kansas City, MO, 2006.. 8. Golub T.R., Slonim D.K., Tamayo P., Huard C., Gaasenbeek M.,. 20. Bulashevska S., Dubitzky W., and Eils R. Mining gene. Mesirov J.P., Coller H., Loh M.L., Downing J.R., Caligiuri M.A.,. expression data using rough set theory. In: Proceeding of Critical. Bloomfield C.D., and Lander E.S.. Molecular classification of. Assessment of Techniques for Microarray Data Analysis. cancer: class discovery and class prediction by gene expression. (CAMDA’00 Conference), Duke University, NC, US, 2000, pp. monitoring. Science, 1999, 286:531-537.. 4-5.. 9. Wei Chu, Zoubin Ghahramani, Francesco Falciani, and David L.. 21. Wadman I., Li J. X., Bash R. O., Forster A., Osada H., Rabbitts. Wild. Biomarker discovery in microarray gene expression data. T.H., and Baer R.. Specific in-vivo association between the Bhlh. with. and Lim proteins implicated in human T-cell leukemia. EMBO. Gaussian. processes.. Bioinformatics,. 2005,. 21(16):3385-3393.. Journal, 1994, 13:4831-4839.. 10. Herman Midelfart, Jan Komorowski, Kristin Norsett, Fekadu. 22. Simmons D. and Seed B.. Isolation of a cDNA encoding CD33,. Yadetie, Arne K. Sandvik, and Astrid Laegreid. Learning rough. a differentiation antigen of myeloid progenitor cells. Journal of. set classifiers from gene expressions and clinical Data.. Immunology, 1988, 141(8):2797-2800.. Fundamenta Informaticae, 2002, 53:155-183.. 23. Kamps MP, Murre C., Sun XH, and Baltimore D. A new. 11. Sung-Bae Cho and Hong-Hee Won. Machine learning in DNA. homeobox gene contributes the DNA binding domain of the. microarray analysis for cancer classification. Proceedings of the. t(1;19) translocation protein in pre-B ALL. Cell, 1990,. First Asia-Pacific Bioinformatics Conference on Bioinformatics,. 60(4):547-555.. 2003, 189-198.. 24. Han-yu Chuang, Huai-Kuang Tsai, and Yuan-fan Tsai. Ranking. 12. Yuhang Wang, Fillia S. Makedon, James C. Ford, and Justin. genes for discriminability on microarray data. Journal of. Pearlman. HykGene: a hybrid approach for selecting marker. Information Science and Engineering, 2003, 19:953-966.. genes for phenotype classification using microarray gene expression data. Bioinformatics, 2005, 21(8):1530-1537. 13. Chih-Chung Chang and Chih-Jen Lin. LIBSVM: A library for support. vector machines. (2001),. Software. available at - 1373. -.
(7)
數據
相關文件
– stump kernel: succeeded in specific applications infinite ensemble learning could be better – existing AdaBoost-Stump applications may switch. not the
1 Embedding Numerous Features: Kernel Models Lecture 1: Linear Support Vector Machine.. linear SVM: more robust and solvable with quadratic programming Lecture 2: Dual Support
2 Distributed classification algorithms Kernel support vector machines Linear support vector machines Parallel tree learning.. 3 Distributed clustering
2 Distributed classification algorithms Kernel support vector machines Linear support vector machines Parallel tree learning?. 3 Distributed clustering
“Transductive Inference for Text Classification Using Support Vector Machines”, Proceedings of ICML-99, 16 th International Conference on Machine Learning, pp.200-209. Coppin
• elearning pilot scheme (Four True Light Schools): WIFI construction, iPad procurement, elearning school visit and teacher training, English starts the elearning lesson.. 2012 •
Using sets of diverse, multimodal and multi-genre texts of high quality on selected themes, the Seed Project, Development of Text Sets (DTS) for Enriching the School-based
Solving SVM Quadratic Programming Problem Training large-scale data..
