Revealing the flexoelectricity in the
mixed-phase regions of epitaxial BiFeO
3
thin films
Cheng-En Cheng1,2, Heng-Jui Liu3, Franco Dinelli4, Yi-Chun Chen5, Chen-Shiung Chang1, Forest Shih-Sen Chien2& Ying-Hao Chu3
1Department of Photonics and Institute of Electro-Optical Engineering, National Chiao Tung University, Hsinchu, 30010, Taiwan, 2Department of Applied Physics, Tunghai University, Taichung, 40704, Taiwan,3Department of Materials Science and
Engineering, National Chiao Tung University, Hsinchu, 30010, Taiwan,4Consiglio Nazionale delle Ricerche, Istituto Nazionale di
Ottica, I-56124 Pisa, Italy,5Department of Physics, National Cheng Kung University, Tainan, 701, Taiwan.
Understanding the elastic response on the nanoscale phase boundaries of multiferroics is an essential issue in order to explain their exotic behaviour. Mixed-phase BiFeO3films, epitaxially grown on LaAlO3(001)
substrates, have been investigated by means of scanning probe microscopy to characterize the elastic and piezoelectric responses in the mixed-phase region of rhombohedral-like monoclinic (MI) and tilted
tetragonal-like monoclinic (MII,tilt) phases. Ultrasonic force microscopy reveal that the regions with low/
high stiffness values topologically coincide with the MI/MII,tiltphases. X-ray diffraction strain analysis
confirms that the MIphase is more compliant than the MII,tiltone. Significantly, the correlation between
elastic modulation and piezoresponse across the mixed-phase regions manifests that the flexoelectric effect results in the enhancement of the piezoresponse at the phase boundaries and in the MIregions. This
accounts for the giant electromechanical effect in strained mixed-phase BiFeO3films.
I
n the race for the development of sensing and actuation applications, a lot of attention has been paid to the search for materials with large mechanical response via external stimuli, such as piezoelectrics and shape memory alloys1. These materials present a complexity of phase constitutions, and the transformation betweendifferent phases plays a crucial role in showing large electromechanical responses2. Perovskite BiFeO
3(BFO) is
found to be a green piezo/ferroelectric material with longitudinal piezoelectric coefficient3(d
33) larger than
60 pm/V and spontaneous ferroelectric polarization4of about 100 mC/cm2. Therefore, BFO has been considered
as a good candidate to replace current Pb-based piezoelectrics.
Via imposing epitaxial strain to BFO films, the ground phase can be tuned from rhombohedral (R) to tetragonal (T) or orthorhombic, depending on the degree of strain and its sign (compressive or tensile)5–7.
Furthermore, by employing suitable substrates and thickness values, the R-like monoclinic MI and T-like
monoclinic MIIphases can coexist to form nanoscale self-organized alternative stripes8. These self-organized
phase boundaries provide a superior template to understand the fundamental physics underlying the giant electromechanical responses. Recently, researchers have thus spent a lot of efforts making relevant progresses. Some studies, carried out with techniques such as atomic force microscopy (AFM), X-ray diffraction (XRD), and transmission electron microscopy (TEM), suggest that the giant piezoelectric response in mixed-phase BFO films can be attributed to a phase transformation from MIIto mixed MI-MII8–10. The phase boundaries in mixed-phase
BFO films show an extraordinary enhancement of their piezoelectric response, e.g., a remarkably high d33(,
400 pm/V)11. Such a superior piezoelectric response can be possibly associated with the flexoelectric effect. In
addition to its superior piezoelectric response, intriguing magnetism properties have been also found12. Their
origins can be attributed to either piezomagnetic or flexomagnetic effects11. The flexoelectric effect is the
polar-ization response of materials to a strain gradient (hu/hx), i.e., an inhomogeneous deformation due to a break in centro-symmetry. The bulk electromechanical polarization (P) can be described with the following equation:
P~xEzmLu Lx: ð1Þ SUBJECT AREAS: STRUCTURAL PROPERTIES NANOSCALE MATERIALS Received 4 November 2014 Accepted 31 December 2014 Published 28 January 2015 Correspondence and requests for materials should be addressed to F.S.-S.C. (fsschien@ thu.edu.tw)
On the right hand side of Eq. (1), the first term is the dielectric response with the dielectric susceptibility x, and the second term is the flexoelectric response with the flexoelectric coefficient m. Flexoelectricity is of great interest for the development of nanoscale technologies, because large strain variations often present on the nanoscale to produce a strong flexoelectric effect13.
Most of these studies are based on structural or electrical and magnetic properties. However it is also very important to understand the elastic modulation of these phase boundaries, which could help to individuate the direct causes for large flexoelectricity in BFO. Studying the elastic moduli of nanometric mixed-phase regions in sub-100 nm-thick BFO films is a severe challenge for conventional techniques (such as Nanoindentation), because they do not provide sufficient spatial resolution. AFM possesses the required resolution to characterize local elastic properties of compliant materials such as polymers. However, the cantilevers employed in AFM are relatively too compliant (typically the spring constant is well under 100 N/m) to distinguish the elastic difference of very stiff materials, e.g., semi-conductors and metal oxides. Ultrasonic force microscopy (UFM) is an offspring of AFM specifically developed to measure the local elastic properties of stiff materials with compliant cantilevers14–16.
UFM operates by detecting the intrinsic nonlinearity of the probe-sample interaction, thanks to the application of a vertical vibration to the sample at an ultrasonic frequency (i.e., the exciting frequency is much higher than the fundamental resonant frequency of the can-tilever and off higher resonances).
In this paper, the topography, stiffness and piezoresponse of mixed-phase BFO are investigated by scanning probe techniques, i.e., AFM, UFM and piezoresponse force microscopy (PFM). It is demonstrated that UFM can qualitatively investigate the elastic modulation inside the mixed-phase regions of BFO thin films. Unlike the stiffer pure R-phase BFO, the stiffness of the R-like MI
phase is found to be lower than that of the T-like MIIphase. XRD
strain analysis by means of reciprocal space mapping (RSM) has been also carried out. The RSM results are in good agreement with the UFM findings. The elastic modulus exhibits kinks at the phase boundaries and higher elastic gradient in the MIphase. The
correla-tion between the elastic modulacorrela-tion and piezoresponse in mixed-phase regions indicates that the flexoelectric effect causes the piezo-response peaks at the phase boundaries and a higher piezopiezo-response inside the MIregions compared to that inside the MIIand tilted
T-like monoclinic MII,tiltregions.
Results
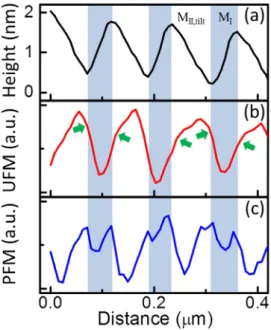
Scanning probe characterizations. The topography (AFM), the elastic response (UFM) and out-of-plane (OP) piezoresponse of the same area are shown in Fig. 1. Topography can be acquired simultaneously to either UFM or PFM images. In this case, we only report one AFM image, as they are identical. The topographic image shows the atomic flat terraces of MIImatrix and the
mixed-phase regions. The mixed mixed-phase regions consist of the MIand MII,tilt
phases12. The M
Iand MII,tiltphases can be considered as intermediate
phases making it possible a continuous transition from the highly-strained MII phase to the highly-relaxed distorted R phase with
increasing film thickness. The UFM image shows a clear contrast in the mixed-phase regions (Fig. 1b), indicating that UFM can resolve the elastic properties of the stripes on the nanoscale. A well detectable elastic modulation is noticeable across these regions, i.e., the stiffness is not uniform. Curved loops of the OP-PFM image belong to the MI/MII,tilt phase boundaries and each MI phase
region is enclosed by a loop (Fig. 1c)12,17. On the other hand, the
elastic modulation well correlates with the topographic and piezoresponse features.
To better illustrate the correlations among topography, stiffness and piezoelectricity in the mixed-phase regions, the line profile at the mixed-phase regions of the AFM image and the corresponding
profiles of UFM and PFM are shown in Fig. 2. The mixed-phase regions exhibit an asymmetric peak-and-valley landscape (Fig. 2a), where the tilted angles of left and right sides of the peaks are 2.6u and 1.6u, respectively8,12. The left/right sides of a peak are the areas of the
Figure 1|AFM (a), UFM (b) and PFM (c) images of a 70 nm BFO film on LAO, giving a representative view of the surface in terms of topography, stiffness, and piezoresponse.
Figure 2|Profiles of topography (a), stiffness (b) and piezoresponse (c) along the lines across the same mixed-phase regions drawn in Fig. 1. The shadowed areas indicate the MIphase and the others the MII,tiltphase.
The arrows in (b) indicate the kinks of the elastic modulation at the boundaries.
MI/MII,tilt phases with widths of approximately 35 and 80 nm,
respectively. These peaks and valleys are exactly the phase bound-aries between the MIand MII,tiltphases. From the stiffness profile
(Fig. 2b), the low/high stiffness values topologically coincide with the MI/MII,tiltphases, indicating that the MIphase has an elastic modulus
lower than that of MII,tiltphase.
Both experimental and theoretical studies demonstrate that the elastic modulus of the strain-free R phase (from 130 to 200 GPa, depending on the direction of interest) is higher than that of the highly-strain MIIphase (,100 GPa)18–20. Calculations by means of
first-principles density-function theory (DFT) also confirm that BFO with a lower unit-cell volume has a higher elastic modulus. Based on the TEM results, the average lattice parameters of the MIphase can be
still estimated as a 5 b < 3.82 A˚ , c < 4.16 A˚ in a pseudo-tetragonal form, significantly different from that of the R phase (a 5 b < 3.92 A˚ , c < 4.01 A˚ ). These observations indicate that the MIphase has the
smallest unit-cell volume (12.14 A˚3per atom) compared to the other
phases (13.28 A˚3per atom for the M
IIphase and 12.32 A˚3per atom
for the R phase). Thus, the MI phase should be the toughest one
according to this supposition. Nevertheless, the UFM data in terms of the stiffness in the mixed-phase regions are against the DFT prediction.
X-ray diffraction strain analysis. To verify the UFM findings, room-temperature RSM has been then performed. RSM data of the partially-relaxed BFO thin film on LaAlO3(001) substrate (LAO)
include the diffraction peaks of the MI, MII and MII,tilt phases
(Fig. 3). The MI phase has a lattice constant in c axis of 4.16 A˚ ,
whereas MII and MII,tiltphases have an identical lattice constant
(c 5 4.65 A˚ ). Both the MIand MII,tiltphases have an off-normal
c-axis orientation, where the MIphase has a tilted angle of 2.8u and the
MII,tiltphase of 1.6u. The tilted angle values are well consistent with
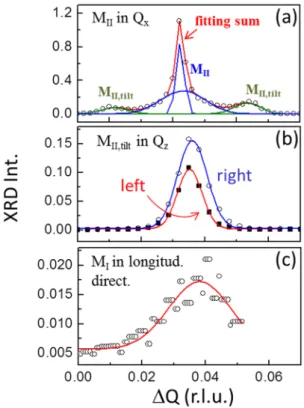
the results obtained from the AFM topography. Fig. 4 shows the diffraction profiles across the MII,tiltpeaks in Qxand Qz, and the
MIpeak in the longitudinal direction. The peaks can be fitted by
Gaussian functions; the full widths at half maximum (FWHM) of those peaks are listed in Table I. The FWHM of the MIpeak in Qx/Qz
is the x/z component of the FWHM in the longitudinal direction. Obviously, the peak of the MIphase is wider than that of the MII,tilt
phase by 58% in Qxand 33% in Qz. The wider peak in the Qxreflects
the misorientation of the c axis, while the wider peak in the Qzreflects
a larger distortion in the c-axis spacing and/or a smaller grain size in the c axis. From the cross-section TEM image, reported in the supplementary materials by Liu et al.8, the M
I and MII,tilt phases
have a well epitaxial relationship with the MII phase and the
substrate. The grains of all phases extend from the surface to the substrate, so those phases have the same grain size along the out-of-plane direction. Therefore, the broadness in Qzof MIphase is merely
attributed to the distortion of the c-axis spacing instead of a grain size
effect. The larger misorientation and spacing distortion of the c-axis of the MI phase depict its more ambiguous lattice structure, which
implies that the stiffness in the MIphase is lower than that in MII,tilt.
Furthermore, the lower value in stiffness of the MIphase can be
evidenced from the structural aspect. In the mixed region, the MIand
MII,tiltphases are the products of the strain relaxation and the
inter-mediate phases to connect with the MIIand R phases. The MII,tilt
phase has the same structure of the MIIphase but slightly tilted with
respect to the surface normal. The MIphase has a large tilted angle
and the smallest lattice structure. For compensating the difference of height between the MIIand R phases, MIvaries more dramatically (a
transverse distance of about 35 nm with a tilted angle of 2.8u on the macroscale) than MII,tilt(a transverse distance of about 80 nm with a
tilted angle of 1.6u on the macroscale), implying that MIis softer than
MII,tilt. Therefore, we suggest that the intermediate MIphase is not in
the low energy state, and not so rigid and stable as the R and MII
phases, thus being more compliant than the other phases.
Flexoelectric effect. The correlation between the stiffness and piezoresponse profiles (Fig. 2b and 2c) can illustrate the flexoelectric effect in mixed-phase BFO films. From the stiffness profile, Kinks at the interface indicate a strain discontinuity between MI and MII,tilt
phases. Those kinks coincide with the piezoelectric peaks at the boundaries, which implies that the flexoelectric effect results in the enhancement of piezoresponse. In addition, the slope of stiffness on the MIside is higher than that on the MII,tiltside, indicating that the
elastic (strain) gradient in the MIphase is higher than that in the MII,tilt
phase. Besides the piezoresponse inside the more compliant MI
regions is higher than that inside the neighboring stiffer MII,tiltand
matrix MII regions. Therefore, the higher piezoresponse in the MI
regions can be attributed to the flexoelectric effect induced by the strain gradient. This result of higher piezoeresponse in MI regions
conflicts with the general understanding that the piezoelectricity of
Figure 3|RSM of BFO thin films around the direction LAO (001) in order to show the diffraction peaks of the R, MI(diamond), MII(circle)
and MII,tilt(square) phases.
Figure 4|XRD Peak profiles of (a) the MII(blue) and MII,tilt(olive)
phases in Qx, (b) the MII,tiltphase in Qz, and (c) the MIphase in the
longitudinal direction. The peak of the MIIphase can be deconvoluted into
two components of crystalline and diffusive scatterings due to the fact that the film thickness is of only 70 nm.
MIIphase is a higher than that of R phase21. It is because MIphase is
not a low energy state as other phases, and behaves differently from the ground R phase in piezoelectricity.
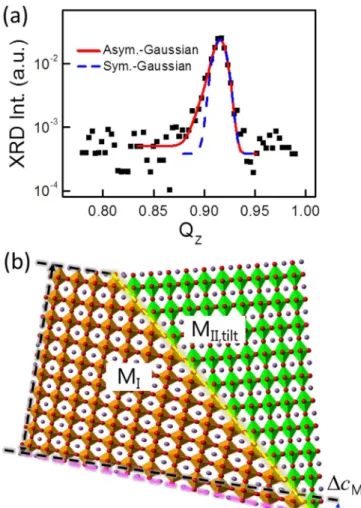
To estimate the strain magnitude in the mixed-phase MIphase
near the MI and MII,tiltinterface, a h-2h scan with respect to the
surface normal of the MIphase (Fig. 5a) is extracted from the RSM
image (Fig. 3) at H 5 0.041 r.l.u. It shows an asymmetric diffraction peak, indicating that the lattice constant c is not uniform in MIphase.
The peak is fitted by an asymmetric Gaussian function and the half widths at half maximum are sh56.6331023r.l.u. on the high Qzside
and sl57.8931023r.l.u. on the low Qzside. shpresents the
con-tributions of the normal distribution of lattice constant and the grain-size broadening. The larger slindicates there is an additional
component (ssg) due to strain gradient at phase boundaries.
Assuming a combination of peak widths by s2l~s2hzs2sg, ssg5
4.2931023r.l.u. is obtained, corresponding to a strain of 10.47%.
There is a strain in the compliant MI phase at the boundary. To
accommodate the lattice mismatch between MIand MII,tiltphases
(Fig. 5b), the more compliant MIphase exhibits an expansion of the
out-of-plane lattice constant by DcMI, whereas DcMIbecome its
max-imum at the interface. The strain relaxes with the distance apart from the phase boundary. Such a strain gradient supports the findings by UFM and PFM that the flexoeletric effect accounts for the extraord-inary polarization in mixed-phase BFO thin films. The enhancement of polarization in the mixed-phase regions is about 55 mC/cm2from
Ref. 22, the region with strain gradient is 17 nm in width (half width of MI regions), and the volume fraction of the MI phase is 50%
according to topography. Therefore the flexoelectric coefficient of the MIphase is estimated to be < 1.4 mC/m by Eq. (1), which is
comparable to that of perovskite ceramics in paraelectric phases13. Discussion
The elastic response in the mixed-phased region of BFO thin films, epitaxially grown on LAO substrates, has been investigated by means of scanning probe microscopy and X-ray diffraction strain analysis. Ultrasonic force microscopy can spatially resolve the nanoscale elastic modulation and regions with low/high stiffness values topo-logically coincide with the MI/MII,tiltphases. Although the MIphase
has a smaller unit-cell volume, it is more compliant than the other phases, as confirmed by X-ray diffraction strain analysis. Because of the flexoelectric effect, the elastic kink at the boundary produces the piezoresponse peak at the phase boundary and a higher elastic gra-dient on the MIside produces a higher piezoresponse inside the MI
phase, resulting in an enhanced electromechanical response in the strained mixed-phase BFO films.
Methods
Mixed-phase BFO films are epitaxially grown on a single-crystal LAO substrate (LAO) by means of pulse laser deposition. The thickness of the samples herein reported is of around 70 nm. These BFO films are subjected to a highly compressive strain (. 4%), thus MIand MIIphases coexist.
The AFM setup is made of a commercial probe head (NT-MDT, SMENA) with electronics and control software developed in-house. The cantilevers employed have a diamond-coated tip, a nominal spring constant of around 5.5 N/m and a resonant frequency of around 150 kHz (NT-MDT, DCP-01). To conduct UFM, the samples are mounted on a piezo-disc that can be driven at around 4 MHz with an amplitude modulation frequency of 3.7 kHz (Agilent 33220A) to generate a maximal oscillating amplitude below 1 nm. The piezoresponse of BFO films is characterized by PFM. PFM and UFM can be quickly switched from one to the other while the tip is still in contact. To collect the UFM and PFM data, a digital lock-in amplifier (Zurich, HF2LI) is employed. The color codes of the images are the following: brighter for higher regions in AFM, higher stiffness in UFM, and higher piezoelectricity in PFM. For UFM in particular, a brighter color represents a lower local indentation and thus corresponds to a stiffer region.
RSM has been performed using a standard Huber four-circle X-ray diffractometer operated at 50 kV and 200 mA with Cu Ka1radiation in the X-ray laboratory at
National Synchrotron Radiation Research Center (NSRRC) in Hsinchu, Taiwan. The incident beam is monochromated with a flat Ge (111) crystal and two sets of slits serve to eliminate Cu Ka2so as to obtain a high wave-vector resolution of 0.01 nm-1order in
the reciprocal space. The reciprocal space map is recorded by a series of h–2h scans with different v and plotted in the reciprocal lattice unit Q that is normalized to the LAO (001) substrate (1 r.l.u. 5 2p/aLAO).
1. Zhang, J. X. et al. A nanoscale shape memory oxide. Nat. Commun. 4, 3768 (2013). 2. Fu, H. X. & Cohen, R. E. Polarization rotation mechanism for ultrahigh
electromechanical response in single-crystal piezoelectrics. Nature 403, 281 (2000).
Table I | FWHM of the X-ray diffraction peaks for the MIand MII,tiltphasesa)
MI MII,tilt
FWHM (31023r.l.u.) Q
x 13.0 8.2
Qz 14.5 10.9
a)As the two diffraction peaks (left and right) of each phase are similar, only one FWHM is listed.
Figure 5| (a) Asymmetric h-2h diffraction peak to the surface normal of the MIphase extracted from the RSM image (Fig. 3) at H 5 0.041 r.l.u. The
peak can be better fitted by an asymmetric Gaussian function (red), while a symmetric Gaussian function (blue) is reported only to visualize the asymmetry of the peak. (b) Schematic illustration of the strain gradient of the MIphase near the interface (yellow line) between the MI(brown) and
3. Chu, Y.-H. et al. Domain control in multiferroic BiFeO3through substrate
vicinality. Adv. Mater. 19, 2662 (2007).
4. Chu, Y.-H., Martin, L. W., Holcomb, M. B. & Ramesh, R. Controlling magnetism with multiferroics. Mater. Today 10, 16 (2007).
5. Christen, H. M., Nam, J. H., Kim, H. S., Hatt, A. J. & Spaldin, N. A. Stress-induced R-MA-MC-T symmetry changes in BiFeO3films. Phys. Rev. B 83, 144107 (2011).
6. Yang, J. C. et al. Orthorhombic BiFeO3, Phys. Rev. Lett. 109, 247606 (2012).
7. Zeches, R. J. et al. A strain-driven morphotropic phase boundary in BiFeO3.
Science 326, 977 (2009).
8. Liu, H.-J. et al. Strain-driven phase boundaries in BiFeO3thin films studied by
atomic force microscopy and x-ray diffraction. Phys. Rev. B 85, 014104 (2012). 9. Zhang, J. X. et al. Large field-induced strains in a lead-free piezoelectric material.
Nat. Nanotechnol. 6, 98 (2011).
10. Damodaran, A. R. et al. Nanoscale structure and mechanism for enhanced electromechanical response of highly strained BiFeO3thin films. Adv. Mater. 23,
3170 (2011).
11. Zhang, J. X., Zeches, R. J., He, Q., Chu, Y.-H. & Ramesh, R. Nanoscale phase boundaries: a new twist to novel functionalities. Nanoscale 4, 6196 (2012). 12. He, Q. et al. Electrically controllable spontaneous magnetism in nanoscale mixed
phase multiferroics. Nat. Commun. 2, 225 (2011).
13. Zubko, P., Catalan, G. & Tagantsev, A. K. Flexoelectric effect in solids. Annu. Rev. Mater. Res. 43, 387 (2013).
14. Kolosov, O. & Yamanaka, K. Nonlinear detection of ultrasonic vibrations in an atomic force microscope. Jpn. J. Appl. Phys. 32, L1095 (1993).
15. Kolosov, O., Castell, M. R., Marsh, C. D. & Briggs, G. A. D. Imaging the elastic nanostructure of Ge islands by ultrasonic force microscopy. Phys. Rev. Lett. 81, 1046 (1998).
16. Dinelli, F. et al. Mapping surface elastic properties of stiff and compliant materials on the nanoscale using ultrasonic force microscopy. Phil. Mag. A, 80, 2299 (2000). 17. Chen, Y.-C. et al. Electrical control of multiferroic orderings in mixed-phase
BiFeO3films. Adv. Mater. 24, 3070 (2012).
18. Doig, K. I. et al. Coherent magnon and acoustic phonon dynamics in tetragonal and rare-earth-doped BiFeO3multiferroic thin films. Phys. Rev. B 88, 094425
(2013).
19. Shang, S. L., Sheng, G., Wang, Y., Chen, L. Q. & Liu, Z. K. Elastic properties of cubic and rhombohedral BiFeO3from first-principles calculations. Phys. Rev. B
80, 052102 (2009).
20. Dong, H., Chen, C., Wang, S., Duan, W. & Li, J. Elastic properties of tetragonal BiFeO3from first-principles calculations. Appl. Phys. Lett. 102, 182905 (2013).
21. Ederer, C. & Spaldin, N. A. Effect of epitaxial strain on the spontaneous polarization of thin film ferroelectrics. Phys. Rev. Lett. 95, 257601 (2005). 22. Zhang, J. X. et. al. Microscopic origin of the giant ferroelectric polarization in
tetragonal-like BiFeO3. Phys. Rev. Lett. 107, 147602 (2011).
Acknowledgments
This work is supported by Ministry of Science and Technology of Taiwan (Grant NO. MOST 102-2112-M-029-005-MY3), and National Chiao Tung University (2013 NCTU Short-term Research Program Scholarship). The authors would like to thank Dr. P. Pinque of NEST, Istituto Nanoscienze-CNR and Scuola Normale Superiore for his kindly support.
Author contributions
C.-E.C., H.-J.L. and F.D. performed the experiments. H.-J.L. and Y.-H.C. contributed material. F.S.-S.C., F.D., Y.-H.C., Y.-C.C. and C.-S.C. conceived and designed the experiments. F.S.-S.C., Y.-H.C. and F.D. co-wrote the paper.
Additional information
Competing financial interests:The authors declare no competing financial interests. How to cite this article:Cheng, C.-E. et al. Revealing the flexoelectricity in the mixed-phase regions of epitaxial BiFeO3thin films. Sci. Rep. 5, 8091; DOI:10.1038/srep08091 (2015).
This work is licensed under a Creative Commons Attribution-NonCommercial-NoDerivs 4.0 International License. The images or other third party material in this article are included in the article’s Creative Commons license, unless indicated otherwise in the credit line; if the material is not included under the Creative Commons license, users will need to obtain permission from the license holder in order to reproduce the material. To view a copy of this license, visit http:// creativecommons.org/licenses/by-nc-nd/4.0/