Open Access
Methodology article
Protein structure search and local structure characterization
Shih-Yen Ku
1,2and Yuh-Jyh Hu*
1,3Address: 1Department of Computer Science, National Chiao Tung University, 1001 University Rd. Hsinchu, Taiwan, 2Institute of Statistics,
Academia Sinica, Taipei, Taiwan and 3Institute of Biomedical Engineering, National Chiao Tung University, 1001 University Rd. Hsinchu, Taiwan
Email: Shih-Yen Ku - [email protected]; Yuh-Jyh Hu* - [email protected] * Corresponding author
Abstract
Background: Structural similarities among proteins can provide valuable insight into their
functional mechanisms and relationships. As the number of available three-dimensional (3D) protein structures increases, a greater variety of studies can be conducted with increasing efficiency, among which is the design of protein structural alphabets. Structural alphabets allow us to characterize local structures of proteins and describe the global folding structure of a protein using a one-dimensional (1D) sequence. Thus, 1D sequences can be used to identify structural similarities among proteins using standard sequence alignment tools such as BLAST or FASTA.
Results: We used self-organizing maps in combination with a minimum spanning tree algorithm to
determine the optimum size of a structural alphabet and applied the k-means algorithm to group protein fragnts into clusters. The centroids of these clusters defined the structural alphabet. We also developed a flexible matrix training system to build a substitution matrix (TRISUM-169) for our alphabet. Based on FASTA and using TRISUM-169 as the substitution matrix, we developed the SA-FAST alignment tool. We compared the performance of SA-FAST with that of various search tools in database-scale search tasks and found that SA-FAST was highly competitive in all tests conducted. Further, we evaluated the performance of our structural alphabet in recognizing specific structural domains of EGF and EGF-like proteins. Our method successfully recovered more EGF sub-domains using our structural alphabet than when using other structural alphabets. SA-FAST can be found at http://140.113.166.178/safast/.
Conclusion: The goal of this project was two-fold. First, we wanted to introduce a modular design
pipeline to those who have been working with structural alphabets. Secondly, we wanted to open the door to researchers who have done substantial work in biological sequences but have yet to enter the field of protein structure research. Our experiments showed that by transforming the structural representations from 3D to 1D, several 1D-based tools can be applied to structural analysis, including similarity searches and structural motif finding.
Background
Genome sequencing projects continue to produce amino acid sequences; however, understanding the biological roles played by these putative proteins requires
knowl-edge of their structure and function [1]. Despite that empirical structure determination methods have provided structural information for some proteins, computational methods are still required for the large number of proteins Published: 22 August 2008
BMC Bioinformatics 2008, 9:349 doi:10.1186/1471-2105-9-349
Received: 9 February 2008 Accepted: 22 August 2008 This article is available from: http://www.biomedcentral.com/1471-2105/9/349
© 2008 Ku and Hu; licensee BioMed Central Ltd.
This is an Open Access article distributed under the terms of the Creative Commons Attribution License (http://creativecommons.org/licenses/by/2.0), which permits unrestricted use, distribution, and reproduction in any medium, provided the original work is properly cited.
whose structures are difficult to determine experimen-tally. And while the primary sequence should contain the folding guide for a given protein, our ability to predict the three-dimensional (3D) structure from the primary sequence alone remains limited. Some ab initio methods do not require such information, but the application of these methods is often limited to small proteins [2,3]. Structure alignment research has led to the discovery of homologues of novel protein structures. And, although many structure alignment tools have been developed, such as CE [4], DALI [5], VAST [6], MAMMOTH [7], FAT-CAT [8], and Vorolign [9], we wanted to provide a differ-ent perspective on protein structure analysis. Previous studies of protein structures have shown the importance of repetitive secondary structures, particularly α-helices and β-sheets, in overall structure determination. Together with variable coils, these structures constitute a basic three-letter structural alphabet that has been used in the development of early-generation secondary structure pre-diction algorithms (such as GOR [10]) as well as more recent-generation algorithms. These newer algorithms have been applied to neural networks, homology sequences, and discriminative models [11-14], and their accuracy in predicting secondary structure approaches 80%. However, despite this predictive accuracy, the three-letter alphabet does not contain the information neces-sary to approximate more refined 3D reconstructions. The recent rapid increase in the number of available pro-tein structures has allowed more precise and thorough studies of protein structures. Several authors have devel-oped more complex structural alphabets that incorporate information about the heterogeneity of backbone protein structures by using subsets of small protein fragments that are observed frequently in different protein structure data-bases [15-17]. The alphabet size varies from several letters to about 100 letters [18]. For example, Unger et al. [19] and Schuchhardt et al. [20] used k-means methods and self-organizing maps (SOMs), respectively, to identify the most common folds, but the number of clusters generated was too large to have substantial predictive value. By applying autoassociative neural networks, Fetrow et al. defined six clusters that represent super-secondary struc-tures which subsume the classic secondary strucstruc-tures [21]. Bystroff and Baker produced similar short folds of differ-ent lengths and grouped them into 13 clusters that they used to predict 3D structure [22]. Camproux et al. devel-oped a hidden Markov model (HMM) approach that accounted for the Markovian dependence to learn the geometry of the structural alphabet letters and the local rules for the assembly process [23]. Fixing the alphabet size to 23 letters, Yang & Tung applied a nearest-neighbor algorithm on a (κ, α)-map of structural segments to iden-tify the 23 groups of segments used in their alphabet [24].
More details about these local structures can be found in a recent review [25].
In this study, we developed a flexible pipeline for protein structural alphabet design based on a combinatorial, multi-strategy approach. Instead of applying cross-valida-tion [22] or Markovian processes [15] to refine the clusters directly, we used SOMs and Bayesian Information Crite-rion (BIC) to determine the optimum size of structural alphabet. We then applied the k-means algorithm [26] to group protein fragments into clusters, forming the bases of our structural alphabet. Moreover, unlike most other works that built substitution matrices for alphabets based on known blocks of aligned proteins, we used a matrix training framework that generated matrices automatically without depending on known alignments. An expressive structural alphabet allows us to quantify the similarities among proteins encoded in the appropriate letters. It also enables the primary representation of 3D structures using standard 1D amino acid sequence alignment methods. To demonstrate the feasibility of our new method, we veri-fied the application of the alphabet produced by our pipe-line and the trained substitution matrix to a widely used 1D alignment tool, FASTA [27]. We conducted several experiments using the same datasets used in other recently published works and evaluated the performance of our tool in database-scale searches. In addition to investigat-ing whether our alphabet and matrix worked well with 1D alignment tools in database searches, we evaluated the ability of our structural alphabet to characterize local structural features.
Results
Structural alphabet
By combining SOMs, minimum spanning trees, and k-means clustering, we developed a multi-strategy approach to designing a protein structural alphabet. To derive an appropriate substitution matrix for the new alphabet, we developed a matrix training framework that would auto-matically refine an initial matrix repeatedly until it con-verged. Unlike some previous works that presumed the size of the alphabet [23], our method determined the alphabet size autonomously and statistically. Various experiments were conducted to evaluate our methodol-ogy.
The SOM is an unsupervised inductive learner and can be viewed as topology preserving mapping from input space onto the 2D grid of map units [28]. The number of map units in SOMs defines an inductive bias [29], as does the number of hidden units for the feedforward artificial neu-ral networks, and it affects the clustering results. By sys-tematically varying the number of SOM map units and applying BIC, we identified the most frequent number of clusters that maximized the BIC and used this number to
define the size of the alphabet. We tested SOMs ranging in size from 10 × 10 to 200 × 200, ultimately defining the size of our alphabet at 18 letters. The relationship between number of clusters found and number of SOM map units used is summarized in Table 1.
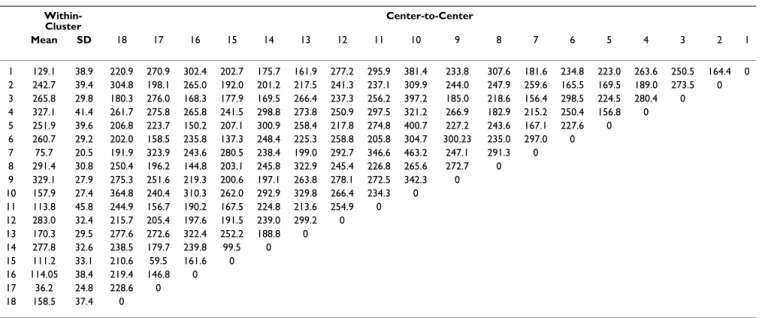
To verify whether fragments were assigned to the same cluster by the various SOMs, we analyzed those SOMs (with varying numbers of map units) that produced 18 clusters, including SOMs sized 80 × 80, 90 × 90, 190 × 190 units, etc. We calculated the overlap level between any two of the SOMs, defined as percentage of fragments that belonged to the same cluster. The average overlap between all pairs of SOMs for each of the 18 clusters was over 90%, indicating that these clusters were very consist-ent (Table 2). Table 3 and 4 display the within-cluster Euclidean distance, defined as the average distance of each segment to the center, and the center-to-center Euclidean distance for the 18 protein fragment clusters found by our method and by SOM alone, respectively. The average Phi/ Psi angles (i.e. the Phi/Psi angles of the centroid) for the 18 clusters are presented in Table 5. As indicated in Table 3 and 4, the within-cluster Euclidean distances for our clusters were smaller than those of the SOM clusters, which suggested that our 18 clusters were more coherent. On the other hand, the center-to-center distances for our clusters were larger than those of the SOM clusters, indi-cating that our clusters were better separated from each other. The 3D conformation of the representative segment for each alphabet letter is illustrated in Figure 1 and the superimposition of protein segments is shown in Figure 2. To verify that these representative segments could be the building blocks for protein structures, we analyzed the fre-quency of their occurrence in four major structural classes according to the Structural Classification of Proteins (SCOP): all-alpha, all-beta, alpha/beta, and alpha+beta [30]. The frequency of each category of segments is pre-sented in Table 6. The alpha helix segments reprepre-sented by alphabet letters T, P, and R occurred more often in the
all-alpha class than did the other segments. Similarly, more beta sheet segments, such as N, E, and A, were found in the all-beta class. In both the alpha/beta and alpha+beta classes, most of the segments were found to be either alpha helices or beta sheets.
TRISUM – Substitution matrix
Most approaches to constructing substitution matrices require the alignment of known proteins [24,31,32]. Because alignments are not always available and their validity can be dubious, we used a self-training strategy to build the substitution matrix for our new structural alpha-bet. This training framework had a flexible and modular design, and unlike most other approaches, it did not rely on the pre-alignment of protein sequences or structures. Different training data or alignment tools can be incorpo-rated into this framework to generate appropriate matrices under various circumstances. In this study, we used the non-redundant proteins contained in SCOP1.69 with sequence similarity of less than 40% for training, exclud-ing those proteins in SCOP-894 and the 50 test proteins (see details below) to ensure that the training data and the testing data did not overlap. We defined the positive hit rate of a query as the ratio of the number of positive hits to the size of the family the query belonged to. As we iter-ated each training protein (as a query), we refined the matrix until we could no longer increase the average pos-itive hit rate of all the proteins. We tried different learning rates ranging from 0.25 to 1.00. The final average positive hit rates under different learning rates were similar, rang-ing between 0.9112 and 0.9153. An example of the learn-ing curve of matrix trainlearn-ing is presented in Figure 3. We selected the converged matrix with the maximum positive hit rate with the learning rate set to 0.50. We named this matrix TRISUM-169 (TRained Iteratively for SUbstitution Matrix-SCOP1.69), as shown in Figure 4.
Table 1: Relationship between the number of clusters found and the number of SOM map units used
SOM map size Number of clusters SOM map size Number of clusters
10 × 10 6 110 × 110 24 20 × 20 9 120 × 120 19 30 × 30 10 130 × 130 21 40 × 40 12 140 × 140 22 50 × 50 15 150 × 150 18 60 × 60 13 160 × 160 15 70 × 70 14 170 × 170 21 80 × 80 18 180 × 180 18 90 × 90 18 190 × 190 18 100 × 100 20 200 × 200 18
Our analysis determined that among the number of clusters that maximized the BIC, 18 clusters occurred most frequently. Thus, we assigned 18 letters to our alphabet.
Table 2: The average overlap between all pairs of SOMs that produced 18 clusters of fragments
Cluster 1 2 3 4 5 6 7 8 9 10 11 12 13 14 15 16 17 18
Overlap 99.8 98.4 96.7 97.4 97.4 94.3 99.1 95.0 97.8 94.6 99.8 95.6 96.7 95.3 95.7 98.2 96.3 95.5
Table 3: Summary of the within-cluster Euclidean distance and the center-to-center Euclidean distance for 18 protein fragment clusters found by our alphabet design pipeline
Within-Cluster Center-to-Center Mean SD 18 17 16 15 14 13 12 11 10 9 8 7 6 5 4 3 2 1 1 116.6 37.2 252.3 300.4 330.1 242.8 181.7 182.1 317.6 327.7 415.4 266.3 329.0 181.7 242.5 262.2 273.6 253.4 193.2 0 2 238.7 38.5 315.8 226.6 272.7 197.4 243.3 227.2 285.3 270.5 346.1 283.9 285.4 261.3 189.5 182.3 215.0 296.0 0 3 264.7 29.8 219.7 279.8 193.6 220.6 190.4 284.1 251.1 292.9 413.2 195.1 237.6 181.4 324.4 234.1 285.9 0 4 319.3 41.5 297.8 297.0 270.7 285.5 311.5 288.6 286.9 317.1 352.2 302.9 184.3 250.7 256.2 193.3 0 5 250.4 39.7 248.6 268.9 190.2 238.1 302.2 280.1 258.5 287.2 406.6 267.2 258.8 192.8 229.0 0 6 257.5 28.0 220.4 174.2 242.3 180.4 262.8 266.2 264.4 229.1 310.3 322.3 270.9 308.6 0 7 72.2 20.4 220.8 356.7 289.2 297.5 266.1 244.8 307.2 361.1 478.3 248.9 316.8 0 8 282.2 31.0 275.3 214.2 186.1 218.9 259.1 335.6 258.2 253.8 286.9 273.9 0 9 320.9 27.9 275.8 287.6 250.7 244.5 222.6 292.2 286.7 307.3 354.3 0 10 148.8 26.1 406.3 243.1 334.4 286.3 333.5 361.8 293.2 240.8 0 11 97.1 43.4 290.4 169.5 214.8 178.9 248.7 238.3 270.4 0 12 272.0 32.7 259.7 226.6 200.7 218.7 269.1 325.6 0 13 133.6 33.2 291.2 309.3 334.3 267.6 230.5 0 14 272.8 31.4 255.5 206.2 258.7 145.3 0 15 106.2 32.3 241.1 76.8 162.1 0 16 109.0 39.1 221.8 172.6 0 17 33.2 23.2 272.9 0 18 146.2 38.2 0
Table 4: Summary of the within-cluster Euclidean distance and the center-to-center Euclidean distance for 18 protein fragment clusters found by the SOM alone
Within-Cluster Center-to-Center Mean SD 18 17 16 15 14 13 12 11 10 9 8 7 6 5 4 3 2 1 1 129.1 38.9 220.9 270.9 302.4 202.7 175.7 161.9 277.2 295.9 381.4 233.8 307.6 181.6 234.8 223.0 263.6 250.5 164.4 0 2 242.7 39.4 304.8 198.1 265.0 192.0 201.2 217.5 241.3 237.1 309.9 244.0 247.9 259.6 165.5 169.5 189.0 273.5 0 3 265.8 29.8 180.3 276.0 168.3 177.9 169.5 266.4 237.3 256.2 397.2 185.0 218.6 156.4 298.5 224.5 280.4 0 4 327.1 41.4 261.7 275.8 265.8 241.5 298.8 273.8 250.9 297.5 321.2 266.9 182.9 215.2 250.4 156.8 0 5 251.9 39.6 206.8 223.7 150.2 207.1 300.9 258.4 217.8 274.8 400.7 227.2 243.6 167.1 227.6 0 6 260.7 29.2 202.0 158.5 235.8 137.3 248.4 225.3 258.8 205.8 304.7 300.23 235.0 297.0 0 7 75.7 20.5 191.9 323.9 243.6 280.5 238.4 199.0 292.7 346.6 463.2 247.1 291.3 0 8 291.4 30.8 250.4 196.2 144.8 203.1 245.8 322.9 245.4 226.8 265.6 272.7 0 9 329.1 27.9 275.3 251.6 219.3 200.6 197.1 263.8 278.1 272.5 342.3 0 10 157.9 27.4 364.8 240.4 310.3 262.0 292.9 329.8 266.4 234.3 0 11 113.8 45.8 244.9 156.7 190.2 167.5 224.8 213.6 254.9 0 12 283.0 32.4 215.7 205.4 197.6 191.5 239.0 299.2 0 13 170.3 29.5 277.6 272.6 322.4 252.2 188.8 0 14 277.8 32.6 238.5 179.7 239.8 99.5 0 15 111.2 33.1 210.6 59.5 161.6 0 16 114.05 38.4 219.4 146.8 0 17 36.2 24.8 228.6 0 18 158.5 37.4 0
Comparison with other tools
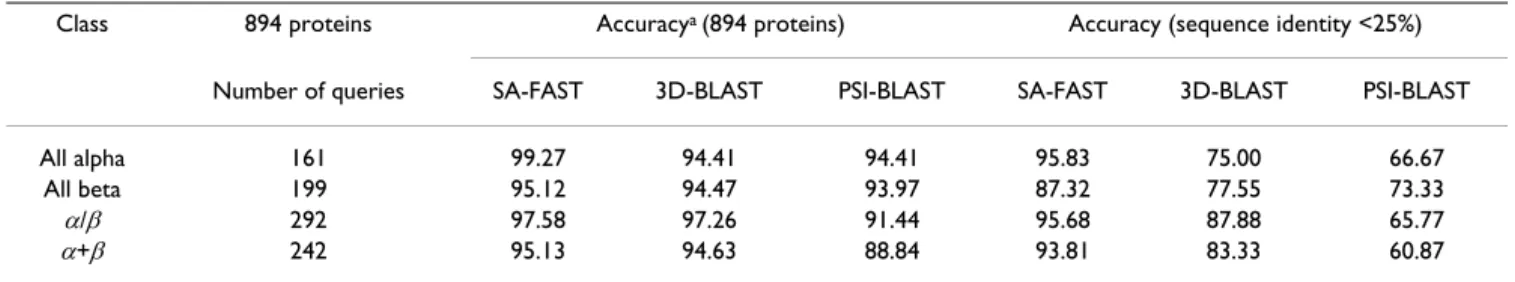
Several protein structure search tools based on 1D align-ment algorithms have been developed, including SA-Search [33], YAKUSA [34], and 3D-BLAST [24]. Yang and Tung tested 3D-BLAST on the SCOP database scan task [24]. They prepared a protein query dataset named SCOP-894 from SCOP 1.67 and 1.69; this dataset contains SCOP-894 proteins with <95% sequence similarity. We tested SA-FAST on the same dataset in order to allow direct compar-ison (Table 7). The results indicated that SA-FAST
outper-formed 3D-BLAST and PSI-BLAST in the test of the SCOP-894 query dataset.
We also used the same 50 proteins selected from SCOP95-1.69 that were used by Yang & Tung to compare SA-FAST with 3D-BLAST, PSI-BLAST, YAKUSA, MAMMOTH, and CE, in search time, predictive accuracy, and precision. Other search tools exist, such as PBE [35], SA-Search [33], and Vorolign [9], but because they either could not be tested on the SCOP database directly or the versions of their databases provided were too old (e.g. ASTRAL in PBE
Table 5: The average Phi/Psi angles (i.e. the Phi/Psi angles of the centroid) for the 18 clusters found by our alphabet design pipeline
Φ(i) Φ(i+1) Φ(i-1) Φ(i+2) ψ(i) ψ(i-1) ψ(i-2) ψ(i+1)
1(A) -97.99 -70.43 -104.52 -79.77 132.99 118.98 132.37 -44.26 2(R) -67.81 -67.48 -92.52 -69.17 -52.78 134.75 96.12 -35.69 3(N) -98.66 -99.17 -83.46 -104.16 132.56 75.64 -36.97 134.01 4(D) 90.39 -63.35 -93.54 -84.31 -5.43 97.71 115.22 94.64 5(C) -88.09 -102.50 -93.58 -97.49 -51.56 88.66 106.12 133.27 6(Q) -65.87 -69.19 -85.50 -59.89 -35.12 -50.41 129.98 -37.57 7(E) -107.28 -96.08 -107.66 -105.96 132.71 130.92 133.88 133.06 8(G) 89.16 -93.43 -62.92 -90.25 20.65 0.22 -32.50 85.94 9(H) -91.05 -90.16 91.91 -91.53 100.48 103.36 5.40 75.56 10(I) 58.59 56.79 55.50 54.75 -42.38 -38.76 -47.77 -48.46 11(L) -71.08 -84.21 -65.92 87.57 -21.11 -29.95 -31.80 20.00 12(K) -83.07 95.78 -69.02 -91.34 9.50 -9.18 -5.50 100.52 13(M) -88.72 -64.82 -95.72 91.27 100.65 113.69 107.43 0.70 14(F) -87.36 -71.63 -75.80 -68.31 134.69 58.97 -35.87 -49.72 15(P) -96.95 -78.84 -75.71 -78.03 4.07 2.17 -33.25 -25.92 16(S) -83.07 -95.71 -63.62 -97.87 -28.27 -28.59 -38.35 126.57 17(T) -63.55 -65.43 -62.97 -68.03 -42.53 -41.88 -42.16 -38.34 18(W) -105.06 -91.96 -78.47 -94.14 122.89 -83.40 109.64 99.64
Table 6: Frequency of occurrence of the protein segments defined by our alphabet in four main SCOP classes
All alpha All beta alpha/beta alpha+beta Letter Count Percentage Count Percentage Count Percentage Count Percentage
A 54859 2.95 255473 8.83 278238 5.46 161041 6.07 R 91363 4.92 148361 5.13 270345 5.31 145619 5.49 N 76176 4.10 309834 10.71 340682 6.69 202555 7.64 D 21055 1.13 127159 4.39 112078 2.20 66959 2.53 C 34856 1.88 172334 5.96 193952 3.81 102632 3.87 Q 102444 5.51 111333 3.85 271893 5.34 138081 5.21 E 58672 3.16 782607 27.06 620717 12.18 427778 16.14 G 42350 2.28 72105 2.49 147390 2.89 76968 2.90 H 39017 2.10 115542 3.99 163319 3.21 89203 3.37 I 3547 0.19 6607 0.23 9449 0.19 5739 0.22 L 49312 2.65 40909 1.41 141605 2.78 65856 2.48 K 43582 2.35 58687 2.04 146869 2.88 70549 2.66 M 16727 0.90 127070 4.39 110318 2.17 67912 2.56 F 70718 3.81 89366 3.09 179145 3.52 91702 3.46 P 104364 5.62 54939 1.91 192654 3.78 87149 3.29 S 76080 4.10 83725 2.89 173935 3.41 91160 3.44 T 937938 50.49 149259 5.17 1551585 30.46 651525 24.58 W 34533 1.86 186476 6.46 190001 3.72 108460 4.09 Total 1857593 100.00 2891786 100.00 5094175 100.00 2650888 100.00
The 3D conformation of the representative segment for each alphabet letter
Figure 1
The 3D conformation of the representative segment for each alphabet letter. Alpha Helix type:
Beta Sheet type:
Superimposition of protein segments in the 18 clusters
Figure 2
Superimposition of protein segments in the 18 clusters.
A R N D C Q
E G H I L K
derived from SCOP-1.65, Vorolign server only scans SCOP40-1.69), these tools were not used in the compari-sons. The results showed that SA-FAST outperformed the other two BLAST-based search tools (i.e. 3D-BLAST and PSI-BLAST) and another structure search tool that describes structures as 1D sequences (YAKUSA) in both predictive accuracy and precision (Table 8). Additionally, SA-FAST was comparably accurate and precise as the struc-tural alignment tools MAMMOTH and CE. Regarding search time (using one Intel Pentium 2.8 GHz processor and 512 Mbytes of memory), Table 8 clearly indicates that SA-FAST was far more efficient than were the structural alignment tools MAMMOTH and CE.
To further evaluate the predictive validity of our alphabet, we examined pairwise alignment of difficult cases based on the number of residues aligned and the superposition root mean square deviation (RMSD). To avoid alignment process bias and to maintain consistency in our analysis of various structural alphabets, we applied the same FASTA-based alignment algorithm [27] in the alignment tests. We tested the alphabets and substitution matrices used in PBE-align, 3D-BLAST, and SA-FAST on ten diffi-cult cases of previously studied pairwise alignments and compared the results with those produced using VAST, DALI, CE, and FATCAT [8,36]. Based on the alignments obtained using different alphabets and matrices, we used VMD [37] to calculate the superposition RMSD for PBE-align, 3D-BLAST, and SA-FAST. Table 9 shows that our alphabet had the lowest average RMSD per aligned resi-due among the three structural alphabets in the ten diffi-cult alignment tests. Figure 5 shows four superimposition examples based on our structural alphabet.
Local structure conservation in putative active sites can reflect biological meaning and these types of structural patterns can be used to predict protein function [19], e.g., the binding sites for metal-binding proteins [38]. Con-served local structural features can be identified in various ways and described using different representations. Because of the aforementioned advantages to 1D repre-sentation, we wanted to evaluate the feasibility of describ-ing structural domains/sub-domains usdescrib-ing our structural alphabet. Because there is no motif finding tool specifi-cally designed for protein structural alphabets, we applied the motif finding programs available to evaluate the feasi-bility of using structural alphabets to characterize local structure features. Currently, we use the motif finding pro-gram, MEME [39] to identify common structural motifs in protein families. We tested our method on a well-known protein family, the epidermal growth factor (EGF)/EGF-like family. Based on the information published in litera-ture or recorded in databases, we could verify whether the protein domains/sub-domains in EGF/EGF-like proteins could be described accurately using structural alphabets. EGF domains comprise extracellular protein modules described by 30–40 amino acids primarily stabilized by three disulfide bonds. Homologies and functional data suggest that these domains share some common func-tional features. If we number the cysteine residues as Cys1 to Cys6, where Cys1 is the closest to the N-terminus, the regularity of cysteine spacing defines three regions: A, B, and C. Based on the conservation in sequence and length of these regions, the homologies have been classified into three different categories [40]. We first described the 227 proteins in the EGF-type module family of SCOP 1.69 using our alphabet and the alphabets of Yang & Tung's [24] and de Brevern et al. [16,35]. We then used MEME to identify the common motifs corresponding to the A, B, and C sub-domains. According to InterPro [41], 24 of these proteins were exclusively of EGF Type-1, 74 were of
EGF-like Type-2, and 117 belonged to EGF-like Type-3 only.
We classified the remaining 12 proteins as Others. Sub-domain A was typically composed of five to six residues in Types 1 and 2, sub-domain B usually contained 10–11 residues in Type-1 but was consistently three residues shorter than in Type-2. Sub-domain C was conserved in length and contained four or five specific residues in Type-1 and Type-2 [40]. The sub-domains in EGF-like Type-3 were less conserved. A found motif was considered to cor-respond to a sub-domain if more than one-half of the res-idues in the sub-domain were included in the motif. If any single motif correctly corresponded to a sub-domain, we claimed that this sub-domain was recovered successfully (that is, a hit). The results of the motifs found are summa-rized in Table 10 and 11. They show that MEME was able to identify more EGF sub-domains using our structural alphabet than using the alphabets of Yang & Tung or de Brevern et al. One example of each EGF group is shown in
Example learning curve of matrix training
Figure 3
Example learning curve of matrix training. The
aver-age positive hit rate converged at 0.9153 with the learning rate set to 0.5.
˿˸˴̅́˼́˺ʳ˶̈̅̉˸
˃ˁˌ˄˅
˃ˁˌ˄ˇ
˃ˁˌ˄ˉ
˄ ˅ ˆ ˇ ˈ ˉ ˊ ˋ ˌ ˄˃ ˄˄ ˄˅
˼̇˸̅˴̇˼̂́
̃̂
̆˼
̇˼
̉˸
ʳ˻
˼̇
ʳ̅
˴̇
˸
The substitution matrix TRISUM-169
Figure 4
Table 7: SA-FAST versus 3D-BLAST and PSI-BLAST in SCOP structural function assignment accuracy for the SCOP-894 protein dataset
Class 894 proteins Accuracya (894 proteins) Accuracy (sequence identity <25%)
Number of queries SA-FAST 3D-BLAST PSI-BLAST SA-FAST 3D-BLAST PSI-BLAST
All alpha 161 99.27 94.41 94.41 95.83 75.00 66.67 All beta 199 95.12 94.47 93.97 87.32 77.55 73.33
α/β 292 97.58 97.26 91.44 95.68 87.88 65.77
α+β 242 95.13 94.63 88.84 93.81 83.33 60.87
aThe top-ranked family in the hit list of a query was used as the predicted family. Accuracy is the percentage of times that the family was correctly
predicted.
Table 8: Comparison between SA-FAST, 3D-BLAST, PSI-BLAST, YAKUSA, MAMMOTH, and CE on 50 proteins selected from SCOP95-1.69
Search tool Average time required for a query (sec) Relative to SA-FAST Accuracya (%) Average precisionb (%)
SA-FAST 1.15 1.00 96 90.80 3D-BLAST 1.30 1.13 94 85.20 PSI-BLAST 0.48 0.42 84 68.16 YAKUSA 8.88 7.72 90 74.86 MAMMOTH 1834.18 1594.94 100 94.01 CE 22053.32 19176.80 98 90.78
aThe top-ranked family in the hit list of a query was used as the predicted family. Accuracy is the percentage of times that the family was correctly
predicted.
bThe precision is defined as T/H, where T is the number of true hit structures in the hit list, and H is the total number of structures in the hit list.
Table 9: Results of ten difficult cases of pairwise alignment
Protein 1 Protein 2 VAST DALI CE FATCAT Yang & Tung's de Brevern et al.'s Our SA
1fxia 1ubq 48(2.10) 60(2.60) 64(3.80) 63(3.01) 59(2.76) 76(2.89) 58(2.64) 1ten 3hhrb 78(1.60) 86(1.90) 87(1.90) 87(1.90) 57(2.57) 73(2.31) 90(2.24) 3hlab 2rhe_ - 63(2.50) 85(3.50) 79(2.81) 54(2.65) 78(3.01) 79(2.87) 2azaa 1paz_ 74(2.20) 81(2.50) 85(2.90) 87(3.01) 70(2.34) 57(2.23) 87(2.40) 1cewi 1mola 71(1.9) 81(2.30) 69(1.90) 83(2.44) 52(2.37) 53(2.35) 61(1.83) 1cid_ 2rhe_ 85(2.20) 95(3.30) 94(2.70) 100(3.11) 54(2.75) 53(2.49) 55(2.08) 1crl_ 1ede - 211(3.40) 187(3.20) 269(3.55) 167(3.35) 120(3.47) 187(3.25) 2sim_ 1nsba 284(3.80) 286(3.80) 264(3.00) 286(3.07) 121(2.75) 121(2.96) 137(3.2) 1bgea 2gmfa 74(2.50) 98(3.50) 94(4.10) 100(3.19) 27(3.34) 77(2.8) 78(2.72) 1tie_ 4fgf_ 82(1.70) 108(2.00) 116(2.90) 117(3.05) 91(3.15) 62(3.45) 115(3.05) Average RMSD/aligned-residues 0.0226 0.0238 0.0261 0.0229 0.0373 0.0363 0.0278
The number of residues aligned and the RMSD (in parentheses) are shown. The last row displays the average RMSD per aligned residue. Except for PBE-align, 3D-BLAST, and SA-FAST, the results of the methods were adopted from [36].
Superimposition examples based on alignments identified by SA-FAST
Figure 5
Superimposition examples based on alignments identified by SA-FAST. (a) 1fxiA & 1ubq_ (b) 2azaA & 1paz_ (c)
1cewI & 1molA (d) 1cid_ & 2rhe.
(c) (d)
Table 10: Comparison between our structural alphabet (used in SA-FAST) and those of Yang & Tung (used in 3D-BLAST) and de Brevern et al. (converted by PBE-T, a facility associated with PBE-align) for describing motifs found by MEME within the EGF family
Our SA Yang & Tung's de Brevern et al.'s Sub-domain
Type A B C A B C A B C
EGF proteins No.
a Hitsb Covc Hits Cov Hits Cov Hits Cov Hits Cov Hits Cov Hits Cov Hits Cov Hits Cov
Type 1 24 23 95.8 22 91.7 23 95.8 11 45.8 21 87.5 19 79.2 18 75.0 14 58.3 18 75.0
Type 2 74 73 98.6 71 95.9 74 100.0 62 83.8 73 98.6 60 81.1 68 91.9 62 83.8 70 94.6
Type 3 117 116 99.1 106 90.6 61 52.1 54 46.2 102 87.2 25 21.4 109 93.2 112 95.7 48 41.0
Others 12 12 100.0 11 91.7 11 91.7 9 75.0 11 91.7 9 75.0 12 100.0 11 91.7 9 75.0
All 227 224 98.6 210 92.5 169 74.4 136 59.9 207 91.2 113 49.8 207 91.2 199 87.7 145 63.9 aThe number of EGF proteins of a specific type, bA hit for a sub-domain occurred when more than half of the sub-domain residues were contained
Figure 6, including the structures with highlighted sub-domains. Using our alphabet, MEME identified meaning-ful motifs that covered all three sub-domains in the EGF examples (Figure 6); however, using Yang & Tung's or de Brevern et al.'s alphabets, the motifs found covered only one or two sub-domains.
Discussion
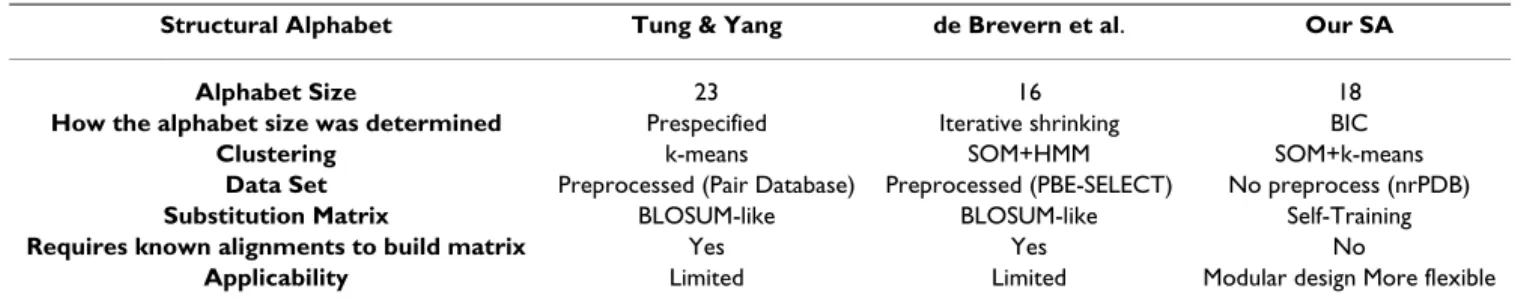
This study aimed to: (1) introduce a systematic and mod-ular pipeline for protein structural alphabet design, and (2) analyze the potential of our new alphabet to character-ize local protein properties. There are two features that distinguish our method from the others. First, we took a multi-strategy approach to structural alphabet design. The alphabet size was automatically and statistically deter-mined based on BIC and was visualized using a unified distance matrix (U-matrix). We did not pre-specify the alphabet size [24] or use an ad hoc procedure, such as iter-ative shrinking, to find the optimal size [15]. And, unlike other methods that use specialized databases, e.g. Pair Database [24] and PDB-SELECT [32,42], the protein structure data used to build the alphabet were obtained from the non-redundant PDB (nrPDB) database and were not pre-processed for any particular purpose, ensuring the generality of our alphabet. Second, we proposed a novel automatic matrix training framework to construct an appropriate substitution matrix for the alphabet. This training strategy did not need any information about known alignments, e.g. PALI [43], that most previous strategies have required. Using different training data and update rules, the self-training methodology can be applied to various alphabets. For example, instead of pro-tein classifications, we could consider RMSD in the update rules to tune the matrix. In Table 12, we summa-rize the properties of the structural alphabets and design methods evaluated in this study.
We demonstrated that our pipeline could produce a bio-logically meaningful structural alphabet. We compared
SA-FAST, a search tool based on FASTA combined with our alphabet and substitution matrix, with other search tools. The results showed that SA-FAST was very competi-tive in its prediccompeti-tive accuracy and alignment efficiency for database-scale searches. In addition, we compared our alphabet with others in difficult cases of pairwise align-ment. The number of residues aligned and the RMSD superpositions indicated that our structural alphabet was not only comparable to other alphabets but also per-formed competitively with structural alignment tools. We found several advantages to using a 1D structural alphabet. First, 1D representations of protein structures are easier to compare and more economical to store. Sec-ond, previously designed and widely used 1D sequence alignment tools can be applied directly to protein struc-ture and sequence analysis. Third, 1D-based approaches can serve as pre-processors to filter out irrelevant proteins prior to the application of more computationally inten-sive structural analysis tools.
Conclusion
These results are encouraging and we can extend this work in several directions. Firstly, we can use more complete datasets for substitution matrix training to increase the sensitivity and selectivity of future database searches. Sec-ondly, we can combine other alignment tools, in addition to FASTA, with our substitution matrix and evaluate the performance of these different combinations. Thirdly, to increase the performance of MEME in structural motif detection, we could modify MEME or develop a new motif-finding tool specifically for our structural alphabet. MEME was originally designed to find motifs in amino acid and nucleic acid sequences. Currently, we use MEME to detect protein motifs and we have demonstrated that it can recover some of the structural sub-domains described by our structural alphabet. Finally, several structural alphabets have been developed based on different protein structural characteristics. It would be worthwhile to
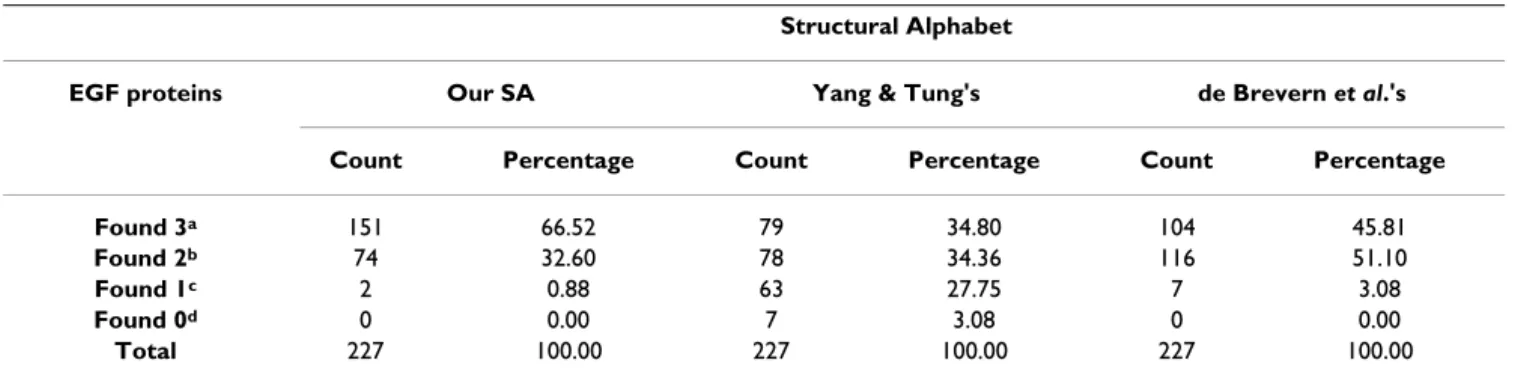
con-Table 11: Statistical analysis of EGF(EGF-like) proteins whose sub-domains were detected by MEME Structural Alphabet
EGF proteins Our SA Yang & Tung's de Brevern et al.'s
Count Percentage Count Percentage Count Percentage
Found 3a 151 66.52 79 34.80 104 45.81
Found 2b 74 32.60 78 34.36 116 51.10
Found 1c 2 0.88 63 27.75 7 3.08
Found 0d 0 0.00 7 3.08 0 0.00
Total 227 100.00 227 100.00 227 100.00
aEGF (EGF-like) proteins in which all three sub-domains (A, B and C) were found by MEME, bEGF (EGF-like) proteins in which two of the three
sub-domains were found by MEME, cEGF (EGF-like) proteins in which only one sub-domain was found by MEME, dEGF (EGF-like) proteins in which
Examples of structural motifs corresponding to EGF sub-domains
Figure 6
Examples of structural motifs corresponding to EGF sub-domains. We colored the sub-domains A, B, and C in blue,
green, and red, respectively. The motifs that corresponded to EGF sub-domains, using our structural alphabet and those of Yang & Tung and de Brevern et al., were also highlighted in blue, green, and red. The overlapping region between motifs was colored purple. In the sequence view, the first three sequences are EGF protein represented by our structural alphabet, the alphabet of Yang & Tung, and the alphabet of de Brevern et al., respectively. The fourth is the amino acid sequence with the cysteines highlighted in orange. The sub-domains are marked at the bottom.
d1epj (EGF TYPE I) Protein
Structure
Ours Yang & Tung’s de Brevern
et al.’s
Sequence View
NNMEDHARQLKGHFRQKGHEMCWHARCGHEEARLKGMRQLKGSSFKEMADHPQ --KXNKTIXXVQMPMSPFKHTNKQTVRHXTKKKZLCXXVZ SQMQNNVQVDN----CAHGNESFMSGNMFKKGDCRSGNERKGDDNSFMIEM SMMSPKQRHCAIP--NSYPGCPSSYDGYCLNGGVCMHIESLDSYTCNCVIGYSGDRCQTRDLRWWELR
AAAAA BBBBBBBBBB CCCCCCCC
|____||__________| |________|
d1ixa (EGF-like TYPE II)
PPWPCPLKFCWMDQSWNEARQTSWNEEEMADHFDQKGHC --RXMRVSPXPMSQNFHFHTWLTFFFHKTLQNZTLSQ-- --KMRNLAMLCEHSLKQDNRMMKKQDDDCAHCAIPKM-- VDGDQCESNPCLNGGSCKDDINSYECWCPFGFEGKNCEL AAAAA BBBBBBBB CCCCCCCC
|_____||_______| |________|
d1emn 2 (EGF-like TYPE III)
STPQPSWFMKGTSWNEACMKDHNEACWFRCPTQSPPSWN --MGGWTPQSVISKHKXKVZSKHEHXTIQTHFKWITX-- --MMMKKQEAMPKKQDNREMIGQDNREQSPMMMMMMK-- TDECSVGNPCGNGTCKNVIGGFECTCEEGFEPGPMMTCE
AAAABBBBBBBB CCCCCCCCCCC
|___||________| |___________|
d1p9ja (Others)
NNEEEEEEACQPQPSNMDDHEEEEARQKGHEEEEEMADHNARQGSWNARQTSPP --NKNKKNKIRMQVLPMWSKNHKFEMLSQTHFEFKKMQPZTLSR XPFHXMBB----DDDDDDNRNLMMKKAHHGDDDDNRFMKGQDDDDCAHCASEAMKQQN RSMK--VVSHFNDCPLSHDGYCLHDGVCMYIEALDKYACNCVVGYIGERCQYRDLKWWEL
AAAAA BBBBBBBBBB CCCCCCCC
duct a thorough comparative study and evaluate the feasi-bility of combining different alphabets. The combination of complementary structural alphabets would increase their overall applicability and characterize 3D protein structures more completely.
Methods
The use of frequent local structural motifs embedded in a polypeptide backbone has recently been shown to improve protein structure prediction [1,22]. The success of this strategy has paved the way for further studies of structural alphabets and has enabled the application of standard 1D sequence alignment methods to 3D protein structural searches. In this study, we combined several computational methods into a new approach to the design of a protein structural alphabet. We then devel-oped an automatic matrix training framework that could generate appropriate substitution matrices for new alpha-bets when applied in standard 1D sequence alignment methods, such as FASTA [27].
Structural alphabet design
We used proteins from the nrPDB [44] in our study with the aim of building a structural alphabet suitable for all proteins. The same approach could easily be applied to other databanks as well. We transformed each protein backbone into a series of dihedral angles (ϕ and ψ, neglecting ω) [15,22]. Following de Brevern et al. [15], our analysis was limited to fragments of five residues because this number of residues is sufficient for describing a short
α helix and a minimal β structure. Fixing the window size
at five residues, we applied a sliding-window approach to each protein sequence in nrPDB and gathered 20,953,584 fragment vectors. Each protein fragment, associated with
α-carbons Cα(i-2), Cα(i-1), Cα(i), Cα(i+1), and Cα(i+2), was
rep-resented by a vector of eight dihedral angles [ψi-2, ϕi-1, ψ
i-1, ϕi, ψi, ϕi+1, ψi+1, ϕi+2] Unlike previous works that directly applied SOMs to obtain clusters of backbone fragments as the basis of the structural alphabet [28], in our approach the SOM was only part of the process that determined the number of letters required for the alphabet. We did not build our alphabet directly from the clusters found by SOM.
The U-matrix is one of the most widely used methods for visualizing the clustering results of the SOM. The U-matrix shows the distances between neighboring reference vec-tors and can be visualized efficiently using the greyscale [45]. We conducted a post-process on the U-matrix using a minimum spanning tree algorithm. Based on the grey levels in the U-matrix, all of the map units were linked in the minimum spanning tree. Given a threshold θ
deter-mined by BIC, we partitioned the entire tree into several disconnected subtrees by removing the links between map units with grey levels below θ.
Let S = {si | i = 1...M} be the set of map units we wished to cluster. Each map unit si is associated with a collection of
input data points, , mapped to the
map unit si. Let Ck = {ci | i = 1...k} be the clustering of map units S with k clusters. We modeled each cluster ci as a multivariate Gaussian distribution N(μi, Σi), where μi and Σi were estimated as the sample mean and the sample cov-ariance from Xi, respectively. The number of parameters for each cluster was thus , where d = 8 in our case. We defined BIC(Ck) as:
where and λ, the penalty weight, was set to 1.
We chose the threshold θ that maximized BIC(Ck). For example, for an SOM with 200 × 200 map units, the threshold θ that maximized BIC(Ck) was 21. The number of subtrees becomes the structural alphabet size. Because the SOM can be viewed as a topology preserving mapping from input space onto the 2D grid of map units, the number of map units can affect the clustering result. We systematically varied the number of units and repeated the above process. We selected the most frequent number of clusters as the alphabet size. After a series of systematic tests, we found that 18 was the most frequent number of
Xi ={xij|j=1... }ni d+12d d( +1) BIC Ck ni i d d d k N i k ( )= {− log ∑ }− ( + ( + )) log =
∑
1 2 12 12 1 1 λ N ni i k =∑
=1Table 12: Summary of properties of structural alphabets and alphabet designs
Structural Alphabet Tung & Yang de Brevern et al. Our SA
Alphabet Size 23 16 18
How the alphabet size was determined Prespecified Iterative shrinking BIC
Clustering k-means SOM+HMM SOM+k-means
Data Set Preprocessed (Pair Database) Preprocessed (PBE-SELECT) No preprocess (nrPDB)
Substitution Matrix BLOSUM-like BLOSUM-like Self-Training
Requires known alignments to build matrix Yes Yes No
clusters; therefore, 18 letters became size of our structural alphabet.
Rather than adopt the two-level approach that first trains the SOM then performs clustering on the trained SOM after determining the alphabet size [28], we applied the k-means algorithm to the input data vectors directly to obtain the clusters. The SOM established a local order among the set of reference vectors such that the closeness between two reference vectors in the Rd space was depend-ent on how close the corresponding map units were in the 2D array. Nevertheless, an inductive bias of this kind might not be appropriate for structural alphabets since the local order does not always faithfully characterize the rela-tionship between structural building blocks and can
sometimes be misleading. For example, forcing the topol-ogy to preserve mapping from the input space of α-helix and β-strand to a 2D grid of units could be harmful to clustering. Therefore, we used the SOM only to visualize the alphabet size and relied on the k-means algorithm to extract the local features directly from the input data that actually reflected the characteristics of the clusters. The centroid of each cluster forms the prototypical representa-tion of each alphabet letter. We performed k-means clus-tering 50 times, starting with different random seeds, all using k = 18. We computed the Euclidean distances from each fragment in each cluster to its centroid as the intra-cluster distance; we also calculated the centroid-to-cen-troid distance. We kept the clustering result that had the minimum ratio of the average intra-cluster distance to the centroid-to-centroid distance. Given this result as the basis for the structural alphabet, we could transform a protein into a series of alphabet letters by matching each of its fragments against our alphabet prototypes.
Automatic substitution matrix training
The substitution matrix used to align proteins represented by structural alphabets affects the alignment accuracy. The matrix is a crucial factor in the success of applying a 1D sequence alignment tool to search for similar 3D struc-tures. The simplest matrix that can be used is the identity matrix. Some authors have applied an HMM approach to define the matrix [33], while others have adopted approaches similar to the development of BLOSUM matrices [24,31,45]. The identity matrix ignores possible acceptable alphabet letter substitutions, significantly lim-iting its applicability. The BLOSUM-like approach requires alignments of homologous proteins before calcu-lating the log-odd ratios as the entries in the matrix; how-ever, reliably aligned protein blocks might not always be available for log-odd ratio estimation. To avoid these drawbacks, we trained the substitution matrix without using the known blocks of protein alignments. This matrix training procedure can be applied regardless of how the alphabet is derived.
There are three components in the matrix training frame-work: an alignment tool with a substitution matrix, train-ing data, and a matrix trainer. We used FASTA as the alignment tool and the non-redundant proteins in SCOP1.69 with sequence similarity less than 40%, exclud-ing the families with less than five proteins and those pro-teins used for validation, as the training dataset. Note that the training dataset was only 9.62% of the entire SCOP1.69. The test data we used in the later experiments (see Results section) did not overlap with our training examples. We started by using the identity matrix as the initial substitution matrix where the score for a match was 1, and for a mismatch, 0. Each protein in the training data-set was iterated as a query for FASTA to search the rest of
System architecture of the matrix training framework
Figure 7
System architecture of the matrix training frame-work.
the dataset for similar proteins. If a protein returned by FASTA belonged to the same family as the query, we con-sidered the case a positive hit; otherwise it was a negative hit. Those proteins not returned by FASTA but in the same family as the query were considered misses. We gathered the alignments of all positive hits and misses and com-puted the log-odd ratios to build the positive matrix based on the alignments. Similarly, we constructed the negative
matrix using the alignments of negative hits, The matrix
trainer updated the current substitution matrix S(t) to S(t+1)
as follows:
S(t+1) = S(t) + M
M = [Wp·(P - S(t)) - Wn·(N - S(t))]·τ
Wp = (|positive_hits| + |misses|)/|taining_data|
Wn = |negative_hits|/|training_data|
where P and N are the positive and the negative matrix, respectively, τ is the learning rate (similar to the learning
rate in neural networks), and Wp and Wn are the weights. The weights were defined as the proportion of the total number of positive hits and misses to the training data size and the ratio of the number of negative hits to the training data size, respectively. We repeated the update process to train the substitution matrix until there were no changes in the matrix, that is, the number of both the pos-itive and the negative hits remained constant. This con-verged matrix was the final substitution matrix that we combined with FASTA to become a new alignment tool named SA-FAST. SA-FAST was used to demonstrate the applicability of our new alphabet and matrix. The training framework appears in Figure 7.
Authors' contributions
S–YK implemented the structural alphabet design pipe-line and conducted the experiments. Y–JH designed the BIC procedure, the matrix training framework and experi-ments, and supervised this study. Both authors read and approved the final manuscript.
Acknowledgements
Thanks go to Jinn-Moon Yang and Chi-Hua Tung for their assistance in using 3D-BLAST. This work was supported in part by National Science Council, Taiwan (NSC 96-2221-E-009-042; 96-2627-B-009-003) and Institute of Sta-tistics, Academia Sinica, Taiwan.
References
1. Baker D, Sali A: Protein Structure Prediction and Structural
Genomics. Science 2001, 294:93-96.
2. Orengo CA, Bray JE, Hubbard T, LoConte L, Sillitoe I: Analysis and
assessment of ab initio three-dimensional prediction, sec-ondary structure, and contacts prediction. Protein 1999, 3:149-170.
3. Liu Y, Beveridge DL: Exploratory studies of ab initio protein
structure prediction: Multiple copy simulated annealing,
AMBER energy functions, and a generalized born/solvent accessibility solvation model. Proteins 2002, 46:128-146.
4. Shindyalo IN, Bourne PE: Protein structure alignment by
incre-mental combinatorial extension (CE) of the optimal path.
Protein Eng 1998, 11:739-747.
5. Holm L, Sander C: Protein structure comparison by alignment
distance matrices. J Mol Biol 1993, 233:123-138.
6. Madej T, Gibrat JF, Bryant SH: Threading a database of protein
cores. Proteins: Structure, Function and Bioinformatics 1995, 23:356-369.
7. Ortiz AR, Strauss CE, Olmea O: MAMMOTH (Matching
molec-ular models obtained from Theory): an automated method for model comparison. Protein Science 2002, 11:2606-2622.
8. Ye Y, Godzik A: Flexible structure alignment by chaining
aligned fragment pairs allowing twists. Bioinformatics 2003, 19 Suppl 2:ii246-255.
9. Birzele F, Gewehr JE, Csaba G, Zimmer R: Vorolign-fast structural
alignment using Voronoi contacts. Bioinformatics 2007, 23:e205-211.
10. Garnier J, Osguthorpe D, Bobson B: Analysis of the accuracy and
implications of simple methods for predicting the secondary structure of globular protein. J Molecular Biology 1978, 120:97-120.
11. Petersen TN, Lundegaard C, Nielsen M, Bohr H, Bohr J, Brunak S, Gippert GP, Lund O: Prediction of protein secondary structure
at 80% accuracy. Proteins 2000, 41:17-20.
12. Rost B: Review: Protein secondary structure prediction
con-tinues to rise. J Structural Biology 2001, 134:204-218.
13. Pollastri G, Martin AJM, Mooney C, Vullo A: Accurate prediction
of protein secondary structure and solvent accessibility by consensus combiners of sequence and structure informa-tion. BMC Bioinformatics 2007, 8:201-212.
14. Sander O, Sommer I, Lengauer T: Local protein structure
predic-tion using discriminative models. BMC Bioinformatics 2006, 7:14.
15. de Brevern AG, Etchebest C, Hazout S: Bayesian probabilistic
approach for predicting backbone structures in terms of pro-tein blocks. Propro-teins 2000, 41:271-287.
16. de Brevern AG, Valadie H, Hazout SA, Etchebest C: Extension of a
local backbone description using a structural alphabet: A new approach to the sequence-structure relationship. Protein
Science 2002, 11:2871-2886.
17. de Brevern AG: New assessment of a structural alphabet. In Silico Biol 2005, 5(3):283-9.
18. Benros C, de Brevern AG, Etchebest C, Hazout S: Assessing a
novel approach for predicting local 3D protein structures from sequence. Proteins 2006, 62(4):865-880.
19. Unger R, Harel D, Wherland S, Sussman JL: A 3D building blocks
approach to analyzing and predicting structure of proteins.
Proteins 1989, 5:355-373.
20. Schuchhardt J, Schneider G, Reichelt J, Schomburg D, Wrede P:
Local structural motifs of protein backbones are classified by self-organizing neural networks. Protein Engineering 1996, 9:833-842.
21. Fetrow JS, Palumbo MJ, Berg G: Patterns, structures, and amino
acid frequencies in structural building blocks, a protein sec-ondary structure classification scheme. Proteins 1997, 27:249-271.
22. Bystroff C, Baker D: Prediction of local structure in proteins
using a library of sequence-structure motif. J Molecular Biology
1998, 281:565-577.
23. Camproux AC, Tuffery P, Chevrolat JP, Boisvieux JF, Hazout S:
Hid-den Markov model approach for iHid-dentifying the modular framework of the protein backbone. Protein Eng 1999, 12:1063-1073.
24. Yang JM, Tung CH: Protein structure databases search and
evolutionary classification. Nucleic Acids Research 2006, 34:3646-3659.
25. Offmann B, Tyagi M, de Brevern AG: Local Protein Structures. Current Bioinformatics 2007, 2:165-202.
26. Hartigan JA, Wong MA: A k-means clustering algorithm. Applied Statistics 1975, 28:100-108.
27. Pearson WR: Flexible sequence similarity searching with the
FASTA3 program package. Methods Mol Biol 2000, 132:185-219.
28. Vesanto J, Alhoniemi E: Cluster of the self-organizing map. IEEE trans Neural Networks 2000, 11:586-600.
30. Andreeva A, Howorth D, Brenner SE, Hubbard TJP, Chothia C, Mur-zin AG: SCOP database in 2004: refinements integrate
struc-ture and sequence family data. Nucleic Acids Research 2004, 32:D226-229.
31. Henikoff S, Henikoff JG: Amino acid substitution matrices from
protein blocks. PNAS 1992, 89:10915-10919.
32. Zheng WM, Liu X: A protein structural alphabet and its
substi-tution matrix CLESUM. LNCS 2005, 3680:59-67.
33. Guyon F, Camproux AC, Hochez J, Tuffery P: SA-Search: a web
tool for protein structure mining based a structural alpha-bet. Nucleic Acids Res 2004, 32:W545-W548.
34. Carpentier M, Brouillet S, Pothier J: YAKUSA: a fast structural
database scanning method. Proteins: Structure, Function and
Genet-ics 2005, 61:137-151.
35. Tyagi M, Sharma P, Swamy CS, Cadet F, Srinivasan N, de Brevern AG, Offmann B: Protein Block Expert (PBE): a web-based protein
structure analysis server using structural alphabet. Nucleic
Acids Research 2006, 34:W119-123.
36. Tyagi M, de Brevern AG, Srinivasan N, Offmann B: Protein
struc-ture mining using structural alphabet. Proteins: strucstruc-ture, function
and bioinformatics 2007 in press.
37. Humphrey W, Dalke A, Schulten K: VMD – Visual Molecular
Dynamics. Journal of Molecular Graphics 1996, 14:33-38.
38. Dudev M, Lim C: Discovering structural motifs using a
struc-tural alphabet: Applications to magnesium-binding sites.
BMC Bioinformtics 2007, 8:106.
39. Bailey TL, Elkan C: Unsupervised learning of multiple motifs in
biopolymers using EM. Machine Learning 1995, 21:51-80.
40. Appella E, Weber IT, Blasi F: Structure and function of
epider-mal growth factor-like regions in proteins. FEBS Letters 1988, 231:1-4.
41. Mulder NJ, Apweiler R, Attwood TK, Bairoch A, Bateman A, Binns D, Bork P, Buillard V, Cerutti L, Copley R, Courcelle E, Das U, Daugh-erty L, Dibley M, Finn R, Fleischmann W, Gough J, Haft D, Hulo N, Hunter S, Kahn D, Kanapin A, Kejariwal A, Labarga A, Langendijk-Genevaux PS, Lonsdale D, Lopez R, Letunic I, Madera M, Maslen J, McAnulla C, McDowall J, Mistry J, Mitchell A, Nikolskaya AN, Orchard S, Orengo C, Petryszak R, Selengut JD, Sigrist CJA, Thomas PD, Valentin F, Wilson D, Wu CH, Yeats C: New developments in
the InterPro database. Nucleic Acids Research 2007, 35:D224-228.
42. Hobohm U, Sander C: Enlarged representatives set of protein
structures. Protein Science 1994, 3:522-524.
43. Gowri VS, Pandit SB, Karthik PS, Srinivasan N, Balaji S: Integration
of related sequences with protein three-dimensional struc-tural families in an updated Version of PALI database. Nucleic
Acids Research 2003, 31:486-488.
44. Berman HM, Westbrook J, Feng Z, Gilliland G, Bhat TN, Weissig H, Shindyalov IN, Bourne PE: The Protein Data Bank. Nucleic Acids Research 2000, 28:235-242.
45. Tyagi M, Gowri VS, Srinivasan N, de Brevern AG, Offmann B: A
sub-stitution matrix for structural alphabet based on structural alignment of homologous proteins and its applications.