A generic index of diatom assemblages as bioindicator of
pollution in the Keelung River of Taiwan
Jiunn-Tzong Wu
Institute of Botany, Academia Sinica, Taipei 11529, Taiwan & Department of Botany, National Taiwan University, Taipei 10764, Taiwan. Fax: [+886]-2-27827954. E-mail: jtwu@gate.sinica.edu.tw
Received 26 May 1998; in revised form 29 January 1999; accepted 14 February 1999
Key words: bioindicator, diatom, generic index, pollution, river, water quality
Abstract
The Keelung River (Taiwan) is heavily polluted by domestic, industrial and agricultural wastes. Water quality, particularly in ammonium, nitrite, silicate, and turbidity, negatively correlated with dissolved oxygen. A generic index (GI) – the ratio of abundance of Achnanthes, Cocconeis and Cymbella, to that of Cyclotella, Melosira and
Nitzschia – was used to measure changes the diatom assemblages. GI values correlated well the saprobic index,
diatom assemblage index, composite river water quality index and species richness of insects. It correlated less well with the trophic diatom index and distribution of fish in the river, suggesting that GI was more indicative of organic pollution than of eutrophication. Data from two of other Taiwanese rivers were used to test the applicability of GI. As in the Keelung River, GI correlated well with the saprobity index, diatom assemblage index and river water quality index.
Abbreviations: BOD5– biochemical oxygen demand measured over 5 days; COD – chemical oxygen demand;
DAIPo – diatom assemblage index for organic pollution; DO – dissolved oxygen; GI – generic index; SI – saprobity index; TDI – trophic diatom index; TP – total phosphorus; WQI – river water quality index
Introduction
Aquatic algae are sensitive to pollution or other events, and are therefore commonly used for monitoring en-vironmental contamination. To monitor changes in the environment, many methods have been used (Whit-ton et al., 1991; Whit(Whit-ton & Rott, 1995; Prygiel & Coste, 1996). However, due to differences in spe-cies distribution, not a single one can be applied universally.
Diatoms can provide valuable information for monitoring rivers, particularly on organic pollution (Sládeˇcek, 1986). A variety of indices use diatoms as bioindicators. They include the Descy index (Descy, 1979), specific pollution sensitivity index (PSI) (Coste in Cemagref, 1982), saprobity index (SI) (Sládeˇcek, 1986), generic diatom index (GDI) (Coste & Ayphas-sorho, 1991), Commision for Economical Community index (CEC) (Descy & Coste, 1991), overall practical
index (Lenoir & Coste, 1996), diatom assemblage in-dex for organic pollution (DAIpo) (Watanabe et al., 1983) and trophic diatom index (Kelly & Whitton, 1995). But use of sophisticated diatom-based indices is restricted to those institutions where diatom identi-fication is possible. A relatively large number of taxa is involved, and few people have the required taxonomic expertise, particularly where keys for identification are unavailable. Furthermore, certain methods developed for a specific region cannot be used in other regions.
In Taiwan, about two-thirds of the rivers are mod-erately or seriously polluted. Diatoms have been used to monitor river pollution (Wu & Suen, 1985; Wu, 1986). However, information and background data for local diatom taxa are poor. In addition, the ecological characteristics of indicator species and the uniqueness of each stream are not well documented. A prelim-inary study in the Keelung River in northern Taiwan has shown that the ratios of Achnanthes, Cocconeis,
80
and Cymbella, to Cyclotella, Melosira and Nitzschia correlated well with degree of pollution. In the present study, the relationship between this ratio and other variables is further characterized, in an attempt to de-velop a simple yet convenient index for monitoring river pollution.
Materials and methods
Keelung River
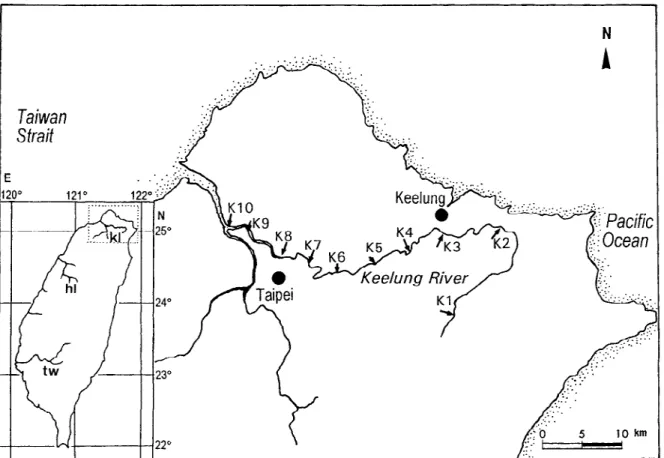
It is a tributary of the Tansui River, north and northeast Taiwan (Figure 1). It originates from Mt. Chintung and flows through densely populated cities, including the Keelung and Taipei metropolitan areas, to eventually meet the Tansui River at Kuantu. It is 83.2 km long and has a basin area of 501 km2. It is one of the most heav-ily polluted rivers in Taiwan. About one fifth of this river is so heavily polluted downstream that dissolved oxygen is close to zero. The main pollution is organic wastewater from domestic and factory discharges. It is only slightly polluted by heavy metals.
Sampling, water analysis, and diatom analysis
The study was done at ten sites (K1–K10) along the river (Figure 1). Sampling was conducted seasonally from January 1996 to April 1997. Samples for diatom and water analyses were collected at the same time. During sampling, temperature, pH and conductivity of the water were measured. For analysis of other variables, samples were stored at 4 ◦C in darkness and transported to the laboratory. Eventually, water analysis was done within 4 h of sampling.
Both epilithic and planktonic diatoms were collec-ted at sites K1–K4. Epilithic diatoms were colleccollec-ted from five cobbles or boulders randomly sorted from the site with relatively slow current (0.2–1.0 m s−1) within the reach. A toothbrush was used to remove diatom films from an area of c. 25 cm2on cobbles or boulders that were free from filamentous algae. Fur-ther downstream, from K5 to K10, river water was too deep (>1 m) to collect epilithic diatoms. At these sites, planktonic diatoms were collected by a plank-ton net (mesh size 10 µm). The samples were fixed by Lugol’s iodine solution immediately after collec-tion and were cleaned with acid (acetic acid: sulfuric acid = 9:1) in the laboratory. After being washed with deionized water, samples were filtered on a cellulose nitrate membrane filter (pore size 0.45 µm, Sartorius,
Germany) or mounted on a slide with Naphrax (North-ern Biological Supplies Ltd., Ipswich, U.K.). Diatoms were observed and identified under phase contrast.
The taxa of diatoms were identified according to Cleve-Euler (1951–55), Patrick & Reimer (1966), Gerloff & Cholnoky (1970), Rabenhorst (1971), Krammer & Lange-Bertalot (1986–1991). The fre-quency of presence of each genus was calculated by counting 400 valves per sample. The saprobity in-dex (SI) of water was evaluated after Sládeˇcek (1986), employing the equation of Zelinka & Marvan (1961). The calculations of diatom community index (DAIpo) and trophic diatom index (TDI) were according to Watanabe et al. (1986) and Kelly & Whitton (1995), respectively. A generic index (GI) of the diatom as-semblages was calculated, using the ratio of total percentage abundance of Achnanthes, Cocconeis and
Cymbella, to that of Cyclotella, Melosira and Nitzs-chia in each sample.
The analysis of ammonium, nitrite, nitrate, phate, silicate, total organic nitrogen, total phos-phorus, biochemical and chemical oxygen demands, and dissolved oxygen followed the methods of APHA et al. (1992). Turbidity was measured by a tur-bidometer (Orbeco-Hellige, Farmingdale, New York). Variables including pH, turbidity, conductivity, the concentrations of ammonium, dissolved oxygen (DO), biochemical oxygen demand (BOD5), and total
phos-phorus (TP) were used for the calculation of a water quality index (WQI), calculated on a weighted average of variables, employing the modified model of House & Newsome (1988) by O-Yang (1990):
W QI = 0.1[6WiQi]1.5,
where Wi is the weight, and Qi the quality score of variable i.
Data were statistically analyzed, using the software Statistica (Microsoft Co., Oklahoma). Unweighted pair-group average (UPGMA) (Sneath & Sokal, 1973) and multiple r-square methods were used for cluster analysis and principal factor analysis, respectively. Datasets from two rivers: Houlong River (Wu, 1997) and Tsenwen River (Wu & Yang, 1996), located in the middle and southern Taiwan (cf. Figure 1) were used for the purpose of comparison.
Results
Physical chemical environment
Figure 1. Map of Taiwan, showing the localities of the Keelung River (kl), Houlung River (hl), Tsenwen River (tw), and the sampling sites
K1–K10 in the Keelung River.
Table 1. Physical chemical variables of water at different sampling sites (K1–K10) along the Keelung River
Variable K1 K2 K3 K4 K5 K6 K7 K8 K9 K10 BOD5(mg L−1) 1.0±0.2 1.9±0.5 5.9±1.4 7.5±3.9 8.2±2.0 8.8±2.5 10.5±3.4 12.8±5.2 8.2±2.5 9.1±2.4 COD (mg L−1) 3.6±1.6 4.2±1.9 13.7±3.9 13.0±2.9 19.0±2.2 24.7±3.8 31.7±3.2 35.6±3.6 28.5±6.6 28.6±6.8 NO−3–N (mg L−1) 0.6±0.2 0.8±0.2 2.0±0.3 2.0±0.2 1.7±0.4 1.1±0.4 1.4± 0.4 0.7±0.4 1.5±0.3 0.6±0.4 NO−2–N (mg L−1) 0.02±0.01 0.02±0.01 0.14±0.04 0.18±0.03 0.13±0.01 0.20±0.03 0.07±0.02 0.08±0.02 0.08±0.02 0.07±0.02 NH+4–N (mg L−1) 0.07±0.01 0.26±0.08 0.93±0.41 1.28±0.19 1.88±0.33 3.56±1.00 4.49±1.22 5.33±1.25 4.56±1.08 3.41±1.16 PO34−-P (mg L−1) 0.03±0.01 0.04±0.01 0.13±0.02 0.51±0.13 0.48±0.06 0.42±0.06 0.59±0.12 0.61±0.11 0.40±0.10 0.39±0.09 Total P (µg L−1) 48.2±23.0 89.5±11.1 245.0±48.4 721.3±150.8 827.2±115.0 757.5±172.3 881.3±149.6 870.2±149.0 690.7±190.7 788.5±268.4 SiO2(mg L−1) 5.86±1.05 4.99±0.75 5.74±1.13 6.18±1.29 6.19±1.17 6.77±2.04 5.97±1.03 8.25±2.06 5.40±2.13 5.47±1.76 DO (mg L−1) 8.8±0.3 8.4±0.5 7.8±0.5 7.0±0.3 4.7±0.8 3.2±1.3 1.4± 0.3 0.9±0.6 2.8±0.3 2.6±0.5 Turbidity (NTU) 2.4±1.6 6.1±2.2 7.2±2.8 7.9±1.8 10.6±3.9 12.8±4.6 18.1±4.6 18.1±4.6 13.6±2.5 13.1±2.6 Conductivity 133±11 215±18 247±19 350±50 284±19 369±58 337±37 497±124 12785±5705 16803±3899 (µS cm−1) pH 6.98±0.23 6.87±0.17 6.54±0.20 6.70±0.08 6.69±0.06 6.61±0.27 6.47±0.33 6.49±0.37 6.66±0.21 6.60±0.32 WQI 70±7 63±5 48±6 52±7 36±6 26±3 22±3 23±5 25±3 27±3
82
Table 2. Canonical correlation coefficients between physical chemical variables of water and generic index of diatoms at sampling sites of the
Keelung River measured during January 1996 and April 1997
COD DO NO−3-N NO−2-N NH+4-N PO34−-P TP SiO2 Turb. Cond. pH GI
BOD5 0.15 −0.42 −0.07 0.28 0.54 0.65 0.40 0.18 0.47 0.23 0.27 −0.31 COD − −0.58 0.08 −0.19 0.38 0.18 0.19 −0.11 0.42 0.46 −0.09 −0.43 DO − 0.08 −0.13 −0.83 −0.64 −0.75 −0.12 −0.57 −0.27 0.11 0.68 NO−3–N − 0.15 −0.30 −0.09 −0.11 −0.09 0.30 −0.08 −0.50 0.09 NO−2–N − 0.07 0.22 0.27 0.07 −0.09 −0.06 −0.15 −0.29 NH+4–N − 0.72 0.68 −0.02 0.59 0.19 0.21 −0.57 PO34−-P − 0.76 0.24 0.53 0.08 0.22 −0.43 TP − 0.49 0.42 0.00 0.12 −0.48 SiO2 − 0.17 −0.50 0.16 0.11 Turb. − 0.14 0.04 −0.24 Cond. − 0.11 −0.13 pH − 0.10
Note: BOD5: 5-day’s biochemical oxygen demand; COD: Chemical oxygen demand; DO: dissolved oxygen; TP: total phosphorus; Turb: turbidity;
Cond.: conductivity; GI: generic index of diatoms.
mountain region. The upstream water contained low concentrations of nutrients and was nearly saturated with dissolved oxygen (DO). As it flowed down-stream, from sites K1 to K8, a progressive change in BOD5, COD, turbidity, ammonium, nitrate, nitrite,
phosphate, total phosphorus (TP) and conductivity oc-curred (Table 1). DO was close to zero between K6 and K8. That condition was associated with an in-crease in ammonium, soluble P, and TP. A canonical correlation showed that DO, BOD5, ammonium,
sol-uble P, and TP were more closely correlated with each other than other variables (Table 2). This suggests that Keelung River is eutrophicated and organically polluted, particularly in its mid- and lowland-reaches. The water quality evaluated by WQI showed a drastic change upstream, from K1 to K5 (cf. Table 1). Between K6 and K8, WQI values were consistently lower than 30, indicating heavily polluted reaches. At K9 and K10, WQI values were slightly higher than K8, suggesting a slight amelioration in quality.
Characteristics of the diatom assemblages
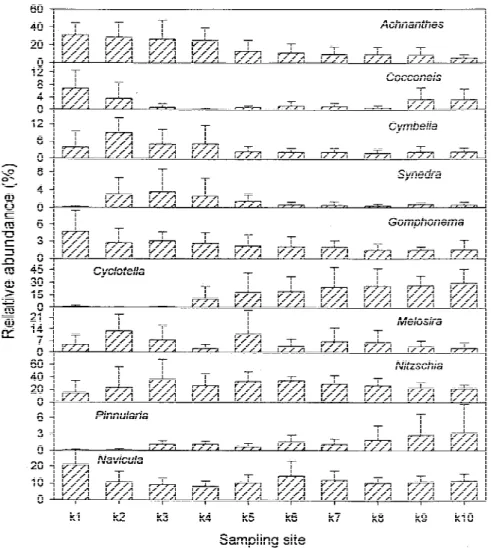
A total of 161 taxa, belonging to 30 genera were registered (Table 3). The composition of the as-semblages changed from one sampling site to an-other. Upstream, dominant genera were Achnanthes,
Cocconeis, Cymbella and Gomphonema. In the
mid-reaches, there was an increase in abundance of
Syn-edra, Melosira, Nitzschia and Pinnularia.
Down-stream, the dominant genera were Cyclotella and
Nitzschia. Figure 2 shows the change in ten
dom-Table 3. Diatom genera and number of taxa occurred in Keelung
River during the time of this study
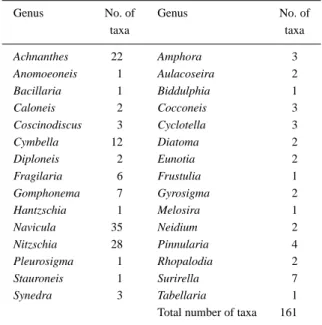
Genus No. of Genus No. of
taxa taxa Achnanthes 22 Amphora 3 Anomoeoneis 1 Aulacoseira 2 Bacillaria 1 Biddulphia 1 Caloneis 2 Cocconeis 3 Coscinodiscus 3 Cyclotella 3 Cymbella 12 Diatoma 2 Diploneis 2 Eunotia 2 Fragilaria 6 Frustulia 1 Gomphonema 7 Gyrosigma 2 Hantzschia 1 Melosira 1 Navicula 35 Neidium 2 Nitzschia 28 Pinnularia 4 Pleurosigma 1 Rhopalodia 2 Stauroneis 1 Surirella 7 Synedra 3 Tabellaria 1
Total number of taxa 161
inant genera along the river. Clustering analysis in-dicates that the genera contributing to the change in the assemblages followed the order: Nitzschia,
Cyc-lotella, Achnanthes, Navicula, Melosira, Cymbella, Cocconeis, Synedra, Pinnularia and Gomphonema
(Figure 3). The last three genera had a similar dis-tribution pattern and were relatively less abundant in the assemblages. These three genera were thus ex-cluded for the calculation of generic index. In the
Figure 2. Variations in the relative abundance of ten dominant genera of diatoms at different sampling sites (K1–K10) during the time of this
study.
Figure 3. Dendrogram based on the cluster analysis of the
abund-ance of ten dominant genera at sampling sites in Keelung River. ACH: Achnanthes; COC: Cocconeis; SYN: Synedra; GOM:
Gom-phonema; PIN: Pinnularia; CYM: Cymbella; MEL: Melosira; NAV: Navicula; CYC: Cyclotella; NIT: Nitzschia.
diatom assemblages, Navicula had the highest number of taxa (cf. Table 3). For the sake of simplicity and convenience, this genus was also not used either.
Indication of water pollution by diatoms
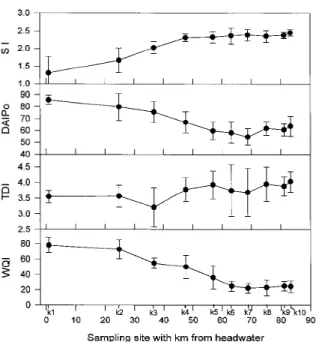
The headwater at site K1 was little polluted. The SI was lower than 1.5, an oligosaprobic level (Figure 4). From headwater to mid-reaches, from K1 to K5, SI increased, indicating a change from oligo- to β-mesosaprobity. Downstream between K6 and K10, SI values were usually higher than 2.5, a state of α-mesosaprobity. Increase in SI from up- to downstream of Keelung River was associated with a lowering index of DAIPo. The two indexes therefore were negat-ively correlated (Table 3). Both the DAIPo and WQI changed in a similar manner along the river.
84
Figure 4. Changes in the saprobity index (SI), diatom assemblage
index (DAIPo), trophic diatom index (TDI), and river water quality index (WQI) at different sampling sites along the Keelung River.
Figure 5. Changes in generic index of the diatoms at different
sampling sites along the Keelung River during different sampling times.
The values of TDI fluctuated from up- to down-stream. In the upstream, at site K1, TDI was high, indicating a slight eutrophication. In general, TDI val-ues were lower upstream and increased downstream, a phenomenon of eutrophication. However, there was a lowering in TDI at K3 and between K6 and K7, presumably a result of reduced input of domestic discharge at these sites.
Table 4. Correlation coefficients of generic index of diatoms (GI)
with saprobic index (SI), diatom assemblage index for organic pol-lution (DAIPo), trophic diatom index (TDI) and river water quality index (WQI) of the Keelung river
SI DAIPo TDI WQI
GI −0.60 0.36 −0.27 0.55
SI −0.51 0.31 −0.61
DAIPo 0.16 0.52
TDI −0.32
Generic index of the diatom assemblages
The ratio of abundance of genera that occurred more often in unpolluted environments (Achnanthes,
Coc-coneis and Cymbella) to those common in polluted
en-vironments (Cyclotella, Melosira and Nitzschia) was taken as the GI of the diatom assemblages. The value of this ratio closely correlated with water pollution. It was higher in less polluted reaches (i.e. upstream) and lower in polluted ones (Figure 5). The GI drastically declined from upstream to the mid-reaches, particu-larly between K1 and K5, and less between K6 and K10. The GI at a sampling site might fluctuate with season, due to variation in the species composition of the diatom assemblages. At K9 and K10, the diatom assemblages were composed of freshwater and marine water species. Here, GI values became incomparable to freshwater reaches.
Among variables of water analyzed, GI had a higher correlation with DO, ammonium, and TP than other variables (cf. Table 2). Nevertheless, changes in GI values were negatively correlated with SI, posit-ively with DAIPo and the WQI of river water, and less with TDI (Table 4).
The values of GI calculated on the basis of epilithic diatoms were compared with those of planktonic ones at sites K1–K4. Figure 6 shows that there was only a slight difference.
The variation of GI values in the Keelung River correlated well with the taxa richness of benthic macro-invertebrates (i.e. insects), but not well with that of fish. The maximum number of fish was found at K3, where river water was moderately polluted (Figure 7). In contrast, the highest value of GI and of species richness of insects was at K1. In the mid-reaches, from K3 to K6, a decline in the values of these three para-meters, nevertheless, agreed well with each other. At K8, neither insects nor fish were present.
Figure 6. Comparison of generic index calculated on the basis of
planktonic with epilithic diatoms at sampling sites K1 – K4 of the Keelung River.
Figure 7. Patterns of changes in the generic index of diatoms (GI),
numbers of species of insect and fish at different sampling sites along the Keelung River.
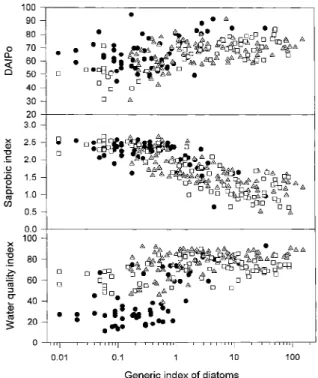
Data from the Tsenwen and Houlung Rivers were used to test the applicability of GI to other Taiwanese rivers. The values of GI, plotted against DAIPo, SI, and WQI (Figure 8), showed the relationship between GI and these three indices to be similar in all rivers. Apparently, GI is therefore widely applicable.
Discussion
For monitoring river pollution, the evaluation of wa-ter quality is usually based on composite variables
Figure 8. Correlation analysis of generic index of diatoms versus
diatom assemblage index (DAIPo), saprobity index, and river water quality index of the Keelung River (solid circle), Houlung River (open square), and Tsenwen River (triangular).
of the physical chemical environment (Ross, 1977). WQI is a composite index based on seven variables. It provides a basis with which diatom-based indices can be compared.
The GI values of diatom assemblages in the Kee-lung River positively correlated with WQI. The use of GI has the advantage that only identification to generic level is required, while the majority of con-ventional indices require identification to species. This obstructs their use, especially in regions where data on diatoms are unavailable, or where well-trained diatom taxonomists are scarce. Round (1993) suggested a re-striction in the number of taxa to be used. However, species identification is still unavoidable. Recently, Prygiel (1994) suggested an approach based on the generic level.
The generic diatom index (GDI) proposed by Rumeaux & Coste (1988) is also based on the generic composition of assemblages. The GI proposed in the present study characterizes water quality according to a ratio of only six dominant genera. This makes the use of indicator simple and convenient.
In the river, epilithic or planktonic assemblages can be different. This may give rise to a difference in GI
86
values. In the present study, a comparison between values of GI calculated on the basis of either sources was done at sites K1–K4. The results showed a differ-ence that was low. Thus it is likely that in the Keelung River, both epilithic and planktonic diatoms can be used as sources of GI calculation.
Among variables analyzed, GI had a higher cor-relation with DO, ammonium, and TP than with other variables. Nevertheless, changes in GI values closely correlated with the SI, DAIPo, and the WQI of river water, but not well with TDI. This suggests that GI seems to be more suitable for indicating organic pollution than eutrophication.
A test of the applicability of GI to other Taiwanese rivers has been done in the Tsenwen and Houlung Rivers. The results are satisfactory, because in both the relationship between GI and DAIPo, SI, and WQI were similar to that in the Keelung River. Apparently, the proposed GI is applicable to these two rivers. How-ever, in order to ascertain, whether GI is applicable to other regional countries, a further study should be done.
Acknowledgments
The author acknowledges grants from the Environ-ment Protection Administration of Taiwan (EPA-85-G03-03-20 & EPA-86-E3G1-09-13). The assistance of Miss Chia-Ming Su, data on water quality by Prof. J. G. Lin (Institute of Environmental Engineering, Na-tional Chiao Tung University), benthic invertebrates by Prof. P. S. Yang (Department of Plant Patho-logy, National Taiwan University), and fish by Mr. H. C. Wang (Institute of Environmental Analysis, En-vironmental Protection Administration, Taiwan) were highly appreciated.
References
American Public Health Associations (APHA), American Water Works Association and Water Pollution Control Federation, 1992. Standard Methods for the Examination of Water and Wastewater. 18th edn. APHA, Washington, D.C.
Cemagref, 1982. Etude des méthodes biologiques quantitatives d’appréciation de la qualité des eaux. Rapport Division Qualité des Eaux Lyon – Agence de l’Eau Rhône - Méditerranée - Corse, Pierre - Bénite, 28 pp.
Cleve-Euler, A., 1951–55. Die Diatomeen von Schweden und Finnland. Almqvist & Wiksells Boktryckeri AB, Stockholm. Coste, M. & H. Ayphassorho, 1991. Etude de la qualité des eaux
du Bassin Artois-Picardie à l’aide des communautés de diat-omées benthiques (Application des indices diatomiques) Rapport
Cemagref Bordeaux – Agence de l’Eau Artois-Picardie, Douai, 227 pp.
Descy, J. P., 1979. A new approach to water quality estimation using diatoms. Nova Hedwigia 64: 305-323.
Descy, J. P. & M. Coste, 1991. A test of methods for assessing water quality based on diatoms. Verh. int. Ver. Limnol. 24: 2112–2116. Gerloff, J. & B. J. Cholnoky, 1970. Diatomaceae II. J. Cramer
Verlag, Berlin, Stuttgart. 835 pp.
House, M. A. & D. H. Newsome, 1988. Water quality indices for the management of surface water quality. Wat. Sci. Technol. 21: 11–37.
Kelly, M. G. & B. A. Whitton, 1995. The trophic diatom index: a new index for monitoring eutrophication in rivers. J. Appl. Phycol. 7: 433–333.
Krammer, K. & H. Lange-Bertalot, 1986–1991. Bacillariophyceae. Süsswasserflora von Mitteleuropa. Band 2 (part 1–4). Gustav Fischer Verlag, Stuttgart.
Lenoir, A. & M. Coste, 1996. Development of a practical diatom index of overall water quality applicable to the French National Water Board Network. In: Whitton B. A. & E. Rott (eds), Use of Algae for Monitoring Rivers II. Inst. Bot, Univ. Innsbruck. 29–43.
O-Yang, C. H., 1990. Review of ranking criteria of water quality and pollution index for rivers. Tech. Rep., EPA Taiwan, EPA 79-003-10-021, 333 pp.
Patrick, R. & C. W. Reimer, 1966. The Diatoms of the United States. Monogr. Acad. Nat. Sci. Philadelphia, Philadelphia. 688 pp. Rabenhorst, L., 1971. Die Kielselalgen Deutschlands. Parat III.
Johnson Reprint Co., New York, London. 816 pp.
Prygiel, J., 1994. Comparaison de six indices diatomiques et deux indices invertébrés pour l’estimation de la qualité de l’eau de la rivière Sensée (France). Ecol. Mediterranea 20: 121–133. Prygiel, J. & M. Coste, 1996. Les diatomées et indices diatomiques
dans les réseaux de measure de la qualité des cours d’eau Franþais: Historique et Avenir. Bull. Fr. Piscic. 341/342: 65–79. Ross, S. L., 1977. An index system for classifying river water
quality. Wat. Poll. Control 76: 113–122.
Round, F. E., 1993. A review and methods for the use of epilithic diatoms for detecting and monitoring changes in river water qual-ity 1993. Methods for the Examination of Waters and Associated Materials. London, Her Majesty’s Stationary Office, 65 pp. Rumeau, A. & M. Coste, 1988. Initiation à la systématique des
diatomées d’eau douce pour l’utilisation pratique d’un indice diatomique générique. Bull. Fr. Piscic. 309: 1–69.
Sládeˇcek, V., 1986. Diatoms as indicators of organic pollution. Arch. Hydrochim. Hydrobiol. 14: 555–566.
Sneath, P. H. A. & R. R. Sokal, 1973. Numerical Taxonomy. San Francisco, W.H. Freeman & Co. 350 pp.
Watanabe, T., K. Asai & A. Houki, 1986. Numerical estimation to organic pollution of flowing water by using the epilithic di-atom assemblage – didi-atom assemblage index (DAIpo). Sci. Total Environ. 55: 209–218.
Whitton, B. A. & M. G. Kelly, 1995. Use of algae and other plants for monitoring rivers. Aust. J. Ecol. 20: 45–56.
Whitton, B. A. & E. Rott (eds), 1995. Use of Algae for Monitoring Rivers II. Inst. Bot., Univ. Innsbruck. 196 pp.
Whitton, B. A., E. Rott & G. Friedrich (eds), 1991.Use of Algae for Monitoring Rivers. Inst. Bot.,Univ. Innsbruck. 193 pp. Wu, J. T., 1986. Relation of change in river diatom assemblages to
water pollution. Bot. Bull. Acad. Sin. 27: 234–245.
Wu, J. T., 1997. Investigation on water resources and ecological changes: case study in Houlong River, Taiwan. Tech. Rep. SCOPE Taiwan. 86EC2A040049. 220 pp.
Wu, J. T. & W. C. Suen, 1985. Change of algal associations in relation to water pollution. Bot. Bull. Acad. Sin. 26: 203–212. Wu, J. T. & M. J. Yang, 1996. Study on the relation of algae to
the water quality in Tsenwen River (III). In: Chou, C. H. (ed.),
Study on Environmental Changes and Resource Management: Tsenwen River. Acad. Sin. 197–218.
Zelinka, M. & P. Marvan, 1961. Zur Präzisierung der biologis-chen Klassifikation der Reinheit fliessender Gewässer. Arch. Hydrobiol. 57: 389–407.