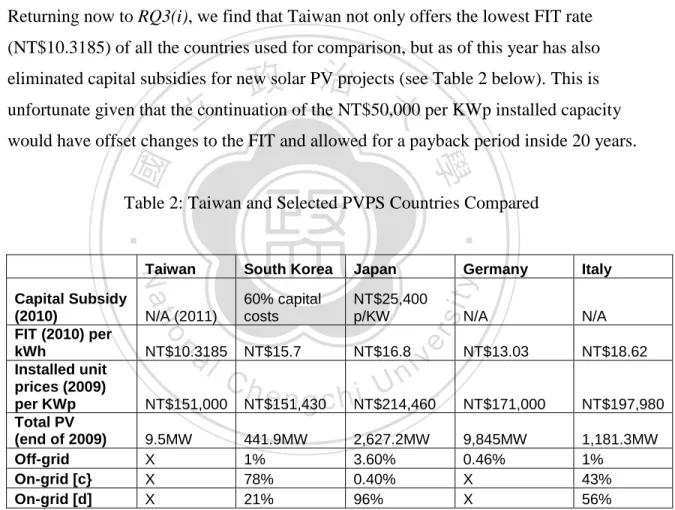
台灣的住戶太陽能市場: 障礙, 解決辦法與發展遠景 - 政大學術集成
89
0
0
全文
(2) 台灣的住戶太陽能市場: 障礙, 解決辦法與發展遠景 Taiwan‟s Residential Solar Photovoltaic (PV) Market: Barriers, Solutions and Developmental Prospects 研究: Karl Haby 指導教授: 林子倫 國立政治大學 亞太研究英語碩士學位學程. 立. 政 治 大 碩士論文. ‧. ‧ 國. 學 A Thesis. y. Nat. n. al. Ch. Studies. hi. en. er. io. sit. Submitted to the International Master‟s Program in Asia-Pacific. i n U. v. g c University National Chengchi In partial fulfillment of the Requirement For the degree of Master in Asia-Pacific Studies. 中華民國 100 年 6 月 6/2011. 1.
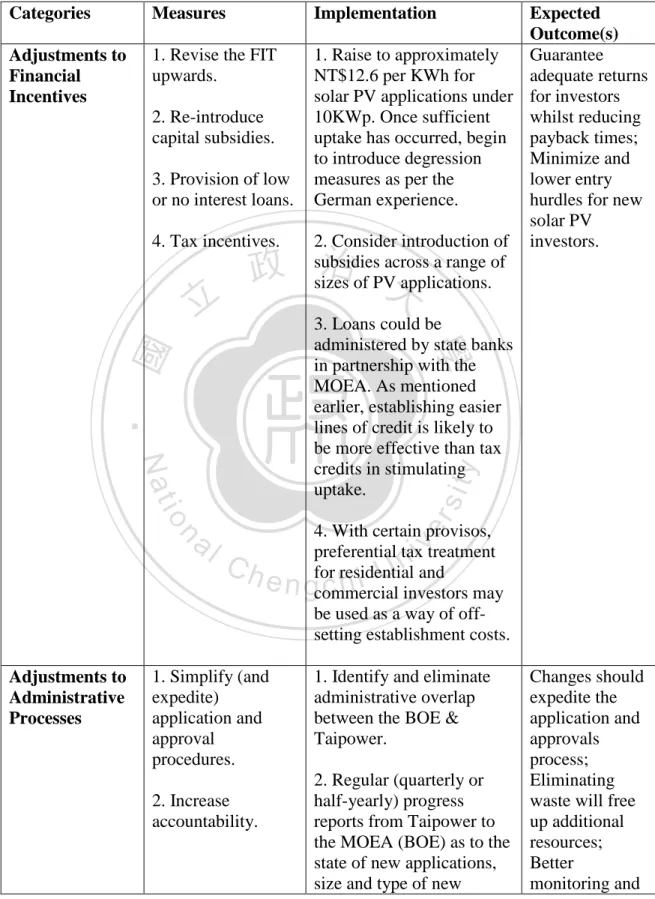
(3) Abstract The motivation for this research stems from an obvious contradiction in Taiwan‟s approach to renewable energy – that while Taiwan remains a leading manufacturer of solar photovoltaics (PV) technology, and has adopted a feed-in-tariff (FIT) to promote solar PV and other renewable energies, market uptake (and completion of new projects) has so far been slow.. In order to understand why, this thesis adopts two broad-based perspectives first identified by the International Energy Agency (IEA): (i) the Market Barriers Perspective. 政 治 大 Taiwan, specifically for the 立small scale (residential) investor contemplating grid. provides a concise summary of the economics of domestic solar PV installation in. ‧ 國. 學. connection under the FIT scheme; (ii) the Market Transformation Perspective identifies those factors (or actors) contributing to inertia in the renewable energy market in Taiwan. A final section in this thesis is given over to describing practical steps and policy. ‧. approaches which may help boost solar PV (and other renewable) capacity in Taiwan.. sit. y. Nat. The results of this research point to a complicated and time-consuming applications. io. n. al. er. process, repeated changes to relevant legislation, and a FIT which is set too low, as the. i n U. v. primary reasons for the limited success to date in developing Taiwan‟s small-scale. Ch. engchi. (distributed) solar PV market. These difficulties are compounded by low electricity prices and a mutual dependency that has developed between the government, Taiwan Power, and large energy-intensive industries to avoid any upset to the status quo.. In order to address these problem areas this thesis recommends immediately revising the FIT upwards (to at least NT$12.6 per kWh) in conjunction with the reinstatement of capital subsidies for small to medium investors. Removing administrative and procedural barriers is likewise deemed essential to fostering growth in the local solar PV market and establishing confidence in overall program. A Developmental Framework in the final section of this thesis describes some potential solutions to the more intractable problems slowing the diversification of Taiwan‟s energy supply.. 2.
(4) 摘要 雖然台灣在太陽能 PV 科技製造業上位居於領先位置,也採取了 FIT 來推廣太陽能 PV 及其他再生能源,但是市場的吸收(以及新計畫的完成)至今仍是進展緩慢; 因此再生能源在台灣明顯且矛盾的狀況成了本論文的研究動機 為了理解為什麼有這種狀況,本論文採用了兩個廣泛的觀點: (一)市場障礙觀點:這個觀點提供了一個簡明的總結;在經濟學上國內太陽能 PV 的安裝,特別是家用投資者在 FIT 計劃下考慮電網連接。 (二)市場轉型觀點:這個觀點確定了影響並降低台灣再生能源市場的因素或是參 與者(政府機關或其他相關團體的人員)。 本論文最後一個章節中提出了可能有助於提高台灣太陽能 PV 或是其他再生能源的 接受度的實用步驟及政策措施。. 政 治 大. 本研究結果指向複雜且費時的申請手續,反覆修改的相關法令,及設定太低的 FIT 為至今台灣太陽能 PV 市場開發成功有限的主要原因。低電價、政府與台電間所發 展出的相互依賴狀況以及極力避免破壞現況的密集產業為造成這些狀況的難題。. 立. ‧ 國. 學 ‧. 為了解決這些缺陷,本論文建議立即將 FIT 上修(至少每千瓦新台幣 12.6 元)並 恢復補貼中小型投資者的資本。削除行政與程序上的障礙是促進在地太陽能 PV 市 場和建立信心的整體方案上非常重要的的一環。論文中的最後一章節提到一個發展 框架,並且描述了 一些針對於更棘手並減緩台灣的多元化能源供應問題的可能解 決方案。. n. er. io. sit. y. Nat. al. Ch. engchi. 3. i n U. v.
(5) Acknowledgements The author first wishes to acknowledge the support and assistance of his close friends and family in the compilation of this thesis. Special thanks to Joy Lin, without whose help and patience this project would have been so much harder to complete. Whenever there was an issue finding or making sense of Chinese-language material, Joy was more than willing and able to assist. Nothing was too much trouble. Thank-you.. Other mentions go to my friend and confidant Daniel Bowman, who could always be relied on for his upbeat support, a cup of coffee, and as a reliable sounding board. 政 治 大 interest in environmental 立 issues and renewable energy, and who was there with me for whenever I ran into difficulties. Also to Frank Lamacchia, who helped stimulate my. ‧ 國. 學. some amazing and fun times in Taiwan.. I also wish to acknowledge the help and guidance provided by my thesis adviser – Lin. ‧. Tze-luen – whose energy and enthusiasm for environmental and social issues is a real. y. Nat. inspiration. Finally, this thesis and my participation in the Asia-Pacific Studies program. io. sit. at NCCU would not have been possible without the kind support of Taiwan‟s Ministry of. n. al. er. Education and the Taiwanese taxpayer. For that support and the many memorable. i n U. v. experiences I have had in Taiwan, I am, and will always be truly grateful.. Ch. engchi. 4.
(6) Contents. 1. Introductory Remarks & General Aims. 7. 1.1. Market Barriers Perspective. 9. 1.2. Market Transformation Perspective. 10. 2. Renewable Energy Policy around the World. 11. 2.1. Feed-in-tariffs (FITs). 12. 2.2. Renewable Portfolio Standards. 15 17. 19. 3.3. Research Design Limitations. Nat. 4. Part I: Background & Policy Frameworks. al. 24 24. v i 4.2.1. Framework of Taiwan’s Sustainable Energy Policy n Ch U i e n gDevelopment ch 4.2.2. Act Governing the of Renewable Energy. 28. 4.2.3. Future Directions. 36. n. 4.2. Energy Policy & Projects. 21 22. er. io. 4.1. Energy Situation in Taiwan. 20. ‧. ‧ 國. 3.2. Research Methodology. 學. 3.1. Research Structure & Research Questions. y. 立. 3. Research Design. 政 治 大. sit. 2.3. Other incentives. 5. Part II: Market Barriers Perspective. 28 29. 39. 5.1. The FIT. 39. 5.2. Features of Taiwan’s Solar PV Market. 41. 5.3. Economics of Solar PV (Residential Applications) in Taiwan. 42. 5.4. Taiwan Compared. 44. 5.4.1. Countries Used for Comparison. 44. 5.4.2. Financial Support Measures. 46. 5.
(7) 5.5. Lessons from Abroad. 51. 5.5.1. South Korea. 51. 5.5.2. Japan. 53. 5.5.3. Germany & Italy. 55. 5.5.4. Additional Financial Strategies. 55. 6. Part III: Market Transformation Perspective. 60. 6.1 Systemic Barriers. 60. 6.1.1. Developmental Features & Systemic Inertia. 61. 6.1.2. Challenges to the Status Quo. 65. 政 治 大 6.2 Transforming the Market 立 6.2.1. Developmental Framework 6.1.3. Zero Sum Game?. 67 69 69. ‧ 國. 學. 6.2.2. Implementing Change. ‧. 7. Part IV: Interim Conclusions. y. Nat. 7.1. Current Barriers & Prospects. n. al. er. io 8. References. sit. 7.2. Key Recommendations. 9. Appendices. Ch. engchi. i n U. v. 75. 78 78 78. 81. 85. 9.1. Appendix A. 85. 9.2. Appendix B. 86. 9.3. Appendix C. 87. 6.
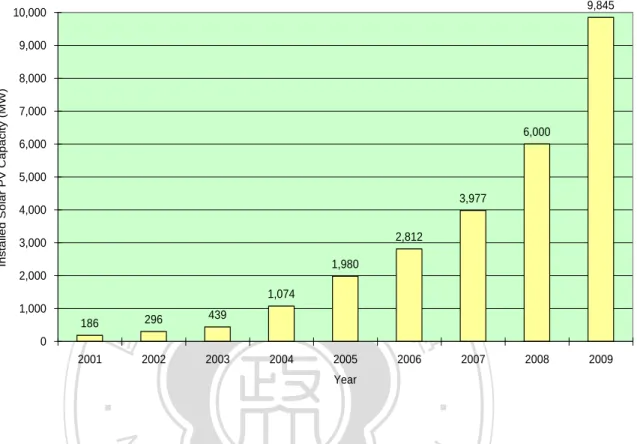
(8) 1. Introductory Remarks & General Aims Taiwan remains a leading manufacturer of solar PV (photovoltaic) technology, having produced approximately 1,400 megawatts (MW) of PV cell capacity, or around 12% of the total global output in 2009 (International Energy Agency, 2010a). Paradoxically, however, Taiwan has very little in the way of installed solar PV capacity (approximately 9.5 MW) especially when compared to other leading manufacturers of solar PV cells and componentry - Germany, for example, as the second largest (behind China) producer of PV cells, had an installed capacity of 9,845MW at the end of 2009 (IEA, 2010a); Japan, in third place (and just ahead of Taiwan in terms of total PV cell production), had. 政 治 大 impressive (231MW) nevertheless 立 eclipses Taiwan in terms of total installed PV. 2,627MW of installed capacity; South Korea, whose production figures were far less. ‧ 國. 學. (442MW).. So while it‟s disappointing that Taiwan has so far not been able to capitalize on it‟s. ‧. production capabilities and technical expertise to boost solar PV demand at home, this. sit. y. Nat. picture hopefully should begin to change soon, especially in light of the more recently promulgated energy policy framework mandating that 8% of total output comes from. io. n. al. er. renewable sources by 20251, a Renewable Energy Act signed into law in July 2009. i n U. v. designed to promote expansion of renewable energy applications in Taiwan, and a new. Ch. engchi. Feed-in Tariff (FIT) regime which sees energy supply and utility companies (like the state-owned Taiwan Power Corporation) purchase the electricity generated by individual producers of renewable energy (householders and other privately-owned operators) at a premium and over a fixed term (20 years)2. 1. Readers should refer to the Framework of Taiwan‟s Sustainable Energy Policy (2008) released by the Ministry of Economic Affairs (MOEA) and published in English. Additionally, the Science and Technology Advisory Group of the Executive Yuan met in 2007 and set a target of 8.45GW (14.9%) of total generating capacity to come from renewable sources by 2020 (Liou, 2010). 2. Readers should refer to the Act Governing Development of Renewable Energy (再生能源發展條例) ratified in July 2009 (and amended once since then). The FIT is administered via this Act. Archival information and the latest updates can be obtained via the BOEs special information portal http://www.moeaboe.gov.tw/Policy/Renewable/news/SENewsList.aspx. 7.
(9) Without doubt these are positive first steps from the government, but developing a selfsustaining renewable energies sector where solar PV is at the forefront requires more than just „nice sounding‟ policies and some additional funding. It requires genuine commitment and timely action from all government agencies charged with implementing renewable energy policy,3 consultation and cooperation between those agencies and the private sector (including industry and environmental groups), and of course, a well informed and empowered public willing to invest in new energy technologies because it makes financial and environmental sense to do so.. As just mentioned, real growth in the solar PV market has been slow despite a renewable. 政 治 大 indeed, since the promulgation of the Act in 2009, the total amount of grid-connected 立 solar PV capacity installed and potentially eligible to sell electricity under the FIT. energy roadmap4 which set 75MW as the target amount to have been installed by 2010 –. ‧ 國. 學. scheme stands at just 4MW.5 What factors might help explain this slower than expected progress? Are the FIT and subsidy measures generous enough to stimulate private sector. ‧. investment? Are there systemic issues that slow or prevent the roll-out of new energy. y. Nat. technologies in Taiwan, and especially solar PV? Is it perhaps still too early for us to. er. io. successful or not?. sit. judge whether the FIT and other subsidies offered by the government have been. al. n. v i n Cofhthis thesis, whichUis to explore those factors impacting We are thus lead to the purpose engchi on the development of a sustainable residential solar PV market in Taiwan over the short 3. Major players in this area include the Ministry of Economic Affairs (MOEA) and its Bureau of Energy (BOE) primarily responsible for designing, implementing and reporting on energy policy, a special Pricing Committee (躉購費率審定會), established in accordance with the Act and convening annually to review the FIT and subsidy arrangements, and the state-owned Taiwan Power Corporation who approves and oversees grid-connections. 4. These targets were agreed upon and published by Taiwan‟s Executive Yuan, subsequent to a meeting on Promoting the Development of New Energy (行政院新能源發展推動會) in August last year. The „roadmap‟ aims at bringing Taiwan‟s total installed solar capacity up to 2,500MW by 2030. Based on the latest planned revisions to supporting legislation, however, the actual target can be revised at any time by the MOEA. 5. As of 23 December 2010 when the MOEA released its (unpublished) report into the state of renewable energy developments in Taiwan – Renewable Energy Policy Directions, Decision Making and Implementation (再生能源之政策方向,決策流程及執行情形).. 8.
(10) to medium term – the residential (small scale) solar PV market is of particular interest to us in this study because this is (perhaps) where the greatest potential resides for the expansion of distributed grid-connected solar PV capacity,6 as seen in the countries used for comparison in this thesis, namely Germany, Italy, and Japan.7 In focusing on the residential PV market we adopt two unique but complementary developmental perspectives, both of which are necessary to our understanding of the potential barriers and also opportunities for growing Taiwan‟s renewable energy sector, and solar PV in particular; these are the Market Barriers Perspective and the Market Transformation Perspective. It‟s worth noting that in its (2003) report, the IEA identified an additional perspective – the Research, Development, and Deployment Perspective – which has been. 政 治 大. deliberately omitted in order to narrow the focus of our investigation.. 立. 1.1. Market Barriers Perspective. ‧ 國. 學. The Market Barriers Perspective, which „characterizes the adoption of a new technology. ‧. as a market process (and) focuses on decisions made by investors and consumers‟ (IEA,. y. Nat. 2003, pg. 18), is useful in identifying the scope and magnitude of the financial hurdles. er. io. sit. impeding capital outlays. Using this perspective we aim to;. al. n. v i n C h small scale (household) Taiwan, specifically for the e n g c h i U investor contemplating a. 1. Provide a concise summary of the economics of domestic solar PV installation in grid-connection under the government‟s FIT scheme.. 2. Compare the kinds of subsidy and support measures offered in Taiwan with countries (including close regional neighbors) where residential solar PV has been deployed successfully. 6. Small scale (distributed) grid-connected solar PV capacity is the focus of this thesis and refers to solar installations typically found on the rooves of residential, commercial, industrial and other public facilities. These installations collect solar energy, converting it into electricity which is subsequently fed into the local power grid or network. 7. At the end of 2009 cumulative installed PV power (MWp) grew to 2,627MW in Japan, 1,181MW in Italy, and 9,845MW in Germany (IEA, 2010a). The majority of this cumulative installed capacity was to be found in the distributed (rather than centralized) sector of the solar PV market.. 9.
(11) 3. Comment on the appropriateness of current policy and financial incentives aimed at expanding domestic solar PV capacity.. 1.2. Market Transformation Perspective The Market Transformation Perspective seeks to identify those factors (or actors) contributing to inertia in the renewable energy market in Taiwan; using this approach we try to explain some of the underlying reasons limiting the penetration and overall competitiveness of solar PV in the energy market place. In particular, we aim to;. 政 治 大 electricity producers and consumers – in shaping energy policy and pricing. 立. 1. Examine the linkages between various stakeholders – government, industry,. ‧ 國. 學. 2. Describe systemic barriers to the implementation of a successful renewable energy development strategy.. ‧ y. sit. io. er. Taiwan.. Nat. 3. Make suggestions as to how best to stimulate demand for domestic solar PV in. al. n. v i n Ch U these two perspectives are able theories and therefore lack any predictive e n gpower. c h iWhere At this point we must stress that these two perspectives are not in anyway formalized. to help us, however, is in providing a general framework around which we can make observations, draw comparisons, and contextualize features of Taiwan‟s renewable. energy developments. We should also note that these two perspectives are not mutually exclusive and often share points of overlap as well as points of difference – as such, readers will find elements of the other in the separate analyses conducted here. Before conducting any analysis, however, we must first take a look at features of renewable energy policy developments around the world with a brief review of the literature.. 10.
(12) 2. Renewable Energy Policy around the World We begin this section – and brief appraisal of the literature – by making an observation that may at once seem obvious, but is nevertheless essential to understanding how renewable policy is formed and implemented in various countries around the world, including Taiwan.. That is, that the features of any one particular national energy policy framework tend to be shaped by a whole range of factors, including (but not limited to) prevailing economic, political, environmental and social conditions; a country that might seem particularly well. 政 治 大 local political factors and立 (well founded or not) opposition from residents concerned. suited to deploying wind energy, for example, might not ever realize this potential due to. ‧ 國. 學. about the negative impacts of the placement of wind turbines in their neighborhood. The opposite can also be true of course; a country that is not particularly well endowed in terms of solar irradiation potential, but still manages to achieve spectacular growth in its. ‧. solar PV market (and renewable energy production figures) due to the right combination. y. sit. io. n. al. er. educated public.. Nat. of economic incentives, effective administration and regulation, and a well informed and. i n U. v. A second related observation is that there are as many approaches to (renewable) energy. Ch. engchi. policy as there are national governments implementing programs to encourage renewable energy deployment; according to the Renewable Energy Policy Networks‟ (REN 21, p.37, 2010) most recent report, by the end of 2009 there were at least 83 countries – 41 developed/transition countries and 42 developing countries – employing some type of policy (or combination of policies) to promote renewable power generation; these included such measures as feed-in-tariffs (FITs), renewable portfolio standards, capital subsidies or grants, investment tax credits, sales tax or value added tax (VAT) exemptions, green certificate trading, direct energy production payments or tax credits, net metering, direct public investment or financing, and public competitive bidding.. 11.
(13) Given the sheer number and diversity of policy measures that exist for promoting renewable energy around the world, this section merely attempts to identify and describe two of the most influential and commonly adopted policy measures – in doing so we shall highlight their relative advantages, disadvantages, general efficiency and effectiveness.. 2.1. Feed-in-tariffs (FITs) Beginning with the FIT which – according to the same REN 21 report cited above – is the most commonly deployed policy with at least 50 countries and 25 states/provinces adopting the FIT in some form or another; readers will appreciate that the widespread. 政 治 大 number of studies and reports identifying it as the most effective (and cheapest) policy 立 tool for promoting a broad basket of renewable energy technologies within a relatively adoption (particularly in recent years) of FITs around the world is no accident, with a. ‧ 國. 學. short period of time.. ‧. In the largest study of its kind, the International Energy Agency (IEA) in 2008 examined. y. Nat. the effectiveness (market growth) and cost efficiency of renewable energy policies across. sit. 35 countries including members of the EU, the US, and the so-called BRICS nations. er. io. (Brazil, Russia, India, China, and South Africa). One of the report‟s key findings was that. al. n. v i n C the EU-15 countries to their realizable potential) wereh e n g c h i U in Germany, Spain, Ireland and. between 2000 and 2005, the most successful countries in deploying wind power (relative. Denmark; of these four countries, all but one (Ireland) relied exclusively on the FIT to achieve growth in their local renewables sector.. Similarly, and with regard to the development of solar PV markets, strongest growth between 2002 and 2005 was observed in Luxembourg and Germany, followed by Japan, Switzerland, the Netherlands, Australia, Austria and the United States. In all of these countries – with the notable exceptions of Japan, Australia, and the US – this development was achieved through the implementation of fixed FITs which serve both to. 12.
(14) guarantee a return on investment for new market entrants, whilst improving predictability in pricing for utilities and consumers (Mendonca, Jaconbs & Sovacool, 2010).8. Further support for use of FITs to boost renewable deployment is to be found in a research project funded by the German Federal Ministry for the Environment, Nature Conservation, and Nuclear Safety, which gave an appraisal of various support schemes and their relative expense in promoting wind energy in individual member states of the EU. The authors found that those countries relying on quota systems (to be discussed subsequently) as the main support system – Italy, the UK, and Belgium – had a high expected annuity of support (due to high certificate prices at the time) contributing to. 政 治 大 capacity in their respective local markets (Ragwitz et al., 2006). Conversely, the report 立 noted, those countries supporting wind energy (and other renewable options) via a FIT –. both increased costs for end-use electricity consumers and limited growth in wind energy. ‧ 國. 學. Germany, Austria, Spain – were more effective at generally moderate levels of financial support, notwithstanding additional administrative barriers which can also impede market. ‧. expansion.. y. Nat. sit. A second report also released on behalf of the German Federal Ministry for the. er. io. Environment, Nature Conservation, and Nuclear Safety (Durrschmidt & van Mark, 2007),. al. n. v i n C h Act (EEG), gives with the Renewable Energy Sources e n g c h i U us some insight into why Germany and which looked at the relative costs, benefits, and general developments associated. has been so successful at expanding renewable capacity using a FIT. As the report. explains, while total and differential costs of electricity procurement have been on the rise in Germany due to the FIT (€2.5 billion in 2004 to €3.3 billion in 2006), these additional costs are more than offset by a number of secondary effects that expanding renewable capacity has had on the system and economy as a whole. These additional benefits include a reduction in the total quantity of energy imports in 2006 totaling approximately €0.9 billion, a saving for the economy in the order of €3.4 billion due to the massive reduction in CO2 emissions (45 millions tones) which would have otherwise. 8. We should point out that Japan, Australia, and the US have all since begun employing an FIT in combination with other measures to boost renewable capacity.. 13.
(15) had to be accounted for, and an overall lowering in prices on the electricity market of between €3 and €5 billion due to the „merit order effect‟, which acts to reduce spot prices for electricity during times of peak demand.. If we then compare the costs of the system attributable to FIT-related payments under the EEG (as well as incidental regulatory and transaction costs) with the savings just described, we find that the German economy in 2006 came out ahead by approximately €6 billion dollars. This remarkable figure doesn‟t even take into account the additional value to the economy associated with a large (and continually growing) renewable energy sector – with an estimated 280,000 people in employment until 2008 – and an annual. 政 治 大. turnover of €30 billion dollars (Mendonca et al., 2010).. 立. And while the German scheme is to be applauded for its effectiveness and relative (cost). ‧ 國. 學. efficiency, we should perhaps point out that a FIT scheme is not a one-size-fits-all policy. Simply instituting FITs without careful consideration of the type and technological. ‧. maturity of the renewable resource to be developed, is likely to be ineffective in creating. y. Nat. new generating capacity and investment. Mendonca et al. (2010), for example, describe a. sit. number of potential pitfalls or obstacles associated with the implementation of FIT. er. io. schemes around the world; these include such issues as faulty tariff calculation. al. n. v i n C hand regulatory mechanisms under investment, poor financing which result in higher costs engchi U methodologies leading to tariffs which are too high or too low and triggering over and. to the government and taxpayer and renewable capacity caps which artificially limit. investment and drive market instability. Readers should keep these deficiencies in mind when we come to analyze in more detail Taiwan‟s newly implemented (since 2009) FIT system.. At this point it must also be said that all of these policy failings and their flow-on effects are either completely or largely avoidable; that is to say, that there is nothing inherently problematic about the idea of using a FIT to develop national markets for renewables, only in the way FITs are designed and implemented by policy-makers. Indeed, when employed correctly FITs have a number of distinct advantages over other policies which. 14.
(16) we may summarize as follows (Ragwitz et al., 2006): FITs act to drive down capital costs through rapid uptake of emerging energy technologies (economies of scale) and learning effects; FITs are able to promote a diversified portfolio of technologies and industrial sectors rather than just least cost options; FITs provide a predictable and secure investment environment which helps to minimize electricity costs and reduce large windfall profits for producers.. 2.2. Renewable Portfolio Standards (RPS) and Tradable Certificates RPS, also called renewable obligations or quotas, like those employed by government‟s. 政 治 大 electricity sales or generating capacity (within a certain time frame), from qualified 立 renewable energy sources like wind, solar, biomass, hydro and geothermal power plants. in the US, Europe, and elsewhere mandate that utilities source a specific amount of their. ‧ 國. 學. (Mendonca et al., 2010, p.150). In places like the UK, utilities are required to produce evidence of their compliance via Renewable Obligation Certificates,9 which show that a. ‧. specified amount of electricity has been produced (or sourced) from an eligible renewable. y. Nat. source. Certificates (or credits) may be traded between participants in the scheme,. sit. introducing an additional degree of flexibility, while non-compliance is enforced via. n. al. er. io. financial penalties equal to around ₤30 per MWh in the UK (in 2002 and subject to. i n U. v. inflation) which can be used by government‟s to further incentivize investment in. Ch. engchi. renewable energy projects (Carbon Trust, 2006).. But while quota systems – and the „tradable certificate‟ systems used to support these schemes – appear to have some attractive features at first glance, there are a number of inherent drawbacks to their use which have been borne out by evidence in the literature.. As was described in the previous section, those countries in Europe employing FITs were able to achieve a far more rapid expansion of their renewable markets much more cheaply than was the case for countries using quota systems (Ragwitz et al., 2006)(CEC, 2008). One of the key reasons for this being that in contrast to a price-based instruments 9. Each ROC is equivalent to 1MWh of electricity generated.. 15.
(17) like the FIT, quota systems tend to result in price instability and higher costs for both developers and consumers. This is because quota systems relying on tradable certificates or credits are always going to be subject to market fluctuations – prices for tradable certificates and other manufacturing articles (like the steel needed to produce wind turbines) vary on the open market as a natural consequence of supply and demand, and the constraints imposed by capacity caps within a quota system framework (Mendonca et al., 2010). As a result of this uncertainty and added risk, developers and utilities requiring capital for new projects are inevitably charged more (via higher lending rates) for the money they borrow from banks or other credit sources. This premium on risk means that increased costs are not only transferred on to the consumer in the form of higher. 政 治 大 projects instead go to the servicing of loans. 立. electricity bills, but that funds which might have been spent on additional renewable. ‧ 國. 學. Another inherent flaw in quota based schemes connected to the argument presented above, is that whereas FITs have the flexibility to promote a whole range of renewable. ‧. energy technologies at different stages of their development concurrently, quota-based. y. Nat. systems will tend to revert to the least-cost option; this is brought about as a direct result. sit. of producers and suppliers of renewable energy attempting to keep costs low through the. er. io. use of more mature (cheaper) technologies – typically onshore wind capacity.. al. n. v i n C h in their study, those As Jacobsson et al. (2009) describe e n g c h i U EU countries employing quota or tradable certificate-based systems to meet national renewable energy targets, rely exclusively on one or two (least cost) options. Besides government‟s of Sweden, the UK, and Flanders all struggling to meet mandated renewable targets, overreliance on one or two renewable energy technologies in each of these countries has had other serious consequences, not the least of which include higher costs for end-use consumers (for reasons outlined before), and huge profit-taking by the largest the energy utilities, precluding participation of small-scale wind and solar operators in development plans and stifling innovation and diversification in energy portfolios. Such a strategy is in direct contrast to the experience of Germany, Spain and elsewhere, where the rapid expansion of renewable generating capacity (particularly solar PV) has been characterized by. 16.
(18) ensuring easy and equitable grid-access for thousands of distributed applications through a FIT.. In summing up then, RPS and tradable certificate schemes have enjoyed some success at promoting renewable energy capacity around the world, but the positive features associated with their adoption – like clearly specified targets and flexibility for producers and electricity utilities in meeting their renewable quotas – tend to be outweighed by some fairly serious shortcomings. These include the instability inherent in the tradable certificates market, increased private sector risk and higher lending costs, an added burden on electricity consumers and taxpayers, over reliance on only the cheapest. 政 治 大. technologies, and administrative and compliance challenges.. 立. Given these considerations, and based on current evidence, it appears that an. ‧ 國. 學. appropriately designed and implemented FIT scheme remains the most effective and cost-efficient option for promoting large scale deployment of renewable energy options,. ‧. regardless of the level of market maturity of those technologies. Taiwan is fortunate in. y. Nat. that the national government, in addition to legislating (relatively ambitious) national. sit. renewable energy targets, has also adopted the use of FIT to boost renewable generating. n. al. er. io. capacity. The results of these efforts shall be appraised in the following sections of this. i n U. v. thesis, specifically with regard to how the FIT has impacted on (distributed) solar PV capacity.. Ch. engchi. 2.3. Other Incentivization Methods Having now covered the two most influential and commonly deployed policies used to encourage large-scale investment in the renewables sector, let us now just quickly review some complementary incentivization measures, which will be referred to again later on in this thesis; . Capital grants, subsidies, rebates: as of 2009, some type of direct capital investment subsidy, grant, or rebate was offered in approximately 45 countries. 17.
(19) (REN 21, 2010). This type of targeted financial assistance offered by state and federal governments around the world, and in addition to larger incentivization schemes like a FIT, is designed primarily to lower investment barriers for new market entrants. This is particularly important for small-scale private and household investors who might otherwise not be able to gain access to (more expensive) renewable technologies like solar PV. . Tax credits – sometimes classified as investment tax credits (ITCs) and production tax credits (PTCs) – are another commonly used tool to encourage investment in renewable energy projects. However, whereas capital grants,. 政 治 大 market entrants, tax credits tend to accrue benefits for those who can already 立 afford the upfront expense – typically larger companies and producers looking to subsidies, and rebate schemes tend to lower initial investment hurdles for new. ‧ 國. 學. offset costs. As such, poorly designed tax credit systems will tend to discriminate against small scale private and household investors, while reducing government. y. Nat. sit. Net Metering (also called „net billing‟) is a widely-deployed and important policy. io. for rooftop solar PV and other renewables, allowing owners of grid-connected. er. . ‧. tax revenues (Mendonca et al, 2010).. al. n. v i n C hmetering (unlike aUFIT) however, does not allow a grid (REN 21, 2010). Net engchi. renewable generating capacity to be credited for the electricity provided to the. producer to derive any additional financial benefit from their renewable. installation, with the utility simply crediting (rather than reimbursing) the producer for excess amounts (over an above their level of consumption) of electricity produced. As such, net metering is mostly ineffective in providing financial assistance to large renewable energy power plants (Mendonca et al., 2010).. 18.
(20) 3. Research Design In order to address the aims outlined in the introductory section, this thesis is divided into four main parts: Parts I, II and III comprise four research questions, with Part IV an additional section where we synthesize our findings.. 3.1. Research Structure & Research Questions Part I: Background & Policy Frameworks Research Question One (RQ1):. 立. Which factors might help explain existing patterns of energy supply and. ‧ 國. 學. (i). 政 治 大. consumption in Taiwan?. ‧. (ii). What are the implications of relevant10 energy policies and capacity building. Nat. er. io. sit. y. projects for the expansion of renewable energies like solar PV?. Part II: Market Barriers Perspective. n. al. Ch. Research Question Two (RQ2):. (i). engchi. i n U. v. Do the current subsidy and FIT measures provide adequate11 financial support for private sector (household) investors in Taiwan?12. 10. There are of course many policies (economic, environmental, security etc.) with the potential to impact on the development of Taiwan‟s energy framework. We are concerned primarily, however, with the two pieces of legislation described in the introduction: the Framework of Taiwan‟s Sustainable Energy Policy (MOEA, 2008) and the Act Governing Development of Renewable Energy (MOEA, 2009). 11. In coming to define „adequate support‟ we identify here with the potential investor and whether or not the current FIT and other subsidy measures are enough to cover the initial outlay and provide for a modest return – see the Research Methodology for an operationalized definition.. 19.
(21) Research Question Three (RQ3):. (i). How does Taiwan compare with selected Photovoltaic Power Systems Programme (PVPS) countries in terms of financial support measures – specifically the FIT and capital subsidies – and overall performance in the grid-connected (distributed) PV sector?. (ii). What are some possible lessons or insights from those selected PVPS countries that Taiwan could utilize in growing its own domestic solar PV market? And what additional (financial) strategies or incentives should be. 政 治 大. considered to facilitate dissemination of domestic solar PV applications?. 立. Part III: Market Transformation Perspective. ‧ 國. 學. Research Question Four (RQ4):. ‧. (i). What systemic factors might explain the relatively slow penetration of. y. Nat. al. er. io. And what should/could be done from a Market Transformation Perspective to. n. (ii). sit. renewable alternatives, particularly solar PV, in the local energy market?. Ch. i n U. v. enhance demand for solar PV and improve its competitiveness?. engchi. Part IV: Interim Conclusions No Research Question.. 12. This point is critical because without favorable returns, even those (less risk averse) investors knowledgeable about renewable energy and environmental issues will be discouraged from entering the market.. 20.
(22) 3.2. Research Methodology A Note on Sources This thesis draws primarily on statistics sourced from government and non-government organizations. When examining Taiwan‟s energy framework in Part I, for example, we use the most recent statistics supplied by the Ministry of Economic Affairs‟ (MOEA) Bureau of Energy (BOE), which are readily accessible online from the statistics section of the Bureau‟s website. We also rely on government sources (e.g., policy documents and interim reports) to help us discern the direction of future developments in the renewable. 政 治 大. energies market.. 立. In Part II, where we conduct an economic analysis as to the attractiveness of investing in. ‧ 國. 學. solar PV in Taiwan, we again use the BOE‟s website to collect the most recent FIT and subsidy information – for those that read Chinese, this information is attainable via the. ‧. specialized Act Governing Development of Renewable Energy portal outlined in a. y. Nat. previous footnote. We complete the analysis in Part II by drawing on the information. io. sit. comprised in individual country reports submitted to the International Energy Agency‟s. n. al. er. (IEA) Photovoltaic Power Systems Programme (PVPS). All calculations which are used. i n U. v. to underpin the analysis in Part II are the author‟s own, as are any mistakes or oversights.. Ch. engchi. In Part III, where we analyze some of the more institutional or systemic barriers to the dissemination of solar PV in Taiwan, we rely primarily on secondary sources such as government and newspaper reports, press releases, and peer-reviewed journal articles; these sources are consulted in addition to raw statistical data in order to contextualize our findings and give an up-to-date picture of developments in renewable energy in Taiwan. Part IV is simply a synthesis of our findings from the first three sections, and as such, we don‟t introduce any new sources.. 21.
(23) Operationalized Definitions In order to answer RQ2(i) - Do the current subsidy and FIT measures provide adequate financial support for private sector (household) investors? – we must first arrive at an agreeable definition for „adequate financial support.‟. Adequate financial support is, defined at a minimum, the amount of financial support that the government provides through the FIT, a capital subsidy, or a combination of both, that would allow a small scale (household) investor to recoup the costs of their original outlay before the expiration of an electricity purchasing contract (typically 20 years),. 政 治 大. and factoring in the present value of a future sum.. 立. While this figure of 20 years may not seem particularly attractive to a potential investor. ‧ 國. 學. aiming for at least a modest return on their (not insignificant) outlay, we adopt it here as a (minimum) baseline for comparison. Anything exceeding 20 years is obviously going to. ‧. be of limited value in attracting renewable energy investors (and particularly small scale. sit. y. Nat. solar PV investors) into the market.. n. al. er. io. 3.3. Research Design Limitations. Ch. engchi. i n U. v. This thesis attempts to use the most current information available when reporting on the state of Taiwan‟s domestic solar PV market. This has posed a challenge due to a number of changes to the Act, important supporting legislation (e.g., proposed Draft Amendments for Renewable Energy Installations Approvals Process - 再生能源發電設備認定辦法修 正草案總說明 – MOEA, 2011a), and FIT/subsidy arrangements, that have occurred during the course of the writing process. As the changes pertaining to the development of renewable energy in Taiwan are almost exclusively reported on and published in Chinese, I have attempted to translate their implications faithfully into English. Any errors arising from translation of this material are the author‟s own.. 22.
(24) In Part II we conduct our economic analysis as to the costs and benefits of solar PV and wherever possible we use data from primary sources (annual reports from individual countries reports or reliable second-hand sources like the IEA‟s PVPS. Some additional points to be aware of: . Although figures related to the cost of installation of a solar PV system are the most recent available (2009 figures), they are likely higher than current (2011) prices due to the trend for solar PV technology to become cheaper over time. As a result, there may be a slight distortion in the economic analysis undertaken in Part II with regard to total capital cost and payback times – with the technology. 政 治 大 lower than in 2009 and the payback times comparatively shorter (supposing FIT 立 rates don‟t change drastically). This means our results may show higher capital becoming cheaper, the total capital cost to an investor in 2011 will actually be. ‧ 國. 學. costs and longer payback times than may necessarily be the case.. ‧. . The FIT figures quoted in this thesis are the most recent 2010 figures, except for. y. Nat. Taiwan where the 2011 figures have become available. In some cases the FIT. sit. figures are lower in 2010 than they were in 2009 due to maturing markets, and. er. io. individual governments allowing for the cost buy down effect – this may distort. al. n. v i n CofhTaiwan) rates to U (or 2011 rate in the case e n g c h i calculate the payback times and. the results again in the same direction so that when using the reduced 2010 FIT. financial returns on a more expensive 2009 solar installation, we might see higher payback times and lower net gains than would otherwise be the case for a (cheaper) 2010-2011 solar PV installation. . Difficulty calculating costs and FIT rates across different countries and currencies: With international money rates varying on a constant and daily basis, we convert directly from the „foreign‟ currency to the NT dollar, with the date and on-line location of the conversion also specified where relevant.. 23.
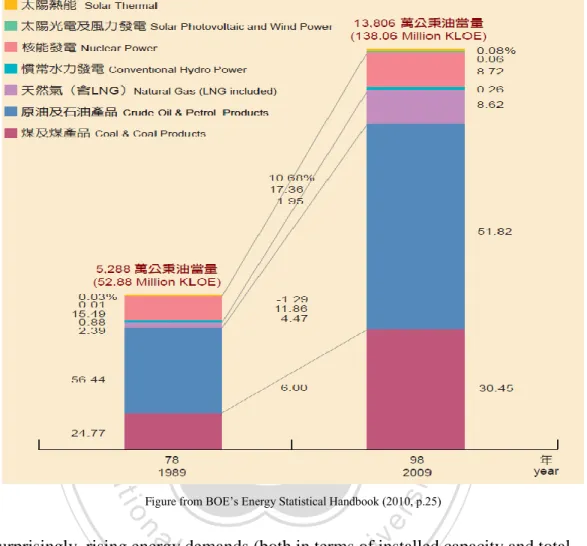
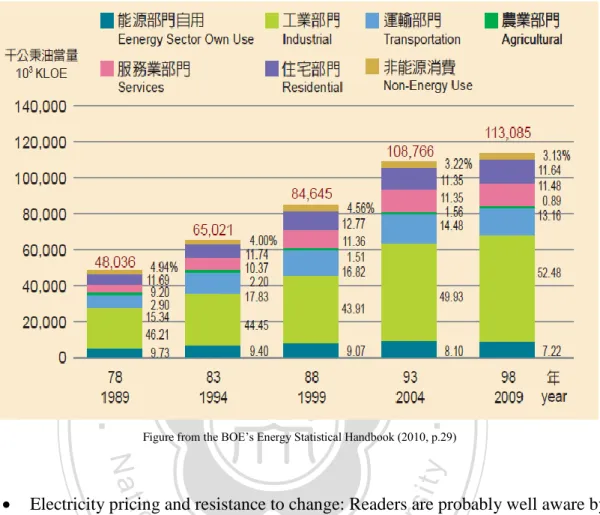
(25) 4. Part I: Background & Policy Frameworks 4.1. Energy Situation in Taiwan Over the last twenty years or so, Taiwan‟s energy supply figures have grown by roughly two and a half times, from nearly 53 million kiloliters of oil equivalent in 1989, to around 138 million kiloliters of oil equivalent in 2009 (see Figure 1 over page). Of this energy supply, 99.36% was imported (up from 95.4% in 1989), with Coal and Coal Products (30.45%), Crude Oil and Petroleum Products (51.82%), and Natural Gas (8.62%) forming the largest overall contributions (BOE, 2010).. 立. 政 治 大. In terms of total electricity generating capacity the trend has also been upwards; total. ‧ 國. 學. installed capacity rose from 17,253MW in 1989 to around 47,985MW in 2009, with most of the recent growth being driven by LNG-fired power stations (30.77% of total capacity),. ‧. but with coal-fired power stations also contributing significantly (37.35%). As has already been alluded to, renewable energies like Wind (0.78% or 376MW) and Solar PV. Nat. sit. y. (0.02% or 9.5MW) have not yet been developed or sufficiently exploited for them to. io. n. al. er. make a larger contribution.. Ch. i n U. v. Similar trends are observable for total power generation with Taiwan producing. engchi. 84,057GWh in 1989 growing to 229,593GWh in 2009 – Coal (53.35%), LNG (20.35%) and Nuclear (18.10%) are the largest contributors. Electricity from Hydro sources generated 7,053GWh (or 3.07%) with Wind (0.34%) and Solar PV (0.00) generating negligible amounts of electricity. Interestingly, total power generation has levelled off over the last five years, possibly reflecting slowed Per Capita Real GDP growth (due to the associated impacts of the Global Financial Crisis) and/or declining figures for Energy Intensity13 (BOE, 2010). 13. Energy Intensity is a measure of the energy efficiency of a nation‟s economy and is calculated as units of energy per unit of GDP. More efficient use of energy (in the absence of fluctuations in other contributing factors) will lower Energy Intensity, while a less efficient conversion of energy into GDP will cause the opposite to be the case.. 24.
(26) Figure 1: Structure of Taiwan‟s Energy Supply (1989-2009). 立. 政 治 大. sit. y. ‧. ‧ 國. 學. io. n. al. er. Nat. Figure from BOE‟s Energy Statistical Handbook (2010, p.25). i n U. v. Unsurprisingly, rising energy demands (both in terms of installed capacity and total. Ch. engchi. power generation) over the years have coincided with a fairly rapid rise in CO2 emissions – Taiwan‟s emissions were estimated at about 116 million tonnes in 1990 but had grown to just over 268 million tonnes by 2008 (IEA, 2010).14 This represents an increase of over 132% in CO2 emissions over the last 18 years for which data is available, and counts among one of the highest growth rates in industrialised Asia. Historically speaking, the continued upward trending of Taiwan‟s energy import and supply needs, concomitant rise in CO2 emissions, and the relatively small contribution 14. International Energy Agency (IEA) 2010b, CO2 emissions from fuel combustion. CO2 emissions data as per the Reference Approach. The Reference Approach is a theoretical value obtained from a country‟s energy supply data and represents an upper-bound to the amount of CO2 produced during conversion.. 25.
(27) from renewable energies like Solar PV and Wind, can be explained by several interconnected developmental factors; 1. Taiwan‟s geographical position, small size, and lack of exploitable natural resources make it heavily reliant on other nations and already proven low-cost energy technologies (e.g., coal, oil and natural gas) for energy supply and security (BOE, 2010).. 2. Taiwan continues to utilize comparatively cheap (but carbon intensive) fossil fuel imports to depress operating costs for its large-scale industries15 and transport. 政 治 大 while electricity prices in Taiwan have risen slowly over the last five years, they 立 are still some of the lowest in the world (equivalent to Mexico‟s) at NT$2.9 per sector, and to satisfy domestic consumers‟ demand for low-cost energy.1617 And. ‧ 國. 學. KWh for „light‟ users, and NT$2.46 per KWh for industrial purposes (BOE, 2010). Under these conditions, and without key externalities (like costs associated. ‧. with the deleterious effects of greenhouse gas emissions) factored in to the price. y. Nat. of energy in Taiwan, more expensive (renewable) alternatives will continue to. sit. find it hard to gain a foothold in the market. Reducing electricity consumption. n. al. er. io. through behavioural change (at the individual and organizational level) will also prove similarly difficult to achieve.. Ch. engchi. i n U. v. 3. The relatively slow implementation of comprehensive policy and financial support (when compared to countries like Japan or Germany, for example) mean that a larger, self-sustaining renewable energies market is yet to develop in. 15. Energy and Industrial sectors accounted for 59.7% of all energy consumption in 2009, with Transport (13.16%), Services (11.48%) and Residential (11.64%) sectors also consuming significant resources (BOE, 2010). 16. BOE (2010) report: since 1989, the average cost of electricity has risen by only NT$0.49 (US$0.015) per KWh. 17. Wang (2009) reports that the day after the Cabinet‟s Tax Reform Committee announced a plan to levy new energy and carbon taxes commencing in 2011, the Premier Wu Den-yi cited negative public sentiment and the struggling economy as reasons for delaying the plan indefinitely.. 26.
(28) Taiwan. With the exception of electricity derived from Hydro sources, renewable alternatives like Solar and Wind are still seemingly a long way off occupying a significant place in the market. As previously reported, since the passage of the Act Governing Development of Renewable Energy in mid-2009, total installed grid-capable solar PV capacity eligible for the FIT was just 4MW. According to one source,18 the real figure is probably closer to zero (0MW) due to delays in approval and certification on completed projects, and constant changes to the way the program is being administered.19 We shall revisit this in more detail in a subsequent section.. 政 治 大 (134,839 – 138,057 million KLOE), Total Domestic Consumption (108,768 – 113,085 立 million KLOE), Total Power Generation (218,396 – 229,693Gwh), Per Capita Electricity In summing up this section, and on the positive side, we see that Total Energy Supply. ‧ 國. 學. Consumption (9,297 – 9,609KWh) and Total CO2 Emissions (270 – 268 million tonnes of CO2) have all demonstrated slowed or negative growth over the latest five year. ‧. reporting period (2004 – 2008/9). Less positive for the overall diversity and sustainability. y. Nat. of Taiwan‟s energy supply, however, is that Taiwan still remains heavily dependent on. sit. carbon-intensive electricity generation and foreign energy imports, sells its electricity too. n. al. er. io. cheaply to energy-intensive export industries, and has so far made very slow progress towards transforming its energy system.. Ch. engchi. i n U. v. 18. Lai Zeng Hua (賴增華) from the Solar Power Generation System Association (中華民國太陽光電發電 系統商業同業公會) asserted in an interview with the author on 18 January 2011 that no solar PV projects have received final approval to begin selling electricity via government purchase arrangements. Although this claim has not been verified independently there have been a number of similar media reports. 19. The MOEA on the 26 January 2011 proposed sweeping changes to the Renewable Energy Installations Approvals Process (再生能源發電設備認定辦法) – the most significant changes mean that the MOEA may at anytime refuse to process new applications or register new projects, that Taipower will become gate-keeper for all new applications, as well as stricter timelines with regard to the completion, connection and registration of new solar projects.. 27.
(29) 4.2. Energy Policy and Projects 4.2.1. The Framework of Taiwan’s Sustainable Energy Policy (2008). We begin our discussion in this section with a more in-depth look at the relevant legislation only briefly mentioned in the introduction. The Framework of Taiwan‟s Sustainable Energy Policy,20 promulgated in 2008, identifies several priority areas to be pursued by the government; these include the development of Cleaner Energy Supply, the Rationalization of Energy Demand, and working towards a Comprehensive Regulatory Framework to support cleaner energy (low or no carbon) alternatives and reduced emissions.. 立. 政 治 大. ‧ 國. 學. With particular relevance to RQ1, the Cleaner Energy Supply section of the Framework includes several concrete goals; chief among them, that 8% of Taiwan‟s total electricity output is to be derived from renewable sources by 2025 (this is in addition to a target. ‧. advanced in 2007 which mandates 15% of total capacity to be derived from renewable. sit. y. Nat. sources by 2020); that nationwide CO2 emissions are to return to 2008 levels between. io. er. 2016 and 2020, and further reduced to 2000 levels by 2025; and finally, that energy efficiency is to improve across all sectors so that when compared with 2005 levels,. n. al. i n U. v. overall energy intensity is reduced 20% by 2015, and 50% by 2025.. Ch. engchi. Whether or not these goals are sufficiently ambitious is certainly open to debate, and would require an additional level of analysis to explore fully, suffice it to say that the means by which the government intends to realize these particular set of targets are referenced in the Comprehensive Regulatory Framework portion of the document. The most important of these instruments (certainly from the perspective of developing a. 20. The strategies and goals outlined in the Framework can be viewed as an extension of the decision making undertaken at Taiwan‟s 2nd National Energy Conference in 2005 (which included conservative targets for renewable energy production and support for legislative efforts to hasten passage of the Act), and the 2007 meeting of the government‟s Strategic Review Board (under the auspices of the Science and Technology Advisory Group of the Executive Yuan) which discussed similar goals for Taiwan‟s total renewable energy capacity.. 28.
(30) domestic solar PV market) is the Act Governing Development of Renewable Energy (再 生能源發展條例) signed into law on 8 July 2009.. 4.2.2. The Act Governing Development of Renewable Energy (2009). This landmark piece of legislation finally establishes and formalizes the role of generators of renewable energy as (at least notionally) equal participants (and potential competitors) in Taiwan‟s electricity supply network. In addition to setting specific targets with regard to total renewable energy capacity to be installed and over what time period,21 the Act and its supporting legislation provide specific guidelines, procedures,. 政 治 大. and incentives (like the FIT and capital subsidies) to allow producers of renewable. 立. energy (wind, solar, hydro, biomass etc.) to enter the market and supply and sell energy. ‧ 國. 學. to Taiwan‟s grid.. ‧. Just as the importance of the Act for the development and growth of a renewable energy sector can‟t be overstated, however, neither can the consequences of getting it wrong. We. Nat. sit. y. now turn our attention to understanding the development, current health, and functioning of the Act, as it applies to the growth of a domestic solar PV market. As has already been. io. n. al. er. mentioned, since the passage of the Act only 4MW22 of solar PV capacity has been. i n U. v. successfully installed.23 What might explain this slow roll-out of solar PV? In the first. Ch. engchi. instance, and somewhat benignly, is the slow formulation and release of key details which would actually allow the legislation to function; around six months elapsed between the passage of the Act in July 2009 and the publication of the FIT Formula and 21. Article Six of the Act (第六條) sets a target of between 6,500MW-10,000MW of renewable energy capacity to be installed within 20 years of it first taking affect (8/7/09). The MOEA, in its Renewable Energy Policy Directions, Decision Making and Implementation (再生能源之政策方向,決策流程及執行 情形) report (unpublished), sets a specific target of 2,500MW of solar PV capacity to be available by 2030 with total renewable energy capacity expected to reach 10,858MW (slightly higher than the figure that appears in the Act). 22. By the end of 2010 total cumulative installed solar PV capacity was supposed to have reached 75MW (64MW was anticipated to have been added in 2010). 23. In order to reach full compliance, and begin selling electricity under the FIT scheme, a completed solar PV installation must first be tested, certified, and then registered by the BOE.. 29.
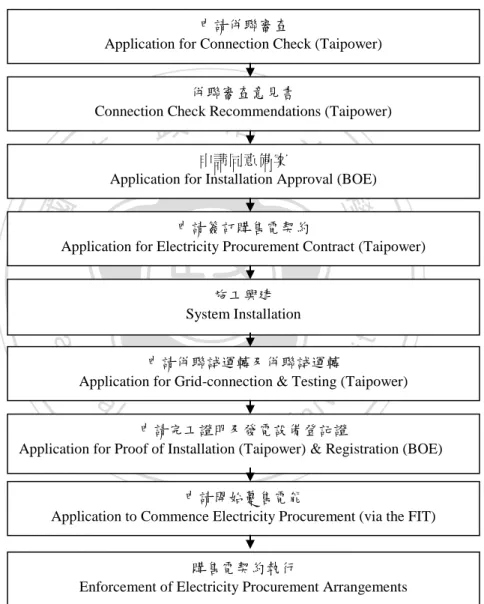
(31) applicable rates on January 25, 2010; it took over nine months to complete and publish relevant sub-rules (再生能源發展條例子法) in support of the legislation on April 30. And while it‟s difficult to criticize the MOEA for exercising due diligence in this matter, these processes should (and probably could) have been expedited to capitalize on momentum generated by passage of the Act, and subsequent demand for renewable energy as evidenced by the number of new applications the BOE received24.. Recent Developments: Negotiating the (New) Applications Process. An additional, and largely avoidable, reason for the slow progress is the complicated and. 政 治 大 been further complicated 立 by the major changes proposed to key parts of relevant. time-inefficient nature of the administrative and applications process, a process that has. ‧ 國. 學. legislation (e.g., the Draft Amendments to the Renewable Energy Installations Approval Process - 再生能源發電設備認定辦法修正草案總說明) – MOEA, 2011a). Figure 2. ‧. (over page) attempts to illustrate the various steps involved with securing approval for a new solar PV project.. sit. y. Nat. io. er. Prior to the proposed amendments, initial approval was to be sought from the BOE, with Taipower subsequently needing to verify the project before work could begin: should the. n. al. Ch. i n U. v. changes become law, however, the responsibility for vetting new projects will reside with. engchi. Taipower, with applicants first needing to satisfactorily meet the requirements set forth in the Application for Connection Check (申請併聯審查) process.25 Applicants who under the old system had had their new projects approved by the BOE, or approved but not. 24. Between 8 July 2009 and 23 December 2010, the BOE had received applications for 1,565 solar PV projects (216MW) and approved 1,029 (151MW) of them. Of those 1,029 cases, however, only 406 (74MW) passed inspection by Taiwan Power. 25. According to Article Six (第六條) of the Draft Amendments for Renewable Energy Installations Approval Process (再生能源發電設備認定辦法修正草案總說明), applicants must first obtain the Connection Check Recommendations (併聯審查意見書) from Taipower before being eligible to apply for similar approval from the BOE – Application to Approve Installation (申請同意備案).. 30.
(32) signed a contract with Taipower, will be asked to begin the process again according to the new rules.26. Figure 2: New Administrative Procedures Based on the Draft Amendments to the Renewable Energy Installations Approval Process 再生能源發電設備認定辦法修正草案總說明 申請併聯審查 Application for Connection Check (Taipower) 併聯審查意見書 Connection Check Recommendations (Taipower). 政 治 大 申請同意備案. 立Application for Installation Approval (BOE). ‧ 國. 學. 申請簽訂購售電契約 Application for Electricity Procurement Contract (Taipower). sit. y. ‧. Nat. 施工興建 System Installation. er. io. 申請併聯試運轉及併聯試運轉 Application for Grid-connection & Testing (Taipower). al. n. v i n C申請完工證明及發電設備登記證 h e n g c(Taipower) h i U & Registration (BOE) Application for Proof of Installation 申請開始躉售電能 Application to Commence Electricity Procurement (via the FIT) 購售電契約執行 Enforcement of Electricity Procurement Arrangements Notes: The above figure is a simplified representation of the actual application and approvals process for electricity procurement via the FIT, modified from the original – Taiwan Power Renewable Electricity Procurement Procedures (台電公司再生能源電能收購作業流程) – and available from the Taipower website (Taiwan Power Corporation, 2010).. 26. Readers should refer to the newly inserted Article Eighteen (第十八條) of the Draft changes.. 31.
(33) Besides the confusion associated with these changes, an enhanced role for Taipower may also impede the approvals process and subsequent growth in the residential solar PV market; Taipower currently generates, supplies, and sells the majority of Taiwan‟s electricity. With the introduction of the Act and these new Draft measures, however, Taipower is now also charged with fostering the growth of a competing (and privately owned) renewable energies sector. It‟s conceivable that Taipower, finding it increasingly difficult to maintain its own bottom line,27 will delay processing a higher proportion of new projects should they impact significantly on business operations. In the last of the major changes, a newly inserted clause (Article Five – 第五條) in the. 政 治 大 altogether any new renewable developments – no detail is provided as to what would 立 happen to applications already in process – so that in addition to Taipower functioning as Draft grants the BOE (and its overseeing body, the MOEA) the right to delay, or halt. ‧ 國. 學. primary gatekeeper for all new applications, the BOE may (at anytime) also decide to apply the brakes.. io. sit. y. ‧. Nat. Additional Obstacles: A Cap on Renewable Energy. n. al. er. A final obstacle embedded in the Act itself, is the cap on renewable developments as. i n U. v. described in Article Six (第六條). Article Six caps total renewable developments at. Ch. engchi. between 6,500MW to 10,000MW of capacity within 20 years of operation of the Act,28 with solar PV expected to account for approximately 2,500MW of that capacity. While these figures look impressive (10,000MW is around 20% of Taiwan‟s current total installed electricity generating capacity) on paper, they must be put into perspective.. 27. An expansion of solar PV (and other renewable energy applications) entails significantly more resources to be diverted to the processing of applications, carrying-out of inspections, and facilitation of gridconnections. Supposing renewables gain a significant foothold in Taiwan‟s energy market, Taipower‟s sales of electricity (generated from traditional sources) will also likely suffer. 28. The final target is to be reviewed by the MOEA once renewable capacity reaches 5000MW.. 32.
(34) In the last five years, Taiwan has added approximately 4,000MW of generating capacity mostly in the form of LNG-fired power stations (BOE, 2010). Were growth in generating capacity to continue at this rate, and supposing the government could actually reach its target of 10,000MW of renewable capacity, by 2030 Taiwan would see around 15% of its total electricity generating capacity supplied by renewable energy, but also a huge leap in the total amount of energy derived from non-renewable sources (from 42,321MW in 2009 to approximately 53,984MW by the end of the Act‟s operational period).. By enforcing a cap, the government is not only effectively limiting (prematurely and artificially) the extent to which a renewables market can grow in Taiwan, but also. 政 治 大 to 2000 levels by 2025) and renewable energy targets (8% of total electricity output). 立 This seems especially unfortunate, given that solar PV technology should become. impacting (negatively) on the ability of Taiwan to reach its long-term emissions (a return. ‧ 國. 學. increasingly cost competitive after cost buy down and learning effects accumulate over time,29 and the fact that Taiwan is also one of the world‟s largest manufacturers and. ‧. exporters of solar PV technology.. y. Nat. sit. As touched on in the literature review earlier, another potential consequence of enforcing. er. io. a cap is the introduction of additional volatility into the local renewable energy market.. al. n. v i n rush to install new systems justCprior cap being reached. As has been seen in other h etonthe gchi U Investors wishing to capitalize on government support for solar PV, for example, may. markets, most notably Spain, this disproportionate and rapid uptake may drive up costs for renewable support programs in the short term, and disrupt supply chains and. sustainable growth in the longer term. This may, then, be one reason why the government has added Article Five to the Draft – as an emergency brake should renewable installations under the FIT scheme become too popular with investors.. 29. According to the IEA (2010a), the average price of grid-connected systems (although varying widely between PVPS member nations) was $4.8 USD per Watt, more than 30% lower than the 2008 price.. 33.
(35) Additional Obstacles: the FIT Schedule and Electricity Pricing. Returning now to a key plank of the Act, and the mechanism by which renewable energy is theoretically able to compete with traditional forms of energy generation, the FIT. Part of the reason for delays in formalizing the FIT arrangements (and the slow pace of new installations) has been the difficulty in setting an appropriate (or attractive enough) FIT pricing schedule. This is evidenced by the number of hearings the BOE conducted in the lead up to the policy release - between the formation of the Pricing Committee on 1 September 2009 and the publication of the FIT formula and applicable rates on 25 January 2010, the Committee met five times and conducted two public hearings30.. 政 治 大 government, there has been no shortage of confusion and policy on the run. 立. And despite what has seemed like extensive consultation and deliberation from the. ‧ 國. 學. As reported on earlier, the government on 17 December 2010 suddenly announced that solar PV applicants that had signed a contract with Taipower for electricity procurement,. ‧. but not able to complete work on projects before 31 December would no longer be. y. Nat. eligible for the (higher) 2010 FIT rate and subsidy program (equivalent to NT$50,000 per. io. sit. KWp of installed capacity). Having signed a contract in good faith with Taipower for. er. 2010 rates, new investors would it seemed be forced to accept 2011 rates.. al. n. v i n C hCommittee (perhaps That was the case until the Pricing e n g c h i U responding to criticism from. solar industry groups and members of the public) on 31 January of this year, released the new FIT guidelines and pricing schedule. As it stands now, applicants who had signed a contract before 17 December 2010 and completing construction before 28 February 2011 are eligible for the 2010 rates. Applicants who had signed a contract last year but completing construction between 28 February and 31 May of this year will instead receive the reduced 2011 FIT rate. Finally, applicants that had signed a contract last year. 30. The debate between government and renewable energy generators remains ongoing, however; the Taipei Times reported in February last year, for example, that German firm Infravest (英華威集團), Taiwan‟s only private wind generator would cease operations citing „a lack of confidence‟ in the government‟s renewable energy strategy and uncompetitive FIT rates for wind energy (Tan, 2010).. 34.
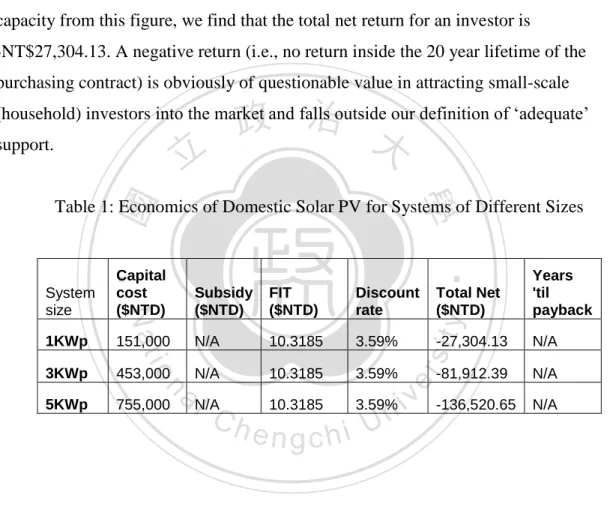
(36) but who complete construction after 31 May will have to „bid‟ (details are unclear) on their respective FIT arrangements.. These problems are relatively superficial, however, compared with the difficulty that the government faces in balancing the interests of industry (and other large consumers of electricity) on the one hand, and the growth of a renewable energy sector (as mandated in the Framework and the Act) on the other. Put quite simply, the cost of electricity in Taiwan is much too low, putting downward pressure on the FIT (the cost of purchasing electricity from solar PV sources is already more than three times the current retail price of electricity and significantly higher again when compared with wholesale energy. 政 治 大 concerned by what they see as changes to the status quo and a potential increase to their 立 operating costs if forced to subsidize the FIT through higher electricity prices; renewable prices31) and attracting criticism from all sides; Taipower and industry would be. ‧ 國. 學. providers and private investors, meanwhile, will find it difficult to compete because the FIT offers only marginal returns whilst also carrying a substantial amount of risk should. ‧. the government keep changing the goal posts on procurement policy.. y. Nat. sit. And while this problem seems intractable – the result of Taiwan‟s export oriented. er. io. economy combined with a centralized (state dominated) approach to management of. al. v i n C h problems associated problematic or not, due to procedural e n g c h i U with the application and n. energy grid issues – we don‟t actually know whether the current FIT rates are. approvals process as reported on earlier. That is, too few solar PV applicants have. completed, registered, and finally sold electricity to the grid via the FIT for us to make an informed judgment about this. In the next stage of the analysis, however – The Market Barriers Perspective – we attempt to determine whether the current subsidy and FIT arrangements are sufficiently attractive (at least in theory) to attract new investment in solar PV.. 31. For a 1-10kW solar PV installation the government is offering a FIT rate of NT$10.3185 per KWh (MOEA, 2011). The current retail price is approximately NT$2.9 per KWh for residential users, and NT$2.46 per KWh for industrial purposes (IEA, 2010c). Taiwan‟s FIT rate, incidentally, is significantly lower than South Korea‟s (NT$15.7) who also has comparable retail rates for electricity.. 35.
(37) 4.2.3. Future Directions Given the difficulty associated with negotiating revisions to the application and approvals process, and the new FIT arrangements, investors might reasonably ask „why bother‟? Is the government actually serious about developing renewable energy in Taiwan, and solar PV in particular? Perhaps one explanation for the government‟s slightly schizophrenic approach to things, besides the problems over electricity pricing, is that a much larger debate continues within government, industry, and academic circles as to what the makeup of Taiwan‟s electricity network should look like in ten, twenty or thirty years from now.. 政 治 大 This section does not attempt to provide any sure answers with regard to Taiwan‟s future 立 energy mix, suffice to say that some clues are provided in the state of ongoing capacity. ‧ 國. 學. building projects in Taiwan. In 2009, nuclear energy accounted for 5,144MW (or 10.72%) of Taiwan‟s generating capacity and 18.1% of total output (41,571Gwh) (BOE, 2010).. ‧. And while the percentage of total electricity generated from nuclear sources has been. y. Nat. shrinking (from 33% in 1989 to the current figure), this situation is likely to change again. sit. should construction on Taiwan‟s controversial32 Fourth Nuclear Power Plant finally reach. n. al. er. io. completion, and plans to extend the lifespan of its current three nuclear power plants also be enacted (Huang et al., 2010).33. Ch. engchi. i n U. v. The importance of nuclear power to Taiwan‟s overall energy framework has, similarly, been underlined in a number of major policy forums and documents where the direction of future energy supply was discussed; as reported on by Liou (2010), the conference summary of the 2nd National Energy Conference (2005) made specific mention of the importance of proceeding with Taiwan‟s Fourth Nuclear Power Plant; the Framework (2007) urged a reconsideration of „nuclear power as no-carbon energy option‟ in efforts 32. Aside from the obvious environmental and security issues associated with long-term storage and management of nuclear waste, the Plant is reportedly situated in close proximity to several geographical fault lines (Loa, 2010). These safety concerns are in addition to cost blow-outs on the project in the order of NT$100 billion – Taipei Times (2010). 33. According to Huang et al. (2010), the government has plans to extend the operating life of these nuclear plants by 20 years, commencing in 2018.. 36.
(38) to increase energy supply diversity; and at the 3rd National Energy Conference (2009), a degree of controversy surrounded the decision to allocate part of the renewable energies development budget to supporting nuclear power instead.. But while there has been no shortage of criticism aimed at the government over its commitment to the development of nuclear power, the enthusiasm with which Taiwan‟s successive administrations have proceeded is not particularly hard to understand.34. For Taiwan to meet the targets set out in policy documents and existing legislation like the Framework and the Act, it will need to not only enhance current energy conservation. 政 治 大 capable of producing base-load amounts of power in the system – in government parlance, 立 „low emissions‟ or „low carbon energy‟ refers to nuclear, LNG, and other renewable efforts but also expand quite significantly the percentage of „low emissions‟ alternatives. ‧ 國. 學. energy alternatives. The nuclear „solution‟, however, would appear to suit both the government who is looking for short to medium-term reductions in carbon emissions, and. ‧. the state-owned Taipower which would retain control of a large portion of centralized. y. Nat. generating capacity – a scenario unlikely to play out were distributed renewable energy. sit. applications expand to partially replace traditional (more carbon-intensive) forms of. er. io. electricity generation.. al. n. v i n C hgovernment for developing This preference of the Taiwanese the „low emissions‟ suite of engchi U technologies and infrastructure is not restricted to nuclear generation: coal and oil-fired power stations, whilst still occupying a significant portion of the energy supply sector (approximately 47% of installed capacity and 57% of total output), have seen their relative importance diminish as LNG catches up – approximately 4,000MW of LNGfired capacity was added in the last five years (2004-2009) with LNG now representing 31% of Taiwan‟s total generating capacity and 20% of its total output (BOE, 2010). This. 34. Just prior to the submission of this thesis, Japan experienced a potentially catastrophic situation at one of its nuclear plants, caused by a severe earthquake and tsunami in March of this year. This event has served to reinvigorate the debate about the future of nuclear power in Taiwan.. 37.
數據
+6

Outline
Energy Situation in Taiwan
The Act Governing Development of Renewable Energy (2009)
Future Directions
Taiwan Compared: Financial Support Measures
South Korea
Additional Financial Strategies & Incentives
Developmental Features & Systemic Inertia
Foreign Investment &
Part IV: Interim Conclusion(s) & Key Findings
相關文件
– Local miss rate— misses in this cache divided by the total number of memory accesses to this cache (Miss rate L2 ). – Global miss rate—misses in this cache divided by the total
What was more surprising, when the sides of the two equilateral polygons changed at a certain rate, the pattern of the generated graph would become a tessellation.. Then we could
To enhance English Panel Chairpersons’ understanding of their roles as curriculum leaders and their capacity to incorporate the major updates of the English Language Education
• enhance teachers’ capacity to integrate language arts rich in cultural elements into the school- based English language curriculum to broaden students’ understanding of the
Schools may strategically enhance the professional capacity of teachers in curriculum leadership, learning and teaching strategies and assessment practices through participating
These programmes are operated by 11 degree-awarding self-financing institutions registered under the Post Secondary Colleges Ordinance (Cap. 320) or statutory
In my opinion, the financial statements give a true and fair view of the financial position of the HKSAR Government Scholarship Fund as at 31 August 2021, and of its
a) Visitor arrivals is growing at a compound annual growth rate. The number of visitors fluctuates from 2012 to 2018 and does not increase in compound growth rate in reality.
