I
Introduction
Taiwan is the highest region in the world for the incidence and prevalence rates of renal diseases (Burrows et al., 2010), according to the report of United States Renal Data System (USRDS) in 2007. There are about 50,920 hemodialysis patients in Taiwan, and the number of patients is still increasing. For hemodialysis patients, heart failure is a common complication. Improper care may cause accidents and worsen the disease. Patients’ physical monitoring is easily interrupted when nurses in a hemodialysis center joggle many tasks at a time. In the previous research, Chen et al. investigated the relationship between behavior of hemodialysis patients and satisfaction with the dialysis center in Taiwan, and indicated that quality of medical care was disappointed (Chen et al., 2008). Therefore, improvement of
the quality of hemodialysis remains an important issue. Intradialytic hypotension (IDH) is a common complication during hemodialysis. The reason has been inferred that the osmotic pressure is increased to refill from the intracellular space when fluid is removed (Locatelli et al., 2010). Excessive ultrafiltration with inadequate vascular refilling induced hypotension during hemodialysis. In the past, the definition of IDH was multiform and related to the decreasing blood pressure during hemodialysis. Tislér et al. indicated that IDH could be defined by the systolic blood pressure less than 90 mmHg and the change range of systolic blood pressure greater than 30 mmHg during hemodialysis (Tislér et al., 2003). Another IDH was defined as at least three episodes of a decrease in systolic blood pressure (by at least 20 mm Hg to 100 mm Hg) accompanied by symptoms (e.g.
*Partly presented at the 5th International Symposium on Machinery and Mechatronics for Agricultural and Biosystems Engineering in April 2010
*1 Department of Recreation Sports and Health Promotion, Asia-Pacific Institute of Creativity, No. 110, Syuefu Rd., Toufen Township, Miaoli County 351, Taiwan; [email protected].
*2 Department of Bio-Industrial Mechatronics Engineering, National Taiwan University, No. 1, Sec. 4, Roosevelt Rd., Taipei 10617, Taiwan
*3 CIAM Member, Department of Bio-Industrial Mechatronics Engineering, National Taiwan University, No. 1, Sec. 4, Roosevelt Rd., Taipei 10617, Taiwan; [email protected]
*4 CIAM Member, Corresponding author, Department of Bio-Industrial Mechatronics Engineering, National Taiwan University, No. 1, Sec. 4, Roosevelt Rd., Taipei 10617, Taiwan; [email protected]
§ Equal contributors
An Implementation of a WSN-based Medical Monitoring System ― A
pilot study of the Blood Pressure Monitoring of Hemodialysis Patients
Wen-Dien CHANG
*1,§, Tzu-Shiang Lin
*2,§, Joe-Air JIANG
*3, Chang-Wang LIU
*2, Chia-Pang
CHEN
*2, Da-Wei LAI
*2, Hsu-Cheng LU
*2, Chung-Wei YEN
*2, Ping-Lang YEN
*4Abstract
Intradialytic hypotension (IDH) is a very common complication during a hemodialysis. IDH may lead to nausea, vomiting, or anxiety. In some severe cases, there may cause shock or death. Hemodialysis generally takes 4 to 6 hours each time, 2 or 3 times a week. Currently, the hemodialysis procedure may lead to risky low blood pressure due to lack of taking blood pressure by medical staff. Therefore, the purpose of this work is to use the technologies of wireless sensor networks (WSN), global systems for mobile communications (GSM), and a MySQL database to develop a PC-based gateway and an automatic monitoring system to collect physiological data during hemodialysis and continuously monitor patient’s IDH status. The clinical definition of IDH during hemodialysis is that a decrease in the systolic pressure of at least 20 mmHg and a decrease in the mean arterial pressure (MAP) of at least 10 mmHg. Our system uses a threshold-based algorithm to monitor and record the systolic and mean arterial blood pressure readings. The GSM module is utilized to send medical staff a warning message, and the message is displayed on the monitor if the readings reach a critical point. The experimental results show that the designed monitoring system is highly reliable.
dizziness, blurred vision, nausea, vomiting, cramps, or fatigue) in 50% of HD treatments over one month (Hoeben et al., 2002). According to the Kidney Disease Outcomes Quality Initiative (KDOQI) Guidelines of National Kidney Foundation (NKF) (Nelson and Tuttle, 2007), IDH is defined as the decrease of systolic blood pressure during hemodialysis more than 20 mmHg, and the decreasing of MAP more than 10 mmHg. The definition is used as the monitoring criterion in our study.
Many previous studies tried to design the assisted devices for monitoring hemodialysis patients' blood pressure and reducing working loading of medical staffs (1, 2, 3). The dialysis process system designed by Banet and King designed (1) can transmit the blood pressure values of hemodialysis patients to the controller for analyzing and adjusting the dialysis process within the hemodialysis machine. But this system was only applied to a specific hemodialysis machine. Du et al. tried to utilize ZigBee wireless technique, and establish a mesh network for monitoring blood pressure automatically (2). The data could be stored in medical record system for display and further analysis. However, this system is too simple to be practical in IDH. Jiang et al. also tried to use the wireless sensor networks (WSN) and global systems for mobile communications (GSM) to collect monitor the blood pressure during hemodialysis (3). The data storage of bold pressure in MySQL database could be demonstrated. Wu et al. used the same WSN technique to detect blood pressure, and indicated that the outcomes of ICH were effective (4). The previous two studies point out that the limitations of clinical application were due to unsuccessful packet receiving rate and lack of multi-wireless sensor node teat. Therefore, in this paper, technologies of the WSN, GSM, and a MySQL database have been integrated in order to improve the receiving rate of this automatic monitoring system so that an automatic vital sign monitoring and alerting system can be
realized in IDH application.
II Materials and Methods
WSN-based medical monitoring system was devised by Bioelectromagnetic Laboratory (National Taiwan University, Taiwan). The monitoring system consists of the sensor of blood pressure, WSN for the indoor transmission, GSM for the telecommunication, and a database for data collection (Wu et al., 2009). The structural diagram is shown in Fig. 1. In the prior laboratory examination (n = 6), this system had high reliability (0.94 ~ 0.99) and well success ratio (94.84%) of physical data transmission (Wu et al., 2009). This monitoring platform was applied to detect the simulate blood
pressure of IDH, and was recited individually as follow.
1. System architecture
We integrated the technologies of GSM, Internet, and WSN to construct a WSN-based monitoring system which was used to monitor the vital signs of hemodialysis patients. This system was verified in an indoor classroom. The system architecture includes two parts: the physical WSN modules and the post-processing control platform (PCP). The structure of the physical WSN module is shown in Fig. 2. A physical
Fig. 1 The structural diagram of the WSN-based medical monitoring system
Fig. 2 The structural diagram of the physical WSN module
WSN module is composed of a wireless sensor node (Taiwan: Wireless Sensor Network Center, 2007), a voltage conversion circuit, a pressure sensor, a blood pressure meter (USA: OSTAR, 2006), an oxygen concentration meter, and a body temperature sensor. The physical WSN module uses DC 12 V for power supply. The measured data obtained from the medical meters were transmitted to the wireless sensor node, Octopus II, via the universal asynchronous receiver transmitter (UART) and the analog-to-digital converters (ADC). The wireless sensor node, Octopus II, is shown in Fig. 3. The sensor node transmits measured data by the wireless communication chip, CC2420, which supported the IEEE 802.15.4, the Zigbee specification, and TinyOS (USA: Texas Instruments, 2007 and USA: Zigbee Alliance, 2009). Octopus II uses the 2.4 GHz radio for wireless transmission, and the indoor communication range of the sensor node is 25 ~ 50 meters. Controlled by the TinyOS program, the Octopus II dictates the meters and sensors to measure systolic blood pressure, diastolic blood pressure, pulse, blood oxygen concentration, and body temperature, and sends the readings to the PCP.
The PCP is composed of a graphical user interface (GUI) developed by Laboratory Virtual Instrument Engineering Workbench (LabVIEW) program, a GSM module (USA: Wavecom, 2009), a wireless sensor node, and a MySQL database. The structure of the PCP is shown in Fig. 4. The wireless sensor node, Octopus II, is used to receive packets of measured data from WSN modules. The sensor node transmits those measured data to the LabVIEW program via universal serial bus (USB) interface. The LabVIEW program connects to the MySQL database via the open database connectivity (ODBC) and
― A pilot study of the Blood Pressure Monitoring of Hemodialysis Patients Internet. The sensing data is stored in a MySQL database
server. Through the GSM module, an alert can be immediately sent to nurses if IDH occurs.
Fig. 3 The wireless sensor node (Octopus II)
Fig. 4 The entity diagram of the PCP
2. An acknowledgement mechanism
In order to confirm whether the packet transmitted from the WSN module is received by the PCP, the acknowledgement mechanism is proposed to avoid the packet loss. According to the proposed acknowledgement mechanism, the PCP will transmit an acknowledgement packet to the WSN module if the PCP receives the packet transmitted from the WSN module. If the WSN module does not receive the acknowledgement packet transmitted by the PCP, the WSN module will transmit the sensing packet repeatedly five times in 10 seconds. In other words, the WSN module stops transmitting the sensing packet to PCP when the WSN module receives the acknowledgement packet transmitted from the PCP. The data packet loss corresponds to that the PCP does not receive any data packet in one cycle.
3. Definition of the detected parameters
In this work, the IDH identification is based on a definition proposed by KDOQI Guidelines (Nelson and Tuttle, 2007). NKF define that IDH occurs when the decrease of systolic blood pressure in hemodialysis is more than 20 mmHg, and the decrease of mean arterial pressure (MAP) during hemodialysis is more than 10 mmHg. The MAP in the
PCP is formulated by 1 1 2 MAP ( ) 3 3 3 d s d s d P P P P P , (1)
where MAP is mean arterial pressure, Pd is the diastolic blood pressure, and Ps is the systolic blood pressure.
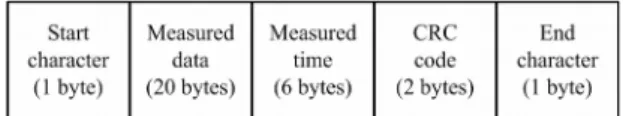
4. Design of data packets
The data packet includes the starting character, the packet length, the sensing data, and the ending character. The data packet form is shown in Fig. 5. The start character indicates the beginning of the packet. After the PCP receives the start character, the PCP stores all the data transmitted from the WSN module. The packet transmission completes until the PCP receives an end character. However, some information packets may be lost because the transmission is hampered by the environmental factors. When the PCP
receives a complete packet, PCP calculates the bytes from start character to the end character and checks the length of the bytes to see if it is consistent with the packet length. The PCP also applies cyclic redundancy check (CRC) code to check the completeness of the data packet (Ritter, 1986). If the data packet is valid, PCP stores the sensing data to the MySQL database. If the data packet is invalid, PCP ignores the packet. Through such a design, the proposed system could ensure the validity and completeness of data packets.
Fig. 5 The data packet form of the monitoring system.
5. Graphical user interface (GUI) and MySQL database of PCP
Figure 6 is the GUI of PCP. The GUI is able to show the sensing data in real-time and provides the history enquiry function of sensing data. The GUI is designed for multi-users, and the manager is able to observe vital signs of multi-patients. Figure 7 is the interface of LabVIEW program interface for patient’s information input. The LabVIEW program of PCP is able to input patients’ personal information, emergency contact, and emergency call. The LabVIEW program also provides the function for sensing data output, and the output function has three kinds
of output formats which are PDF, excel, and txt files. MySQL is one of the popular open source databases, and it could run on most of the operating systems of computers. Using the MySQL database, PCP is able to record the monitoring data. The monitoring information collected by the proposed system includes diastolic blood pressure, systolic blood pressure, pulse, body temperature, and blood oxygen concentration. The PCP records the monitoring information in corresponding rows, according to the patient’s id and time of measurement. All physiological data are stored in the MySQL database as shown in Fig. 8.
Fig. 6 An illustration of GUI used in PCP
Fig. 7 The interface of LabVIEW program for patient’s information input
Fig. 8 An illustration for MySQL database
6. Data processing of the medical monitoring system
The data processing of the designed medical monitoring system consists of three sub procedures. The first part is that nurses deliver waking commands to WSN modules through the PC-based gateway in the ward. A waking command is written as ‘NodeWake, NodeID-PName’. If the sensor node receives a waking command, the corresponding sensor node and its equipped medical meters will be awaken from a sleeping mode. All the sensor nodes send a packet to the PCP when they received the waking commands. The PCP transmits the detecting commands to the awaked WSN modules. A detecting command is written as ‘VitalDetect, NodeID-PName’. After detecting vital signs, the data that includes various items (Node ID, Name, Systolic Pressure, Diastolic Pressure, Pulse, Oxygen Concentration, Body Temperature, and Time) is transmitted back to the PCP through wireless communication.
The second part of data processing is that all medical sensors start working if the pressure value of a sensor node installed under the hospital bed is more than a prescribed threshold. In such case, the medical sensors activate when a patient lies on the bed. After sensor node acquires vital signs, the data are transmitted back to the PCP. The flowchart of the second part of data processing is shown in Fig. 9.
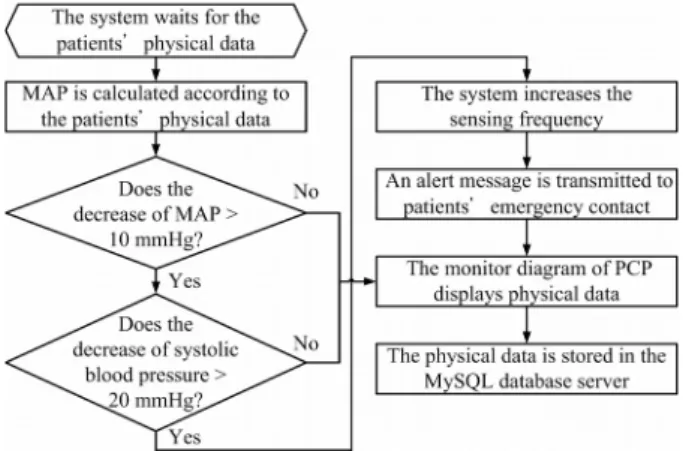
The third part of data processing is the PCP uses Equation (1) to obtain the mean arterial pressure. The flowchart of the third part of data processing is shown in Fig. 10. After the PCP receives the monitoring data from the WSN module, the MAP is calculated according to the patient’s physical data. If the MAP is larger than 10 mmHg and the decrease of systolic blood pressure is larger than 20 mmHg, the system increases the frequency of sensing. Furthermore, an alert message can be immediately sent to the family and nurses. The monitor of PCP can also display an alert message if IDH occurs, and the sensed physiological data are recorded in the MySQL database server. Finally, the measured vital signs are classified into different parameters and stored into different fields in the MySQL database
server.
III Experiment Design for Performance
Assessments
WSN-based medical monitoring system is built for IDH patients, but the realistic simulations are inadequate. In this pilot study, the mimic space was set like a hospital hemodialysis center and the monitoring procedures were simulated. Due to the government regulations (Taiwan: Department of Health, Executive Yuan, 2006), however, the simulation can only take place in a classroom
(Bioelectromagnetics laboratory of National Taiwan University, Taiwan). The performance evaluations for packet receiving and acknowledgement mechanism of this system were tested by two experiments. The classroom is as shown in Fig. 11, and the classroom area is 8 m 12 m.
Fig. 9 The working flowchart of the WSN module
Fig. 10 The data receiving flowchart of the PCP
1. Performance evaluation for packet receiving
This classroom includes ten hospital beds and ten wireless sensor nodes. In Fig. 11, one of the nodes is called the base node, which is placed at Q to receive the data packets and connected to a personal computer. The other ten nodes are placed at hospital beds (node A, node B, …, node J) to send physiological data, respectively. A data packet is transmitted every five seconds, a total of 100 times in a round. The experiment in each node arrangement repeats five times and then the average successful receiving rate in a classroom will be calculated.
2. Performance evaluation for the acknowledgement mechanism
In order to verify the performance of this system, one experiment was conducted to analyze the relationship between the acknowledgement mechanism and successful packet receiving rate. During the 10-hours testing interval,
― A pilot study of the Blood Pressure Monitoring of Hemodialysis Patients we sent the detecting commands 50 times to one WSN
module. In the experiment, the acknowledgement mechanism was inactivated in the first 25 transmissions, but activated in the remaining transmissions.
Fig. 11 The experimental deployment in a classroom
IV Results and Discussion
1. Test for successful packet receiving rate of the medical monitoring system
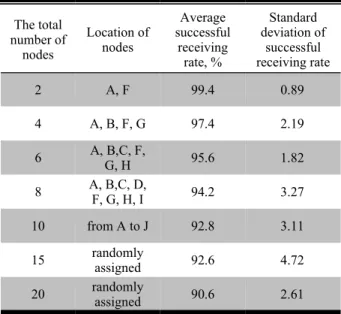
The experimental result of the performance evaluation for packet receiving is shown in Table 1. According to government regulations, the maximum number of beds is ten in a ward. The successful packet receiving rate remains higher than 90.6% when the number of node is increased to 20. The average successful packet receiving rate ranges from 90.6% to 99.4%. This result shows that this system has high successful packet receiving rate.
Table 1 The relationship between the successful packet receiving rate and the number of the activated nodes The total number of nodes Location of nodes Average successful receiving rate, % Standard deviation of successful receiving rate 2 A, F 99.4 0.89 4 A, B, F, G 97.4 2.19 6 A, B,C, F,G, H 95.6 1.82 8 A, B,C, D,F, G, H, I 94.2 3.27 10 from A to J 92.8 3.11 15 randomlyassigned 92.6 4.72 20 randomlyassigned 90.6 2.61
2. The acknowledgement mechanism could increase the successful packet receiving rate
The experimental results of performance evaluation for the acknowledgement mechanism are shown in Table 2. The results indicated that acknowledgement mechanism affected the successful packet receiving rate. In the first 25 tests, the average successful packet receiving rate is roughly 88%. After activating the acknowledgement mechanism, the average successful packet receiving rate can be achieved up
to 100%.
When the IDH occurs, the PCP will transmit alerting message to administrator. As shown in Fig. 12, two short messages were sent to the observers during hemodialysis simulation experiments. Fig. 12(a) shows a patient has a bad posture and looses two detections continuously. Fig. 12(b) shows that the decreasing of MAP or the decline of systolic blood pressure exceeds the alert value.
Table 2 Hemodialysis simulation result Experiments of hemodialysis simulation Detectin g (times)
Successful receiving rate, % Without an acknowledg e mechanism With an acknowledg e mechanism 1 5 80 100 2 5 100 100 3 5 80 100 4 5 100 100 5 5 80 100 Average successful receiving rate 88 100
Fig. 12 Alerting messages was sent by PCP (a) message of detecting error (b) alert message of IDH
The experimental result also shows that the average successful receiving rate decreased significantly when the total number of nodes was greater than 8. The reason was that PCP received many data packets in order. It increased the processing speed, but decreased the successful packet receiving rate. The successful packet receiving rate of more nodes had many obstacles to be overcome under environmental interferences. There are substantial differences of environment setup between laboratory and hemodialysis center. Therefore more tests on packet receiving in various hemodialysis center environments will
be needed.
V Summary and Conclusion
The purpose of this work is to collect physiological data during hemodialysis and continuously monitor the IDH status of the patients. We use the technologies of WSN, GSM, and a MySQL database to develop the system composed of the physical WSN modules and the information processing control platform (PCP). The results show that our system can successfully collect patients’ data and use an acknowledgement mechanism to improve the
packet receiving rate until it reaches 100%. In the future, clinical experiments will be conducted.
VI Acknowledgements
The authors would like to thank the National Science Council, Taiwan, for financially supporting this research under Contracts: NSC 2218-E-002-039 and NSC 98-2218- E-002-012. This work was also supported in part by the President of National Taiwan University under the
contract no.: 98R0529-2.
References
Burrows, N. R., I. Hora, P. Cho, R. B. Gerzoff and L. S. Geiss. 2010. Incidence of end-stage renal disease attributed to diabetes among persons with diagnosed diabetes --- United States and Puerto Rico, 1996-2007. MWR Morb Mortal Wkly Rep 59(42):1361-1366.
Chen, C. H., S. J. Wang, Y. Y. Ho and M. H. Wang. 2008. The Relationship between Chronic Hemodialysis Patient Behavior and Satisfaction with the Dialysis Center. Journal of Taiwan Nephrology Nurses Association 7(1):12-25.
Hakim, R. M., R. L. Wingard and R. A. Parker. 1994. Effect of the Dialysis Membrane in the Treatment of Patients with Acute Renal Failure. The New England Journal of Medicine 331(14):
1338-1342.
Hoeben, H., A. K. Abu-Alfa, R. Mahnensmith and M. A. Perazella. 2002. Hemodynamics in patients with intradialytic hypotension treated with cool dialysate or midodrine. American Journal of Kidney Diseases 39(1):102-107.
Joe-Air Jiang et al, “Bio-Information Monitoring System” US Patent Application Publication, April 2011.
Locatelli, F., P. Altieri, S. Andrulli, P. Bolasco, G. Sau, L. A. Pedrini, C. Basile, S. David, M. Feriani, G. Montagna, B. R. D. Iorio, B. Memoli, R. Cravero, G. Battaglia and C. Zoccali. 2010. Hemofiltration and hemodiafiltration reduce intradialytic hypotension in ESRD. J Am Soc Nephrol 21(10):1798-1807.
M Banet and A. J. King, “System for Measuring Vital Signs During Hemodialysis,” US Patent Application Publication, March 2011
Nelson, R. G. and K. R. Tuttle. 2007. The new KDOQI clinical practice guidelines and clinical practice recommendations for diabetes and CKD. Blood Purif 25(1):112-114.
Ritter, T. 1986. The Great CRC Mystery. Dr. Dobb's Journal of Software Tools 11(2):26-34.
Taiwan: Department of Health, Executive Yuan, R.O.C. 2006. Regulations. Available at: http://english.doh.taipei.gov.tw/. Accessed: 01/10/2010.
Taiwan: Wireless Sensor Network Center. 2007. Octopus II
Datasheet. Available at:
http://www.wsnc.ntu.edu.tw/Files/Octopus--_0913_ V1_2 [----].pdf. Accessed: 01/10/2010.
Tislér, A., K. Akócsi, B. Borbás, L. Fazakas, S. Ferenczi, S. Görögh, I. Kulcsár, L. Nagy, J. Sámik, J. Szegedi, E. Tóth, G. Wágner and I. Kiss. 2003. The effect of frequent or occasional dialysis-associated hypotension on survival of patients on maintenance haemodialysis. Nephrol Dial Transplant 18(12):
2601-2605.
USA: OSTAR. 2006. Heart Spectrum Blood Pressure Monitor. Available at: http://www.ostar.com.tw/e02.htm. Accessed:
01/10/2010.
USA: Texas Instruments. 2007. CC2420 Datasheet. Available at: http://focus.ti.com/lit/ds/symlink/cc2420.pdf. Accessed:
01/15/2010.
USA: Wavecom. 2009. Fastrack Supreme: Add GPS, WiFi, Zigbee, Bluetooth and more. Available at : http://www.wavecom.com/modules/movie/scenes/products/inde
x.php?
fuseAction=wirelessCPU&productName=Fastrack_Supreme. Accessed: 01/10/2010.
USA: ZigBee Alliance. 2009. ZigBee Logo and Trademark
details. Available at:
http://www.zigbee.org/About/ZigBeeIntro/tabid/220/ Default.aspx. Accessed: 10/13/2009.
Wu, Y. C., W. D. Chang, T. S. Lin, C. W. Liu, C. H. Hung, C. T. Tsai, C. K. Hsu, C. W. Yen and J. A. Jiang. 2009. A WSN-based Wireless Monitoring System for Intradialytic Hypotension of Dialysis Patients. In Proc. the 8th Annual IEEE Conference on Sensors, 1959-1962. Christchurch, New Zealand. 25-28 October.
Yi-Chun Du, You-Yun Lee, Yun-Yuan Lu, Chia-Hung Lin, Ming-Jei Wu, Chung-Lin Chen and Tain-song Chen, “Development of a Telecare System Based on ZigBee Mesh Network for Monitoring Blood Pressure of Patients with Hemodialysis in
Health Care Centers,” Journal of Medical System, 2010.