行政院國家科學委員會專題研究計畫 成果報告
晶體材料之載子自旋與同調聲子動力學之研究(3/3)
計畫類別: 個別型計畫 計畫編號: NSC93-2112-M-009-007- 執行期間: 93 年 08 月 01 日至 94 年 07 月 31 日 執行單位: 國立交通大學光電工程學系(所) 計畫主持人: 黃中垚 報告類型: 完整報告 報告附件: 出席國際會議研究心得報告及發表論文 處理方式: 本計畫可公開查詢中 華 民 國 94 年 11 月 1 日
NSC92-2112-M-009-014-
( )
20 nm
An apparatus, which can offer femtosecond pulse conversion, characterization and coherent control functionalities on the same platform, has been developed and could be combined with advanced multiphoton optical microscopy for imaging enhancement, selective excitation, and coherent control purpose, etc.
1. Manufacturing industry of advanced optical microscope. Product: adaptive coherent controlled multiphoton luminescent microscope with pulse shaping and compensation;
2. Laser industry. Product: direct complete-field characterization apparatus of femtosecond optical pulse
Femtosecond laser instrument. Product: femtosecond pulse design and conversion
1. New algorithm for rapid search of optimum spectral phase of optical field needed to achieve coherent control;
Pulse conversion, complete-field characterization and adaptive coherent control on the same apparatus;
Direct approach to deduce complete-field characteristics of femtosecond coherent pulse.
1. selective excitation optical microscopy quantum-control; 2. imaging enhancement of multiphoton optical microscopy;
quantum control and manipulation of optical excitation in nanostructured materials; etc.
Content Table
I. Abstract
II. Background and significance III. Methodology
IV. Achievements
IV.A. Optical technologies developed for this research project A1. Blue-to-near uv femtosecond laser pulse generation
A2. Single-shot complete-field characterization of an ultraweak optical pulse A3. 3C strategy of characterization-conversion-control on a single apparatus IV.B. Fabrication of 3D artificial crystals from nano building blocks for enhanced opto-electronic response
IV.C. Coherent phonon generation and phonon spectroscopy of stoichiometric LiNbO3 and quaternary chalcopyrite AgGa(SxSe1-x)2 crystals
IV.D. Magneto-Optical Kerr Effect of self-assembled film of Co2+: doped ZnO quantum dots IV.E Tracking correlative motion of submolecular fragments in novel liquid crystal devices V. Conclusion and self evaluation
Abstract
: ( ) ( )
20 nm
/
-Abstract
Keywords: femtosecond laser, pulse shaping, quantum control, phonon, carrier spin, complete-field
characterization.
The major objective of this three-year research project is to apply femtosecond laser technology for investigating the dynamics of carrier spin and coherent phonon in condensed matters. To achieve this goal, we have developed optical techniques needed for this research, which include: (1) a blue-to-near UV short-wavelength femtosecond laser source for probing wide-bandgap materials; (2) an apparatus for the complete-field characterization of an ultra weak optical signal; (3) an apparatus for enabling femtosecond pulse conversion, characterization and coherent control. We have demonstrated the functionalities of these techniques to verify their usefulness for this research.
In particular, we are interested in new phenomena resulting from an enhanced coupling between electrons and photons at nanometer scales. Photon energy with wavelength of hundreds nanometers had been predicted to be able to localize to a few nanometers by using a proper control of transient optical phase. To prepare the nanostructured quantum systems with enhanced and tailorable magnetic properties, solution growth technique has been developed for the synthesis of magnetic/noble metal core-shell quantum dots and ZnO nanocrystals doped with various magnetic ions. Steady-state and dynamical measurement techniques with a sensitivity of 10-6 rad have been achieved to provide rich information about phonon and spin dynamics. This progress offers an opportunity to probe and control the spin transport dynamics in a low-dimensional quantum-confined system.
II. Background and significance
Coherent quantum control is a cutting edge technology development. By tailoring the profiles of amplitude and phase of an ultrashort laser pulse, coherently controlled light-matter interaction and the resulting guided quantum state evolution become feasible. The purpose of femtosecond coherent control study is not only to control the evolution of a complex system but also to deduce the detailed dynamic mechanism from the optimal laser field used. However, the major difficulty is how to rapidly retrieve the correct field profile for adaptively control of a quantum system in real time.
III. Methodologies
In this project, we had developed an apparatus with freezing phase algorithm appropriate for adaptive quantum control. With the apparatus the desirable optical field characteristics can be verified and be used to selectively excite one type of probe molecule while leave the others in their ground state. Coherent control also offers an additional degree of freedom for distinguishing coherent and incoherent nonlinear optical processes. We had combined scanning optical microscopy with femtosecond pulse shaping technique to selectively mapping the distribution of specific species. This result also reveals an interesting development of coherently controlled contrast enhancement for multiphoton nonlinear optical microscopy.
To analyze ultra-weak light-material interaction in real time, we also developed for the first time a single-shot OPA-FROG, which is capable of characterizing the field completely for signals as weak as several atto joules. For further development, we go one forward step to undertake a challenge of complete-field characterization of advanced photonic materials and devices at the nanometer scales by combining scanning near-field optical microscopy (SNOM) with heterodyne interferometry.
Artificial crystals self-assembled from nano building blocks offer great possibility in many scientific disciplines. This novel approach provides a modular solution for the increasing demand of high functional materials. Nano building blocks such as Au@Fe and Co2+/Mn2+/Er2+ doped ZnO/ZnSe nano dots had been synthesized with wet chemistry. We had successfully assembled 3D artificial crystals with these nano building blocks to yield enhanced opto-electronic response.
IV. Achievements
IV.A. Optical technologies developed for this research project A1. Blue to-near UV femtosecond laser pulse generation
Tunable femtosecond pulses from the blue to the near UV region (380-460 nm) are useful in many applications ranging from wide band-gap materials to biomolecules. Unfortunately, the current tuning range with a 400-nm-pumped type-I BBO optical parametric device only covers from 460-nm to 720-nm in the signal branch and from 900-nm to 2.4 µm in the idler. To solve the problem, we had developed in this project a tunable femtosecond source in the blue and
near-UV region.
This new design is based on a cascading sum-frequency generation in a 405-nm-pumped type I noncollinearly phase-matched optical parametric amplifier. Properties of tuning ranges at various seeding angles, conversion efficiencies, and pulse profiles have been characterized in detail experimentally. The energy conversion efficiency of the SFG is more than 5%. This scheme provides a simple and effective way to extend the tuning range of a 405-nm- pumped type I β-BaB2O4 non-collinear OPA from 460 to 380 nm without the need for extra frequency-up conversion stage. It was also found that the beam quality and the pulse shape of the SFG component are approximately the same as those of the OPA.
A2. Single-shot complete-field characterization of an ultra weak optical pulse
To assist laser diagnosis and signal monitoring, we had developed in the project a novel complete-field technique for characterizing ultra weak optical signal. Our new technique OPA-FROG involves a noncollinear optical parametric amplification (NOPA) process with high optical gain. This feature allows us to increase the detection sensitivity by several orders of magnitude and to characterize extremely weak optical signals. With an uncooled CCD, we found the sensitivity of our OPA-FROG to be 0.8-0.9 femto-joule. With a cooled CCD even higher sensitivity is expected.
To prevent signal instability from persistent optical exposure on sample, we also improve our apparatus to possess single-shot detection capability. The combination of single-shot FROG with high-gain OPA could overcome the drawbacks encountered in both multi-shot FROG and single-shot FROG without gain. The weak optical pulse is amplified by optical parametric amplification process in a nonlinear crystal with a line-shaped pump profile. The resulting line-shaped amplified signal is then imaged onto the entrance slit of a spectrometer and is detected with a two-dimensional CCD camera. The spectral content of the pulse is revealed along the horizontal axis of the OPA-XFROG pattern, and the vertical distribution presents the detailed information about the temporal profile. An entire FROG pattern can be acquired for each laser pulse.
The device has been used in study of mechanism of white-light supercontinuum at high pumping intensity above the threshold of multifilament formation where the signal is irreproducible from shot to shot. By modifying the conventional FROG algorithm we are able to retrieve the full field profile from a single-shot OPA-XFROG trace, the retrieved error is no more than 0.0014.
A3. 3C strategy of characterization-conversion-control on single apparatus
The core issue about this research is to develop a technology platform with improved control capability on light-matter interaction. With this control power in hand, we shall be able to steer photon energy into specific degrees of freedom of materials, to create new materials, to generate new functionality from a device, or even to probe specific molecule within an ensemble of species.
The operational principle is based on the fact that the highest peak intensity corresponds to a complete frozen-phase state of all spectral components. Our experimental and theoretical results reveal several advantages. This freezing phase scheme had been employed to analyze three types of semiconductor saturable absorber Bragg reflectors (SBR) and the influence on phase distortion from subtle structural change in SBR can be revealed clearly.
Our theoretical analysis shows that the freezing phase scheme can yield optimum spectral phase profile for second-harmonic generation (SHG), third-harmonic generation (THG), two-photon absorption (TPA) processes no matter an intermediate single-photon resonant level being involved or not. This freezing phase scheme had been employed for analyzing multiphoton processes in InAs quantum dot saturable Bragg reflector (SBR). The results indicate that the function of InAs quantum dots can be revealed in the spectral-phase sensitivity plot of second harmonic signal. Coherent control contrast enhancement as large as a factor of three can be achieved at regions where the fluorescent peak wavelength differs by only 18 nm. Coherent control study offers an additional degree of freedom for distinguishing coherent and incoherent nonlinear optical processes. Our results suggest the new freezing phase scheme to be useful for various applications which require complete-field characterization and coherent control on one setup.
In particular, we are interested in new phenomena resulting from an enhanced coupling between electrons and photons at nanometer scales. Photon energy with wavelength of hundreds nanometers had been predicted to be able to localize to a few nanometers by using a proper control of transient optical phase. If the technique is verified, an approach to enhance coupling between photon and electron at nanometer scales shall be possible and brand new concepts for photonics are expected. Along this direction, we first explore the possibility of selectively enhancing the two-photon excited photoluminescence from a semiconductor microstructure. For reference, the published journal papers related to the above-mentioned studies can be found in:
1. Chao-Kuei. Lee, J. -Y. Zhang, J. Y. Huang and Ci-Ling Pan, Theoretical and experimental studies of tunable UV/blue femtosecond pulses in a 405-nm pumped type-I β-BaB2O4 non-collinear optical parametric amplifier, J. Opt. Soc. Am B21, 1494-1499 (2004).
2. Jing-yuan Zhang, Chao-Kuei Lee, Jung Y. Huang, and Ci-Ling. Pan, Sub femto-joule sensitive single-shot OPA-XFROG and its application in study of white-light supercontinuum generation, OPTICS EXPRESS 12, 574-581 (2004).
3. C. K. Lee, J. -Y. Zhang, J. Y. Huang and C. L. Pan, Generation of femtosecond Laser Pulses Tunable from 380 nm to 465 nm via cascaded Sum-Frequency Generation and Optical Parametric Amplification with a type-I Non-collinearly Phase Matched BBO Crystal, Optics Express 11, pp. 1702-1708 (2003).
4. M. Z. Chen, Jung Y. Huang, Qiantso Yang, C. L. Pan and Jen I. Chyi, Freezing phase scheme for fast adaptive control and its application to characterization of femtosecond coherent optical pulses reflected from semiconductor saturable absorber mirrors, J. Opt. Soc. Am. B22, 1134-1142 (2005). NSC93-2112-M-009-007.
5. M. Z. Chen, Jung Y. Huang, and Li. J. Chen, Coherent control multiphoton processes in semiconductor saturable Bragg reflector with freezing phase algorithm, Appl. Phys. B 80, 333–340 (2005). NSC93-2112-M-009-007.
IV.B. Fabrication of 3D artificial crystals from nano building blocks for enhanced opto-electronic response
Magnetic nanoparticles (NPs) have generated a great deal of interest because of their unique magnetic properties, which make them very appealing structures from both theoretical and technological points of view. Below a critical size, magnetic particles become single domain and exhibit unique phenomena such as superparamagnetism,1a quantum tunneling of the magnetization,1b and unusual large coercivities.1c The fabrication of these NPs, which can be effected in a number of ways,2 has inspired a wide range of applications within the fields of medical diagnosis, drug delivery, cell separation, and information storage.3 The greatest challenges in the synthesis of iron (Fe) NPs are controlling the particle size and the degree of monodispersity and preventing oxidation. A non-magnetic shell, such as one prepared from gold (Au), surrounding a Fe nanoparticle potentially could serve as a protection layer,4 provide an enhanced optical response through surface plasmon excitation, and present an accessible surface for further functionalization. Three-dimensional (3D) crystals self-assembled from these Fe-Au core-shell NPs (Fe-Au NPs) would not only be interesting model systems for nano-magnetic materials but also could offer great potential for use in single-electron transistors and spin-dependent applications.5
In this project report, we report the successful synthesis of near-monodisperse Fe-Au NPs and their self-assembly into a robust 3D crystalline structure. In addition, we provide evidence from X-ray absorption spectroscopy (XAS) that verifies that the core of each nanoparticle in the self-assembled crystal is pure Fe. We synthesized the Fe–Au NPs using water-in-oil microemulsions in which the dispersity in the sizes of these NPs can be controlled by adjusting the water content.6 We note that an approach toward the self-assembly of Au NPs into a robust 3D nanocrystal was reported recently.7 Scheme 1 depicts the schematic processes we used to synthesize the Fe–Au NPs (steps A–B) and the self-assembly of the 3D Fe–Au crystal (steps C–E). In brief, first we synthesized the Fe–Au NPs in a reverse micelle system comprising a surfactant (cetyltrimetylammonium bromide, CTAB), water (aqueous FeSO4 and HAuCl4 solutions), and an oil (octane), as reported in the literature.4 We then used 1-dodecanethiol in step B to modify the surfaces of the Fe–Au NPs. Finally, we added CTAB and tetraethylorthosilicate (TEOS) to form a self-assembled Fe–Au artificial crystal.6b,7
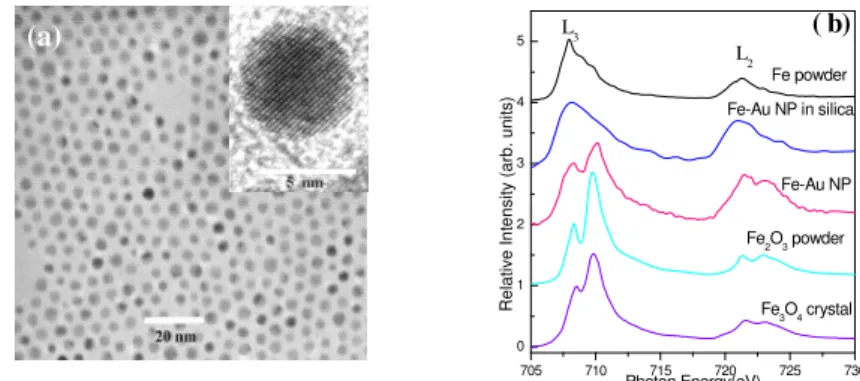
Fig. 1a presents a TEM image of the resulting Fe–Au NPs. The inset to Fig. 1a displays the lattice image of a nanoparticle. The core of the nanoparticle appears slightly darker than the shell because of the difference between the electron penetration efficiencies in Fe and Au. The average size of the Fe–Au NPs was ca. 5.5 nm, i.e., a 4-nm-diameter Fe core surrounded by a 0.75-nm-thick Au shell. This core-shell structure has been confirmed by an inductively coupled
HS
plasma-mass spectrometer.6b A small-angle X-ray scattering pattern of the Fe–Au NPs artificial crystal with synchrotron radiation indicated that it is a face-centered cubic structure. 6b
Scheme 1. The synthetic strategy for preparing the Fe–Au NPs and the Fe–Au artificial crystal.
One of the challenges in synthesizing Fe NPs is preventing the Fe from oxidization. We note that direct evidence for the existence of pure Fe NPs through any synthetic scheme has yet to be reported.2b,4 For example, even when Au shells were used to passivate Fe cores, the Fe atom was still readily oxidized during the synthetic process.8 In this study, we used the Fe atom’s L-edge to characterize the chemical state of the Fe cores in both the Fe–Au NPs and the self-assembled Fe–Au crystals. Fig. 1b presents the L-edge spectra of Fe in these samples and in three reference materials: Fe2O3, Fe3O4, and Fe powder. All the reference spectra we obtained are consistent with those reported in the literature.9 The L3 spectrum of the Fe–Au NPs exhibits two peaks at 708 and 710 eV that can be attributed to Fe oxides, but the ratio of these spectral peaks’ intensities (708 to 710 eV) is larger than those observed for the Fe oxides, which suggests that our Fe–Au NPs were oxidized only partially. Most noticeably, the spectrum of the artificial crystal of self-assembled Fe–Au NPs exhibits only a single peak at 708 eV, which indicates that the core of the nanoparticle comprises pure Fe. We believe that this spectrum provides the first direct evidence for the synthesis of pure Fe NPs, albeit those containing an Au shell and confined within a silica matrix. The mechanism through which the Fe oxides within the Fe–Au NPs are transformed into pure Fe cores within the artificial crystal remains unclear at this moment. There are some reports in the literature,10 however, that describe how Au on a Fe2O3 metal oxide can effect catalytic functions toward several reactions, including hydrogenation, reduction, and oxidation. In the presence of light, sulfur (S) atoms can desorb from the surface of metal oxide-supported Au NPs (S-Au/Fe2O3) in water at room temperature. Furthermore when silanes are attached to Au surfaces, hydrogen atoms can be released to form Au–Si covalent bonds. Therefore, we suspect that the system displayed in Scheme 1 might occur—a reduction of iron oxide-Au NPs in the presence of TEOS—to convert the S-Au/Fe oxide NPs into S-Au/Fe NPs.
S S S S S S S S S S S S S S S S HOSi O Si O OH OH OH HO Si OH OH OH HO Si O S i O HO OH HO HO S i OH OH HO OH Si O Si O OH OH OH OH Si HO OHOH OH Si O S i O HO HO HO HO S i OH HO HO HO Si O S i O OH HO HO OH S i OH HO HO S S S S S S S S FeAuNPs in a reverse micelle C D E (1-dodecanethiol) CTAB H2O Si(OCH2CH3)4 (TEOS) self-assembling A
705 710 715 720 725 730 0 1 2 3 4 5 Fe-Au NP in silica Fe powder Fe-Au NP Fe2O3 powder Fe3O4 crystal R e la ti v e I n te n s it y ( a rb . u n it s ) Photon Energy(eV) L 3 L 2 ( b)
Figure 1 (a) TEM image displaying the dispersed Fe-Au NPs. The inset presents an enlarged image of one nanoparticle to indicate the lattice image of the shell. (b) The L-edge XAS spectrum of Fe in Fe powder, Fe3O4, Fe2O3, Fe–Au NPs, and the Fe–Au artificial crystal.
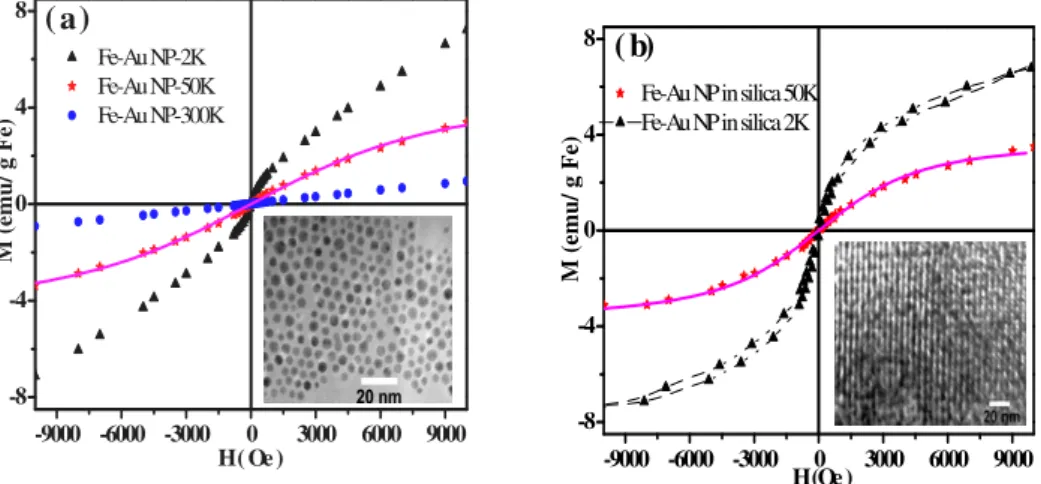
Fig. 2 displays the magnetization properties of Fe oxide–Au NPs and the Fe–Au artificial crystal within the silica matrix at different temperatures. Obtain these results required measuring and subtracting the diamagnetic contributions of the surfactant layer and the silica. The Fe oxide–Au NPs are superparamagnetic at 300 and 50 K, and we observed only a very small coercive field (Hc < 10 Oe, not visible on this scale) at 2 K. The Fe–Au artificial crystal exhibits a clear coercive field (Hc = 70 Oe) at 2 K. The hysteresis of the Fe–Au artificial crystal is not the typical curve observed for ferromagnetism, which suggests that a marginal transit from superparamagnetism to ferromagnetism occurs at this temperature. Thermal fluctuations prevent the spontaneous magnetization of NPs from pointing in a fixed direction when the particles are smaller than the critical size, as suggested by Néel.11 For a particle having uniaxial anisotropy, ∆E = KV (at H = 0), the condition for superparamagnetism could be expressed as KV = 25 kTB, where V is the volume of the nanoparticle, K is the anisotropy energy, k is the Boltzmann constant, and TB is the blocking temperature. Therefore, TB is proportional to d3, where d is the diameter of the nanoparticle. For d = 7 nm, it has been reported that Fe–Fe3O4 NPs had a value of TB of 35 K.2b Although their composition is different, we can estimate that Fe cores having d = 4 nm would have a value of TB of 6 K. We observe a hysteresis loop at 2 K for the artificial crystal sample, which does not contradict this estimate. The clear existence of Hc at 2 K for the Fe–Au artificial crystal is in sharp contrast to that observed for the Fe–Au NPs. This contrast may be due to the different degrees of oxidation of the Fe cores in the two materials, which would provide additional indirect evidence for their different chemical states. Another possibility is that the ordered Fe–Au artificial crystal may lead to an additional anisotropy energy, which certainly would enhance ferromagnetism, relative to that of random NPs. Because both Fe oxide–Au NPs and the Fe–Au artificial crystal are superparamagnetic at 50 K, we can fit the measured data in Fig. 2 to the Langevin paramagnetic function: M(x) = coth(x) – 1/x, with x = µH/kT. The line of best fit (see the solid curve) yields µ = 210µB for the Fe oxide–Au NPs and 400µB for the Fe–Au artificial crystal. By assuming that the core of each Fe oxide–Au NPs has a α-Fe2O3 crystal structure, we estimate that at 50 K and a magnetic flux density of 1 T, each Fe3+
-9000 -6000 -3000 0 3000 6000 9000 -8 -4 0 4 8 M ( e m u / g F e) H ( Oe ) Fe-Au NP-2K Fe-Au NP-50K Fe-Au NP-300K ( a ) -9000 -6000 -3000 0 3000 6000 9000 -8 -4 0 4 8 Fe-Au NP in silica 50K Fe-Au NP in silica 2K M ( e m u / g F e) H (Oe ) ( b)
ion in the NPs has a magnetic moment of 0.23 µB. We also calculate that each Fe atom in single Fe–Au nanocrystal has a magnetic moment of 0.44 µB. The value for the Fe–Au artificial crystal is about five times smaller than that observed in bulk Fe. This can be explained partly by the fact that magnetic NPs appear to have a reduction of the saturation magnetization12 due to competing antiferromagnetic exchange interactions at the surface, which causes random canting of the particles’ surface spins.13 This phenomenon has also been argued in favor of a surface origin12,14 and a finite size effect,12,15 but no clear conclusions regarding the origin of the effect have been provided.
Figure 2. Plots of magnetization (M) vs. magnetic field (H) of the (a) Fe–Au NPs at 300, 50, and 2 K and (b) the self-assembled Fe–Au ordered structure at 50 and 2 K. The solid curves represent best fits of the data to the Langevin paramagnetic model.
References
1.(a) Kittel, C. Phys. Rev. 70, 965 (1946). (b) Chudnovsky E. M. and Gunther, L. Phys. Rev. Lett. 60, 661 (1988). (c) Kneller, E. F. and Luborsky, F. E. J. Appl. Phys. 34, 656 (1963).
2.(a) Suslick, K. S. Fang, M. and Hyeon, T. J. Am. Chem. Soc. 118, 11960 (1996). (b) Farrell, D. Majetich, S. A. and Wilcoxon, J. P. J. Phys. Chem. B 107, 11022 (2003). (c) Park, J. An, K. Hwang, Y. Park, J.-G. Noh, H.-J. Kim, J.-Y. Park, J.-H. Hwang, N.-M. and Hyeon, T. Nature materials 3, 891 (2004). (d) Sun, S. Zeng, H. Robinson, D. B. Raoux, S. Rice, P. M. Wang, S. X. and Li, G. J. Am. Chem. Soc. 126, 273 (2004).
3.(a) Chung, S. H. Hoffmann, A. Bader, S. D. Liu, C. Kay, B. Makowski, L. and Chen, L. Appl. Phys. Lett. 85, 2971 (2004). (b) Tartaj, P. Morales, M. P. Veintemillas-Verdaguer S. Goonzález-Carreño T. and Serna, C. J. J. Phys. D: Appl. Phys. 36, R182 (2003). (c) Li, J. Mirzamaani, M. Bian, X. Doerner, M. Duan, S. Tang, K. Toney, M. Arnoldussen, T. and Madison, M. J. Appl. Phys. 85, 4286 (1999).
4.(a) Zhou, W. L. Carpenter, E. E. Lin, J. Kumbhar, A. Sims, J. and O’Connor, C. J. Eur. Phys. J. D. 16, 289 (2001). (b) Cho, S.-J. Kauzlarich, S. M. Olamit, J. Liu, K. Grandjean, F. Rebbouh, L. Lang, G. J. J. Appl. Phys. 95, 6804 (2004).
5.(a) Davidovic, D. and Tinkham, M. Appl. Phys. Lett. 73, 3959 (1998). (b) Black, C. T. Murray, C. B. Sandstrom, R. L. and Sun, S. Science 290, 1131 (2000)
6. (a) Pileni, M. P. Langmuir 13, 3266 (1997). (b) See supporting information.
7. Fan, H. Yang, K. Boye, D. M. Sigmon, T. Malloy, K. J. Xu, H. López, G. P. and Brinker, C. J. Science 304, 567 (2004)
8. Ravel, B. Carpenter, E. E. and Harris, V. G. J. Appl. Phys. 91, 8195 (2002)
9. Regan, T. J. Ohldag, H. Stamm, C. Nolting, F. Lüning, J. Stöhr, J. and White, R. L. Phys. Rev. B 64, 214422 (2001)
10. (a) Finch, R. M. Hodge, N. A. Hutchings, G. J. Quentin, A. M. Siddiqui, M. R. H. Wagner, F. E. and Whyman, R. Phys. Chem. Chem. Phys. 1, 485 (1999). (b) Tada, H. Soejima, T. Ito, S. and Kobayashi, H. J. Am. Chem. Soc. 126, 15952 (2004). (c) Owens, T. M. Nicholson, K. T. Holl, M. M. B. and Süzer, S. J. Am. Chem. Soc. 124, 6800 (2002). 11. Néel, L, C. R. Acad. Sci. 228, 664 (1949)
12. Martínez, B. Obradors, X. Balcells, Ll. Rouanet, A. and Monty, C. Phys. Rev. Lett. 80, 181 (1998) 13. Coey, J. M. D. Phys. Rev. Lett. 27, 1140 (1971).
14. Morrish, A. Hanada, H. K. and Schurer, P. J. J. Phys. C 37, 6 (1976).
15. Parker, F. T. Foster, M. W. Margulies, D. T. and Berkowitz, A. E. Phys. Rev. B 47, 7885 (1993)
IV.C. Coherent phonon generation and phonon spectroscopy of stoichiometric LiNbO3 and quaternary chalcopyrite AgGa(SxSe1-x)2 crystals
Lithium niobate had been dubbed as the silicon of optics for quite a long time. It also has been widely uses in optic waveguide devices and photorefractive optics. Recently, periodically poled lithium niobate (PPLN) resurrects new interests of the material in laser applications. However, deficit of Li2O causes a pinning effect of ferroelectric domains and therefore an extremely high poling field is required for reversing optic axis.
To reduce the deficit of Li2O in a lithium niobate crystal, a stoichiometric growth method has to be developed. Recently, we had employed the knowledge of the phase diagram of Li2O, K2O, and Nb2O5 to successfully grow stoichiometric lithium niobate crystals. It had been shown that the UV cutoff wavelength (i.e., the wavelength with an absorbance of 20 cm-1) of lithium niobate strongly correlates with the atomic ratio of Li and Nb. We measured the UV cutoff edge and the plasma-excited atomic emission spectra and the results indicate our samples are indeed stoichiometric. This finding also agrees with the Curie-temperature measurements presented in Fig. 3. The Curie temperature of a pure congruent LiNbO3 (cLNB) crystal without MgO doping occurs at Tc=1148oC (filled square), while the Curie temperature of a pure stoichiometric LiNbO3 (sLNB, filled circle) is found to appear at Tc=1194 oC.
200 300 400 500 Wavelength (nm) A b s o rb a n c e ( c m -1) 0.0 10.0 20.0 30.0 40.0 50.0 300 305 310 315 320 325 C u to ff W a v e le n g th ( n m a t α = 2 0 c m -1) 0.94 0.96 0.98 1.00 1.02 Li / Nb (atom % in crystal) -0.5 1.5 3.5 5.5 100 [MgO/(MgO+LiNbO3)] 1140 1160 1180 1200 C u ri e T e m p e ra tu re ( oC )
Figure 3 (Top: left) Transmission curve of a stoichiometric lithium niobate (sLNB) crystal at the UV cutoff edge,
(Top: right) the UV cutoff wavelength (the wavelength with an absorbance of 20 cm-1) as a function of the atomic
varying doping level of MgO. The measured result of our pure stoichiometric LNB is presented by the filled circle, which shows a Curie temperature of 1194 oC.
The low-temperature ferroelectric phase of LiNbO3 is originated from a displacement ∆z of the Li+ ions along its optical axis. The lowest-energy phonon mode with A1-symmetry is attributed to the ferroelectric mode, which significantly softens at the phase transition. It had been reported that the lowest-energy A1-symmetry phonon mode of LiNbO3 crystal has a vibrational frequency of 250 cm-1 (7.5 THz). Note that all currently known displacement-type ferroelectric crystals follows empirical rules of Ps=(258±9) ∆z and Tc=(2.00±0.09)×104 (∆z)2
. Since unit-cell distortion from the A1 optical phonon excitation belongs to the same type of distortion at the ferroelectric-paraelectric phase transition, therefore it shall be perturbed by Li2O-deficiency in a congruently grown LiNbO3 crystal. This was indeed observed by our differential transmission measurement with a femtosecond impulsive Raman excitation technique shown in Figure 4. The optical transmission is modulated by the refractive index change from phonon excitation. The fast Fourier transform of the modulated transmission curve therefore reflects the phonon excitation spectrum. We detect a slightly blue shift from 250 cm-1 to 255 cm-1 for the A1-TO phonon mode in a congruently grown and a stoichiometric LiNbO3. In view that for displacement-type ferroelectric crystals, kTc=(1/2)K(∆z)2
, where k is the Boltzman constant, and K denotes the force constant of the ferroelectric mode. Thus both of the Curie temperature and the A1-TO phonon frequency indicate a stronger force constant in the potential-energy curve of the Li+ ion displacement along the optical axis of sLNB.
0 2 4 Delay Time (ps) -0.2 -0.1 0.0 0.1 0.2 D if fe re n ti a l T ra n s m is s io n 1 0 0 0 *( ∆ T /T ) 0 100 200 300 400 Frequency (cm-1) 0 2 4 6 8 10 F F T (D if fe re n ti a l T ra n s m is s io n ) sLiNbO3 cLiNbO3
Figure 4 (a) Differential transmission measurement on a c-cut stoichiometric LiNbO3 crystal plate with femtosecond
impulsive Raman scattering excitation; (b) FFT of the differential transmission curves for a congruently grown (dashed) and stoichiometric (solid curve) LiNbO3 crystals.
Effects of cation substitution on optical and electronic properties had attracted significant research interest of materials scientists. AgGa(SxSe1-x)2 crystals are solid solutions of the two infrared nonlinear optical crystals, AgGaS2 and AgGaSe2. We investigated the effects of cation substitution on these materials experimentally and theoretically. We found the bandgaps, optical properties, and bulk modulus are linearly dependent on the substitution concentration x of the cation S. The major effect of the cation substitution can be understood via a change of unit cell volume.
with the relative motion of the cations (S or Se) along the x- and y-axis. Therefore Se substitution, which increases the cell volume, shall also reduce the A1-mode phonon frequency. Indeed by measuring differential transmission with a femtosecond impulsive Raman excitation technique (see Fig. 8) we found that the A1-mode has a vibration frequency of 295 cm-1 for AgGaS2 and 181 cm-1 for AgGaSe2. The frequency down shift scales very well with effective mass. For the mixed crystals, the phonon frequency of A1 mode was found to linearly vary with the cation substitution concentration x. As a concentration near 50%, broader bandwidth of the phonon mode was also found, which can be ascribed to the substitution-induced disorder. Therefore a weaker amplitude and shorter lifetime of the A1-mode shall be observed.
0 100 200 300 400 Frequency (cm-1) 0 2 4 F F T (D if fe re n ti a l T ra n s m is s io n )
Figure 5 Vibration spectrum of A1 phonon of AgGaS2 (solid curve), AgGaSe2 (dashed, blue) and mixed crystal of
AgGa(S0.5Se0.5)2 measured with femtosecond impulsive Raman excitation technique.
The results of the dynamic phonon spectroscopy of LiNbO3 and AgGa(SxSe1-x)2 crystals are under preparation. But some of the published journal papers related to the above-mentioned studies can be found in:
L. C. Tang, M. H. Lee, C. H. Yang, J. Y. Huang, and C. S. Chang, Cation substitution effects on structural, electronic, and optical properties of nonlinear optical AgGaSxSe1-x crystals, J. Phys. C. Condens Matter 15, 6043-6055 (2003).
IV.D. Magneto-Optical Kerr Effect of self-assembled film of Co2+: doped ZnO quantum dots Recently nano-structured magnetic materials have attracted significant interests in both fundamental research and applied technologies. This is because enhanced and tailorable magnetic properties from known materials could be achieved with nanotechnology. Magnetization hysteresis loop measurement can provide rich information for both scientists and engineers. We apply our techniques to investigate the magnetic response of a film of ZnO quantum dots doped with 0.7% Co2+.
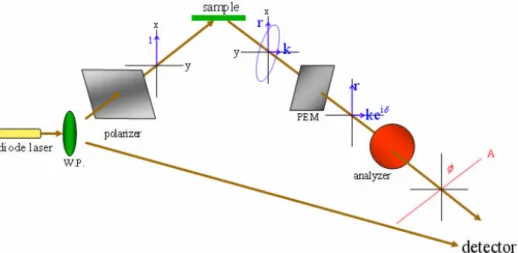
Schematic diagram of the experimental setup for measuring magneto-optical Kerr signal is presented in Figure 6. The Wollaston prism splits the incident beam into two parts with polarizations orthogonal to each other. One beam is brought to incident on the reference detector, and the other beam is used for the signal arm. The polarizer is orientated to along the x-axis (0°), which allows s-polarized light to pass. The reflected light is elliptically polarized by the sample to
yield two orthogonal components r and k from the magneto-optical Kerr effect. Note that the k-component is usually very small. Thus we shall use photoelastic modulator (PEM) to modulate the signal and retrieve the weak modulated k component with a lock-in amplifier.
Figure 6 Schematic diagram showing the experimental setup for probing the magneto-optical Kerr effect of a test sample.
The setup of Figure 6 can be analyzed with Jones calculus. By setting the orientations of polarizer and analyzer to be 0° and 45°, the signal field can then be derived to be
f i 0 E = =A M S P E 1 1 1 0 1 1 1 1 1 0 0 1 1 2 1 0 0 0 1 y x i pp ps sp ss i E E A M e r r S r r P E E δ ⋅ ⋅ ⋅ ⋅ − = − = = ⋅ = ⋅ , (1)
where A, M, S, and P denote the Jones matrices of analyzer, PEM, sample, and polarizer, respectively. The signal field can be simplified to be
0 f E 2 i ps ss i ps ss r r e E r r e δ δ + = + , (2)
where δ δ= 0sin(ωt)represents the modulation effect of PEM with ω being the modulation frequency and δ0 the modulation depth. When δ0 is sufficient small, i
eδcan be expanded as
cos sin 0( ) 20 2( ) cos 20 [2 ( ) sin1 0 ] i
The modulated signal intensity becomes 2 2 2 2 1 2 2 ( ) sin 2 ( ) cos 2 f ss ss k ss k I = E ≈ r + J δ r ε ωt+ J δ r θ ωt , (4)
where the Kerr rotation angle is θk =Re[rps rss] and εk =Im[rps rss] denotes the Kerr ellipticity. Therefore from Eq. (4), we can find that the Kerr ellipticity and Kerr rotation relate to the measured ω- and 2ω-signal components of the reflected light.
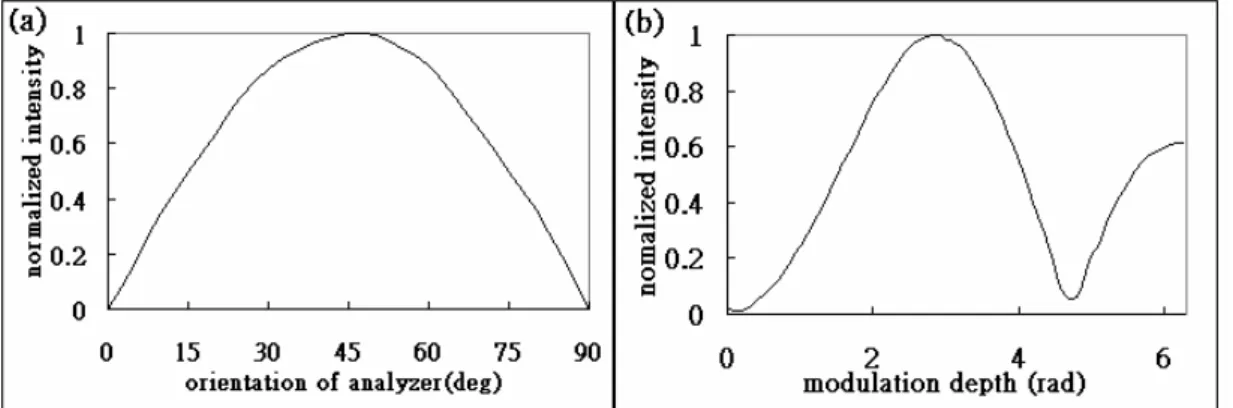
To improve the detection sensitivity of MOKE signal, the modulation depth of PEM shall be properly adjusted and the orientation of analyzer shall be oriented to a proper direction. This condition can be fulfilled by first setting the orientation of the polarizer to 45° and the modulation depth to be 3.2 rad. By using a polished silicon wafer as the reference sample, the two components of the reflected light are large and the MOKE-induced depolarization effect can be neglected. The modulated signal is the y-component of the reflected light. We then adjust the orientation of the analyzer to maximize the modulated signal. The simulated result is shown in Figure 7(a). We can see that the maximum signal can be achieved with the analyzer orienting at 45°. We can go further to adjust the modulation depth by first setting the transmission axis of the analyzer to be 45° and measuring the signal as a function of modulation depth. The calculated result is shown in Figure 7(b). We found that for the detection of 2ω-signals the optimal modulation depth is 2.9 rad with an orientation angle of 45° for the analyzer.
Figure 7 (a) Variation of modulated signal intensity as a function of the analyzer orientation. (b) Intensity variation of the modulated signal at 2ω as a function of modulation depth.
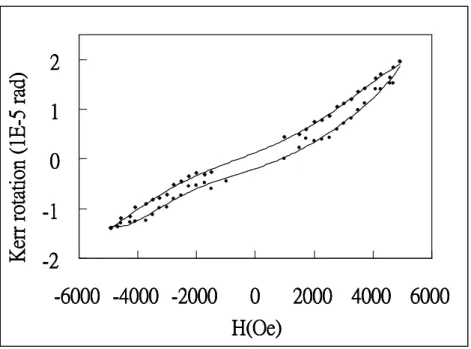
We applied the setup to investigate the magnetic response of a film of ZnO quantum dots doped with 0.7% Co2+. The quantum dots were dissolved in ethanol and the film can be formed by spreading the solution drop-by-drop on the silicon wafer and heating the sample to 40˚C to evaporate the solvent. The measurement result of the hysteresis loop is shown in Fig. 8. It is amazing to find that the magnetization loop persists even at room temperature, indicating the film of 0.7% Co2+-doped ZnO quantum dots to be ferromagnetic at room temperature. The Kerr rotation from the MOKE effect is about 1×10⁻⁵
rad, which also reflects the detection sensitivity of our apparatus shown in Fig. 6.
Figure 8 Measured magnetization hysteresis loop of ZnO quantum dots doped with 0.7% Co2+ with the above-mentioned MOKE measurement apparatus.
By replacing the diode laser in Fig. 6 with a femtosecond laser in pump-probe geometry, we were able to probe the spin dynamics of electrons in a ferromagnetic Ni film. The result is presented in Fig. 9. The differential reflectivity and magnetization-induced magneto-optical Kerr signal reveal almost the same dynamics, indicating the pump-induced free carriers play an important role in the observed relaxation processes.
-500 -250 0 250 500 750 1000 1250 1500 Delay Time (fs) 0.0 0.2 0.4 0.6 0.8 1.0 1.2 N o rm a liz e d S ig n a l (a rb . u n it s
) delR/R from Ni film M/Ms
Figure 9 Transient reflectivity R/R (filled circles) and MOKE signal (open squares) of a 20-nm Ni film after excitation by 60-fs duration pump pulses at 800-nm wavelength.
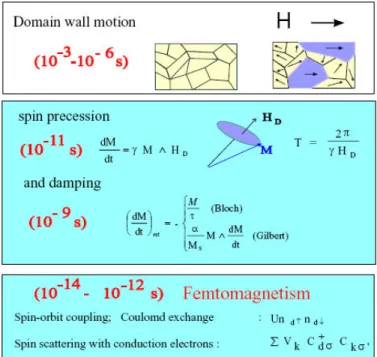
The following four steps are usually considered in laser heating of metals, and they may in some circumstances overlap in time: (1) the photon energy is deposited within the skin depth of
interaction leads to thermalization of the quasi-particles, (3) energy is exchanged between quasi-particles and phonons, and (4) energy propagates in the medium. The absorption of photon energy occurs via intra- and interband optical transitions. Then, the energy distribution of the excited states changes in time due to electron–electron scattering, until it reaches a Fermi–Dirac distribution. The complex MO rotations θk =Re[rps rss] and εk =Im[rps rss] as well as the reflection R of the sample, depend on first-order dielectric tensor ε(1) and on the thickness of the film. By fitting the experimental data ∆R R t( )with the convolution of the pump pulse with a response function, the characteristic electronic thermalization time and an electron-phonon interaction time can be obtained.
In the usual description of the linear static MO response, one can write the expression
(1) xy M
ε =α , where M is a real quantity of magnetization M =µB(nd↑−nd↑), since mainly the d component of the magnetization is probed by magneto-optics, and α α= '+iα" is a complex quantity that contains the information about the electronic wave functions, the matrix elements associated with the spin-orbit interaction, and the coupling with the electromagnetic field. The magnetization dynamics of Ni film involves a distinct magnetization dynamic process with the spin polarization drops rapidly (< 300 fs) as noted by the relaxation processes shown in Fig. 9. The MO dynamics belongs to the third category shown in Figure 10. For t >150 fs the spin dynamics is driven by the electronic temperature. The scenario can be invoked based on an unequal depopulation of the d↑and d↓bands ∆(nd↑−nd↓) (nd↑−nd↓)= ∆M M owing to the different density of states of nd↑(Ef) and nd↓(Ef) near the Fermi level with spin flips via the spin orbit coupling, a process which may occur with a characteristic time τs o− = Es o− 1 5− fs.
IV.E Tracking correlative motion of submolecular fragments in novel liquid crystal devices Understanding molecular interactions in the condensed phase requires experimental tools that can simultaneously follow the time evolution of multiple coordinates. Borrowing ideas from multidimensional nuclear magnetic resonance (NMR), two-dimensional infrared (2D IR) spectroscopy has been developed to address these issues. 2D IR spectroscopy is a pulsed Fourier transform technique where sequences of femtosecond IR fields with varying delays manipulate coherences in a system of coupled vibrations. The resultant data is Fourier transformed and represented as a 2D correlation map of frequencies sampled during the initial evolution and final detection time periods. Molecular information is encoded in the positions, amplitudes and line shapes of the various resonances in a 2D vibrational spectrum.
However, vibrational relaxation rates are orders of magnitude faster than typical spin relaxation rates. Femtosecond infrared pulses are needed to conduct such an investigation. Lack of a proper femtosecond infrared source, therefore in this study we introduce a slower relaxation process to perturb the molecular system of interest and then collect spectra sequentially as a function of the perturbing parameter. By tracking correlative motion of sub molecular fragments in complex molecular systems, we succeed in probing the switching dynamics of pure ferroelectric liquid crystal (FLC) and FLC mixtures with a time-resolved 2D FTIR technique. By spreading spectral peaks along the second dimension; we gain an advantage of sorting out complex or overlapped spectral features that normally cannot be resolved in a one-dimensional spectrum. We were able to reveal the detailed correlative motion of submolecular fragments in a FLC film and distinguish specific functional groups attached to different positions on a FLC molecule.
Some of the published journal papers related to the above-mentioned studies can be found in: 1.
Wen T. Shih and Jung Y. Huang, Probing the field-induced submolecular motions in a ferroelectric liquid crystal mixture with time-resolved two-dimensional infrared spectroscopy, submitted to J. Phys. B. (June, 2005). NSC93-2112-M-009-007.
2.
Wen T. Shih and Jung Y. Huang, 2D IR of submolecular reorientation in a surface stabilized ferroelectric liquid crystal induced by temperature and electrical field, submitted to Phys. Rev. E (September 2005, MS#ED10123). NSC93-2112-M-009-007.
3.
Wen-Tse Shih, Jung Y. Huang, and Jing Y. Zhang, Field-induced re-orientation dynamics of surface stabilized ferroelectric liquid crystal mixture, Liquid Crystals 31, 1-9 (2004).
NSC-91-2112-M-009-037-V. Conclusion and self evaluation
The major objective of this three-year research project is to apply femtosecond laser technology for investigating the dynamics of carrier spin and coherent phonon in condensed matters. Specifically, we shall employ an optical pulse shaping technique to control the coherent transport of carrier spin and phonon generation in some quantum-confined systems and to retrieve the dynamic mechanisms from the optimal laser field used.
which include: (1) a blue-to-near UV short-wavelength femtosecond laser source for probing wide-bandgap materials; (2) an apparatus for the complete-field characterization of ultra weak optical signal; (3) an apparatus for enabling femtosecond pulse conversion, characterization and coherent control. We have demonstrated the functionalities of these techniques to verify their usefulness for this research.
In particular, we are interested in new phenomena resulting from an enhanced coupling between electrons and photons at nanometer scales. Photon energy with wavelength of hundreds nanometers had been predicted to be able to localize to a few nanometers by using a proper control of transient optical phase. To prepare the nanostructured quantum systems with enhanced and tailorable magnetic properties, solution growth technique has been developed to synthesize magnetic/noble metal core-shell quantum dots and ZnO nanocrystals doped with various magnetic ions. Steady-state and dynamical measurement techniques with a sensitivity of 10-6 rad have been achieved to provide rich information about phonon and spin dynamics. This progress offers an opportunity to probe and control the spin transport dynamics in a low-dimensional quantum-confined system.
Due to the power limitation of the femtosecond laser pulse by the low optical throughput of our pulse shaping apparatus, we are unable to implement the pulse shaping technique into the coherent control of the phonon and spin dynamics. However, the coherent control function had been verified with adaptively controlled nonlinear optical microscopy of semiconductor nanostructures. Therefore we can grade the degree of completion of this project to be higher than 80%. Furthermore several valuable cutting edge technologies had been developed, which establish a firm platform for further development of coherent control physics of quantum systems.