Materials Chemistry and Physics 78 (2002) 160–169
Emission spectra of LnPO
4
:RE
3
+
(Ln
= La, Gd; RE = Eu, Tb and Ce)
powder phosphors
U. Rambabu
a,∗, N.R. Munirathnam
a, T.L. Prakash
a, S. Buddhudu
baCentre for Materials for Electronics Technology (C-MET), IDA Phase-II, HCL (Post), Cherlapally, Hyderabad 500051, India bDepartment of Physics, Sri Venkateswara University, Tirupati 517502, India
Received 31 December 2001; received in revised form 1 May 2002; accepted 10 May 2002
Abstract
This paper reports the emission spectra at room temperature and presents an optimum concentration for each of the dopants in GdPO4:Eu3+, LaPO4:Tb3+and LaPO4:Ce3+powder phosphors for the observation of bright reddish-orange, green and UV emission,
respectively. FT-IR and a thermal analysis of these phosphor materials have been carried out. Scanning electron microscopic investigations were also conducted to understand surface morphological features (shape) and the grain size in the powder phosphor systems.
© 2002 Elsevier Science B.V. All rights reserved.
Keywords: Lanthanide phosphates; Eu3+, Tb3+and Ce3+dopants; Optimum concentration
1. Introduction
Fluorescence spectra of rare earth activated materials have potential industrial applications, for example, in solid state lasers (YAG:Nd), in color TV monitors (Y2O2S:Eu) and in X-ray intensifying screens (LaOBr:Tb) [1,2]. Lan-thanide orthophosphates (LnPO4) crystallize in two poly-morphic types, the monoclinic monazite type (for Ln= La to Gd) and the quadratic xenotime type (for Ln = Tb to Lu). The emission spectrum of Eu3+in LnPO4was reported for the first time by Ropp[3] who compared the emission intensities of the rare earth phosphates and rare earth oxide phosphors. The highly efficient Tb3+-doped monazite phase (LaxTbyCez) PO4has been a green phosphor in fluorescent lamps [4–6]. Ropp who reported that Ce3+-activated rare earth phosphates have lifetimes in the nanosecond range[7]. YPO4:Ce3+displays two UV emission peaks[3,7]. Schwarz and coworkers[8–10]and Brabier et al. [11] have carried out the optical investigations of alkali rare earth phosphates of the type M3RE(PO4)2 (M = Na, K, Rb; RE = La to Tb). Erdei et al.[12,13]prepared Ce3+, Tb3+:LaPO4green phosphors by a newly developed hydrolyzed colloidal reac-tion (HCR) technique at room temperature (<100◦C) and in atmospheric pressure by utilizing a subsequent calcining
∗Corresponding author. Present address: Institute of Electro-Optical
Engineering, National Chiao-Tung University, R. No. 518, MIRC Building, Hsinchu, Taiwan, ROC.
E-mail address: urambabu@yahoo.com (U. Rambabu).
and reductive treatments, respectively. Brixner and Fluornoy have mentioned some of the properties of the GdPO4:Eu3+ phosphors and compared them with other hosts. Over the past few years, we have been actively involved in the preparation and characterization of a wide variety of rare earth doped powder phosphors for their use in color TV monitors, fluorescent lamps and X-ray intensifying screens [14–16]. Keeping in view the commercial applications of red, green and blue emitting phosphors, earlier we have pre-pared and characterized the Eu3+, Tb3+ and Ce3+-doped lanthanide oxychloride, Na6Ln(BO3)3 (Ln = La and Gd), lanthanide oxyfluoride and oxybromide powder phosphors [17–21]. The purpose of present paper is to report the syn-thesis, optical properties and the optimization of dopant ion (Eu3+, Tb3+ and Ce3+) concentration in lanthanide based phosphors.
2. Experimental
Lanthanide phosphates can be synthesized through dif-ferent reactions and/or in combinations as well. Here, we have adopted a precipitation technique, which involves a di-rect and clean reaction between the lanthanide oxides and phosphoric acid without any by-products other than the wa-ter [22]. For the synthesis of these phosphors, ultra pure gadolinium oxide (Gd2O3), lanthanum oxide (La2O3), yt-trium oxide (Y2O3), europium oxide (Eu2O3), terbium oxide (Tb4O7), cerium oxide (CeO2) and phosphoric acid (H3PO4) 0254-0584/02/$ – see front matter © 2002 Elsevier Science B.V. All rights reserved.
162 U. Rambabu et al. / Materials Chemistry and Physics 78 (2002) 160–169 were taken as the starting chemicals. Due to the
hygro-scopic nature of the lanthanide oxides, the starting oxides were calcined at 700◦C[23]. Initially, chemicals pertaining to following compositions were mixed thoroughly by using acetone as the mixing medium. For labeling purpose, the reddish-orange color emitting (Eu3+) phosphors are abbre-viated as RP, green color emitting (Tb3+) phosphors as GP and UV emission (Ce3+) phosphors as UVP with the phos-phor sample numbers.
1. Gd0.999PO4:Eu0.0013+ (RP-1) 2. Gd0.995PO4:Eu0.0053+ (RP-2) 3. Gd0.99PO4:Eu0.013+ (RP-3) 4. Gd0.95PO4:Eu0.053+ (RP-4) 5. Gd0.9PO4:Eu0.13+ (RP-5) 1. La0.995PO4:Tb0.0053+ (GP-1) 2. La0.99PO4:Tb0.013+ (GP-2) 3. La0.95PO4:Tb0.053+ (GP-3) 4. La0.9PO4:Tb0.13+ (GP-4) 5. La0.5PO4:Tb0.53+ (GP-5) 1. La0.995PO4:Ce0.0053+ (UVP-1) 2. La0.99PO4:Ce0.013+ (UVP-2) 3. La0.95PO4:Ce0.053+ (UVP-3) 4. La0.9PO4:Ce0.13+ (UVP-4) 5. La0.6PO4:Ce0.43+ (UVP-5)
The dried lanthanide oxide powders were slowly added to a 85% phosphoric acid. The reaction was vigorous and exothermic in nature. Large precipitates were immediately formed at the reaction site, and then broke into fine particles. The solution was extremely dense and stable and did not separate for a long period of time. The solution was later stirred for 30 min and then separated by centrifuging. Traces of excess H3PO4 were removed by washing the samples several times with a deionized water. The chemical reaction involved in the present synthesis is as follows:
(1 − x)Ln2O3+ xRE2O3+ 2H3PO4
→ 2Ln1−xREx+ 3H2O
(Ln = La and Gd; RE = Eu, Tb and Ce) (0.001 ≤ x ≤ 0.5)
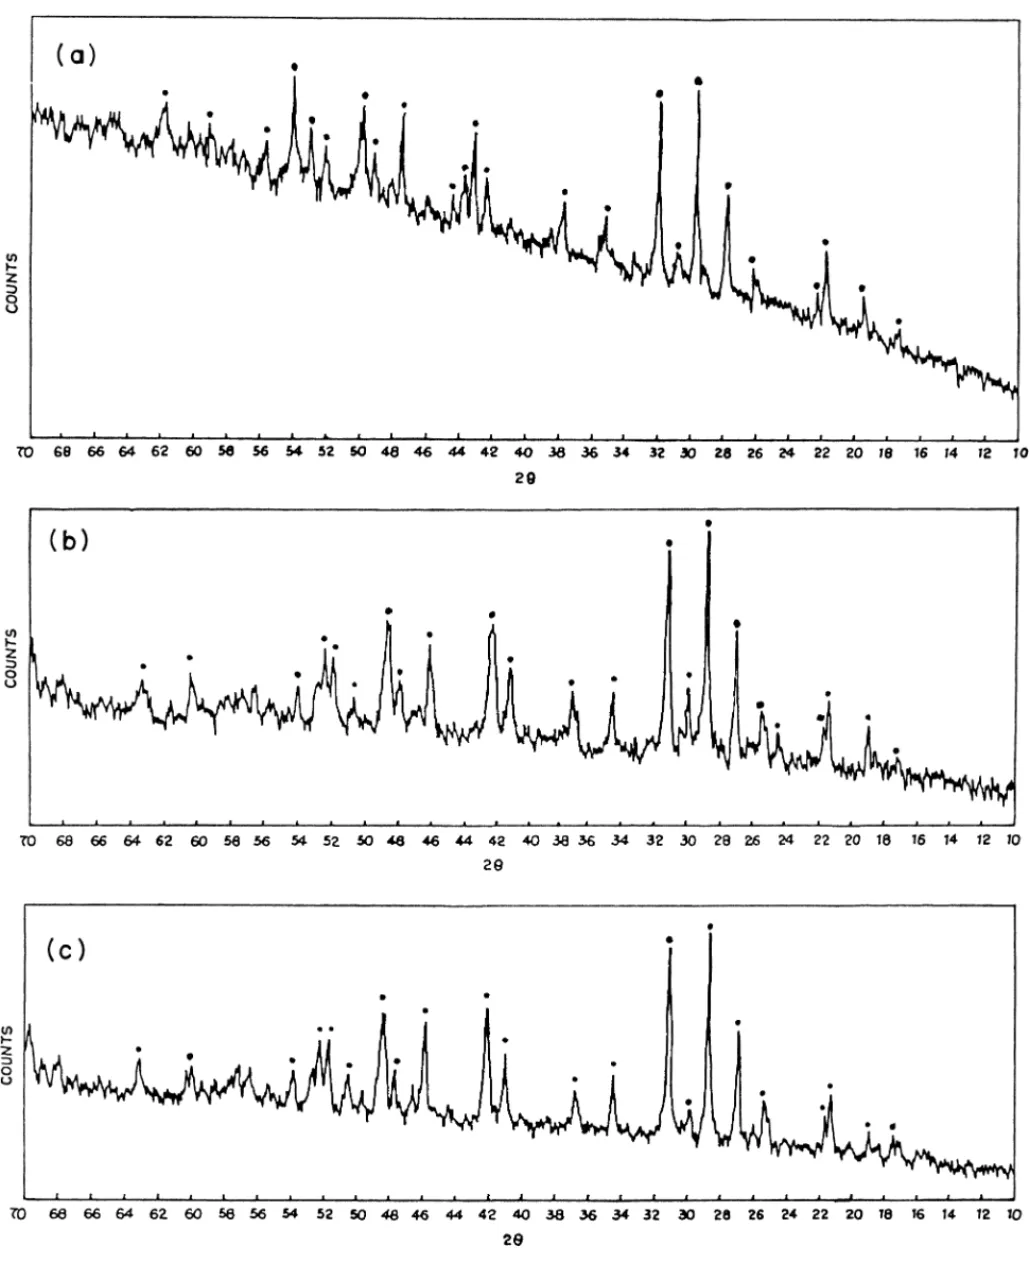
The obtained white powders were collected into quartz boats and fired in a silica tube in the central zone of a high temperature furnace for 3 h at 950◦C in an inert (N2) atmo-sphere. Soon after completion of the synthesis, the emission under an UV source is reddish-orange, green and ultraviolet for the Eu3+, Tb3+and Ce3+ phosphors, respectively. The purity of the synthesized phosphors Gd0.95PO4:Eu0.053+, La0.95PO4:Tb0.053+ and La0.95PO4:Ce0.053+ was checked by X-ray diffractometry (XRD). A Philips PW 18140 X-ray diffractometer fitted with a PM 820 3A online recorder was used for this purpose. All diffractograms were recorded with Cu K␣ (λ = 0.1542 nm) radiation (Fig. 1(a)–(c))[22].
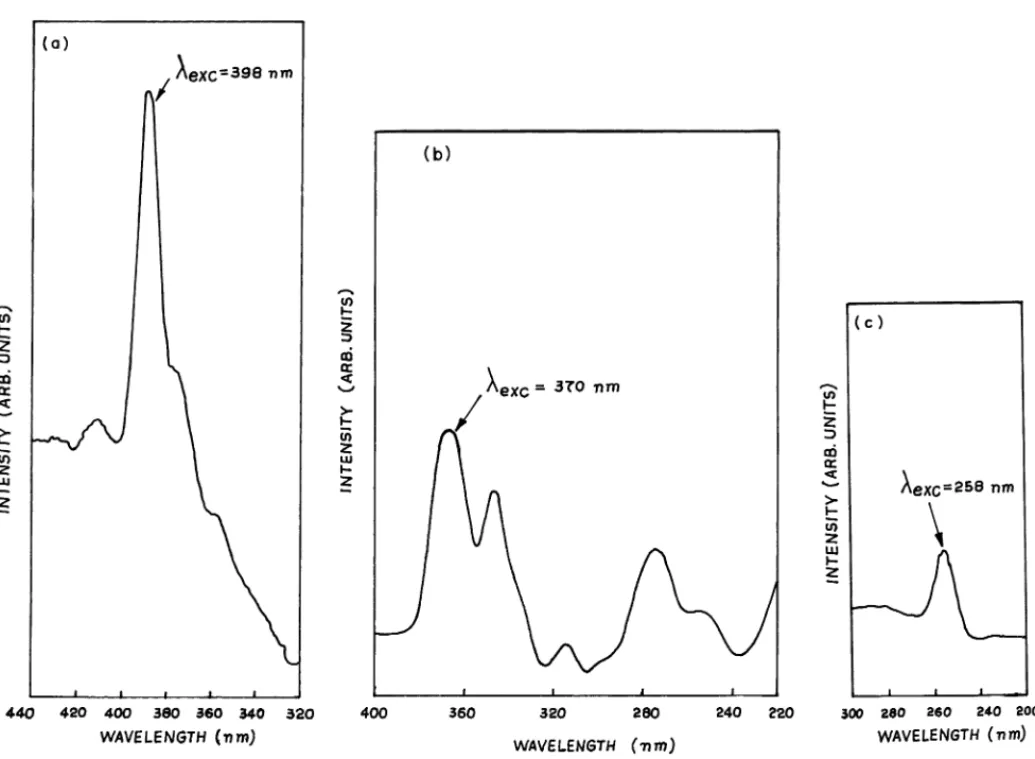
Both excitation and fluorescence spectra of these phosphors were recorded on a Hitachi 650 10S spectrofluorimeter using a 150 W xenon arc lamp as the excitation source at room temperature. The recorded excitation spectra are shown inFig. 2(a)–(c), revealing the stronger lines of exci-tation,λexc = 398 nm (Eu3+),λexc = 370 nm (Tb3+), and λexc= 258 nm (Ce3+). The fluorescence spectra are shown in the Figs. 3–5. The FT-IR absorption spectra of these samples were carried out on a Perkin-Elmer spectrome-ter (spectrum 2000) with KBr pellets in the wave-number range of 1400–370 cm−1 given in Fig. 6(a)–(c) [24]. The surface morphological features (shape and grain-size) of the phosphors Gd0.95PO4:Eu0.053+, La0.95PO4:Tb0.053+ and La0.95PO4:Ce0.053+were studied by using Leica stere-oscan 440 scanning electron microscope (SEM). SEM pho-tographs are furnished inFig. 7(a)–(c). For SEM analysis, the samples were pre-coated with a thin layer of gold in a Polaran E5000 coating unit in order to prevent the charg-ing of the specimen. For a comparative study, the electron beam parameters were kept constant while the analysis of the samples was being carried out. The SEM images of the samples with a 20 kV EHT and a 25 pA beam cur-rent were recorded by using a 35 mm camera attached on the high resolution recording unit. Thermogravimetric in-vestigations (thermogravimetric analysis, TGA/differential thermal analysis, DTA) were carried out on the phosphor samples of Gd0.95PO4:Eu0.053+, La0.95PO4:Tb0.053+ and La0.95PO4:Ce0.053+ by using Mettler Toledo TGA/SDTA 851e. The samples were heated from 900 to 1300◦C in a dynamic inert (N2) atmosphere and with the heating rate of 10◦C min−1. TGA/DTA results are produced in Fig. 8(a1/b1), (a2/b2) and (a3/b3), respectively.
3. Results and discussion
3.1. Eu3+:phosphors
The profiles of the fluorescence spectra of all Eu3+: phosphors (Fig. 3) show the emission transitions[25]: 5D
0→7F4,7F3,7F2,7F1and7F0
The main emission peaks are located at 580–591 nm (5D
0 → 7F1) and at 610–619 nm (5D0 → 7F2), respec-tively. The transition (5D
0 → 7F2) splits into three com-ponents and similarly the other transition (5D0 → 7F1) (magnetic dipole in character) is split into two components in all the Eu3+:phosphors. The presence of a sensitive forbidden transition (5D0 → 7F0) has been identified in all phosphors with a very weak intensity. The transition (5D
0→7F1) displays more intensity than that of the tran-sition (5D0 → 7F2) due to localized energy transfer. Usu-ally, for non-centro symmetrical host-compounds including Eu3+-doped lanthanide oxychloride, lanthanide-alkaline earth borates and lanthanide oxybromides, which we studied
Fig. 2. Excitation spectra of (a) Gd0.999PO4:Eu0.0013+, (b) La0.95PO4:Tb0.053+and (c) La0.95PO4:Ce0.053+powder phosphors.
Table 1
Relative fluorescence intensity ratios (R) for the measured emission levels of GdPO4:Eu3+ powder phosphors
Phosphor (5D 0→7F0)/ (5D 0→7F4) (5D 0→7F1)/ (5D 0→7F4) (5D 0→7F2)/ (5D 0→7F4) (5D 0→7F3)/ (5D 0→7F4) (5D 0→7F4)/ (5D 0→7F4) RP-1 – 1.464 1.071 0.803 1.000 1.571 0.928 0.857 0.964 1.000 RP-2 – 1.820 1.179 0.641 1.000 2.038 0.858 0.743 0.935 1.038 RP-3 – 1.980 1.200 0.530 1.000 2.260 0.800 0.680 0.920 1.050 RP-4 0.232 2.341 1.261 0.295 1.000 2.785 0.693 0.505 0.835 1.051 RP-5 0.333 1.993 1.178 0.392 1.000 2.440 0.720 0.559 0.845 1.000
164 U. Rambabu et al. / Materials Chemistry and Physics 78 (2002) 160–169
Fig. 3. Fluorescence spectra of (a) Gd0.999PO4:Eu0.0013+, (b) Gd0.995PO4:
Eu0.0053+, (c) Gd0.99PO4:Eu0.013+, (d) Gd0.95PO4:Eu0.053+ and (e) Gd0.9PO4:Eu0.13+ powder phosphors.
Fig. 4. Fluorescence spectra of (a) La0.995PO4:Tb0.0053+, (b) La0.99PO4:
Tb0.013+, (c) La0.95PO4:Tb0.053+, (d) La0.9PO4:Tb0.13+and (e) La0.5PO4:
Tb0.53+powder phosphors.
earlier, the (5D0 →7F2) transition is the most intense one
[17–20]. The emission transitions have assigned using the data from the literature [4]. The intensity of the emission transitions was found to increase with an increase in Eu concentration up to 5 mol. Additionally, the emission peak
Fig. 5. Fluorescence spectra of (a) La0.995PO4:Ce0.0053+, (b) La0.99PO4:
Ce0.013+, (c) La0.95PO4:Ce0.053+, (d) La0.9PO4:Ce0.13+and (e) La0.6PO4:
Ce0.43+powder phosphors.
Fig. 6. FT-IR absorption spectra of (a) Gd0.95PO4:Eu0.053+, (b) La0.95PO4:Tb0.053+and (c) La0.95PO4:Ce0.053+powder phosphors. Table 2
The emission level peak positions (λp, nm) for the transition(5D0→7F2)
and color coordinates ( ¯X, ¯Y ) of GdPO4:Eu3+powder phosphors
Phosphor λp(nm) ¯X ¯Y RP-1 606 0.516 0.450 614 RP-2 608 0.621 0.377 616 RP-3 609 0.616 0.382 618 RP-4 610 0.625 0.373 619 RP-5 611 0.657 0.341 619
positions are found to be marginally shifted towards the higher wavelength side. The relative fluorescence intensity ratios (R), have been calculated and given in Table 1. The emission level peak positions (λp, nm) for the transition (5D
0 → 7F2), is given in Table 2, which are noticed to significantly change with the chemical composition. Color coordinates ( ¯X, ¯Y ) are computed according to standard formulations made available by the Commission Interna-tionale de 1’Eclairage (CIE), France, and based on the three primary colors red, green and blue (Table 2)[26]. The com-puted color coordinates ( ¯X, ¯Y ) are superimposed in the CIE chromaticity diagram to check the validity of the obtained results (Fig. 9). FromFig. 9, it is clear that the color coor-dinates of the synthesized powder phosphors are well fitted
166 U. Rambabu et al. / Materials Chemistry and Physics 78 (2002) 160–169
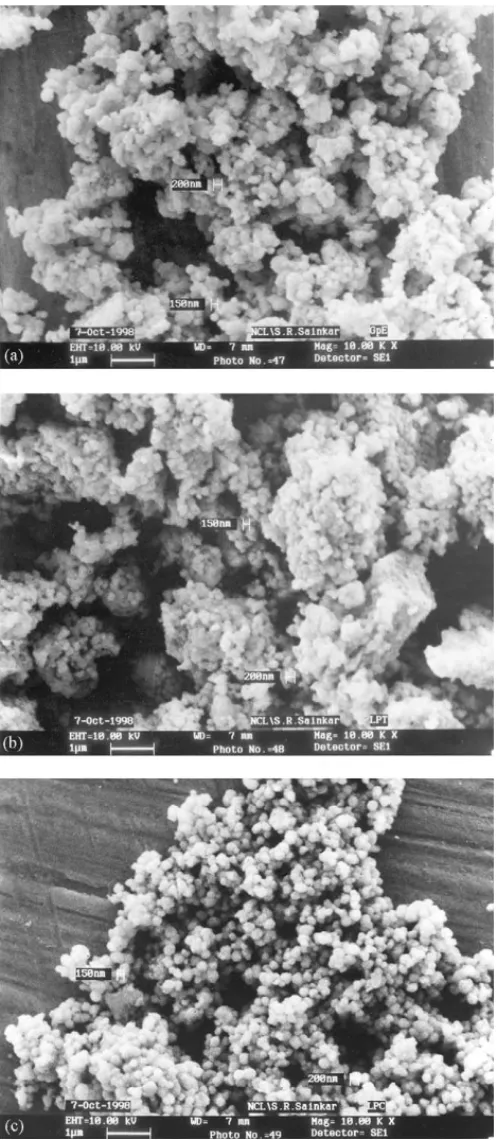
Fig. 7. SEM images of (a) Gd0.95PO4:Eu0.053+, (b) La0.95PO4:Tb0.053+ and (c) La0.95PO4:Ce0.053+powder phosphors.
in the reddish-orange region (indicated as a rectangular shaded portion). The recorded FT-IR absorption spectrum of Gd0.95PO4:Eu0.053+ Fig. 6(a)) has been in agreement with the reported literature[24]. The ionic phosphate absorption is reported on the basis of the Raman work to absorb at 1080 and 980 cm−1[27]. The fundamental frequencies allowed in
the infrared appear at 500 cm−1. In the pertinent FT-IR spec-trum, two bunches of absorption bands have been observed in the wave-number region 1200–900 and 700–400 cm−1 which are attributed to M–OPO3(M= Gd and Eu) bonds
[28]. Thermogravimetry of Gd0.95PO4:Eu0.053+, indicates the total thermal stability with respect to chemical as well as crystalline phase transformation changes, in a cov-ered temperature range. From the recorded SEM image of Gd0.95PO4:Eu0.053+ (Fig. 7(a)), it is seen that, the particles are agglomerated and are having a spherical shape with a grain size in the range of 150–200 nm. Based on the recorded fluorescence spectral features and from the relative fluorescence intensity ratios (R), the optimum concentration of the dopant europium (Eu3+) has been found to be 5 mol.
3.2. Tb3+:phosphors
From the recorded fluorescence spectra of Tb3+:phosphors (Fig. 4), the following four emission transitions have been observed[12,29–31]: • 5D 4→7F6(486–484 nm) • 5D 4→7F5(539–537 nm) • 5D 4→7F4(578–577 nm) • 5D 4→7F3(614–612 nm)
Among these, the emission transition5D4 → 7F5 is re-sponsible for green color observation as a single peak, and it has been taken as a reference for the comparison of the fluorescence spectral peaks of the Tb3+:phosphors studied. From the spectral features, it has been noticed that, the intensity of the emission peaks increases with an increase in terbium concentration up to 5 mol beyond which the fluorescence quenching has been observed. Besides this, positions of the emission peaks have been observed to be varying slightly depending upon the host matrix. There-fore, the Tb3+concentration of 5 mol has been found to be an optimum dopant ion concentration. The emission level peak positions (λp, nm) of the transition 5D4 → 7F5 are given in Table 3. As in Eu3+:phosphors, Tb3+:phosphors were also characterized by computing the color coordi-nates ( ¯X, ¯Y ) (Table 3) and relative fluorescence intensity ratios (R) (Table 4). The obtained color coordinates ( ¯X,
¯Y) are superimposed on the CIE chromaticity diagram
(Fig. 9) to assess the color richness of the synthesized powder phosphors [19]. From Fig. 9, it is clear that the
Table 3
Emission level peak positions (λp, nm) for the transitions 5D4 →7F5
and color coordinates ( ¯X, ¯Y ) of LaPO4:Tb3+powder phosphors
Phosphor λp (nm) ¯X ¯Y GP-1 538 0.245 0.409 GP-2 537 0.225 0.436 GP-3 538 0.271 0.480 GP-4 539 0.262 0.427 GP-5 – 0.283 0.424
Fig. 8. TGA/DTA curves of (a1/b1) Gd0.95PO4:Eu0.053+, (a2/b2) La0.95PO4:Tb0.053+and (a3/b3) La0.95PO4:Ce0.053+powder phosphors.
obtained color coordinates ( ¯X, ¯Y ) are fitted appropriately in the green region (indicated by a marked portion). TGA of La0.95PO4:Tb0.053+ indicates the total 0.311% weight loss out of 54.6 mg. No appreciable weight loss in TGA (Fig. 8(a2)) and absence of any noticeable peak in DTA (Fig. 8(b2)) mode indicates thermal stability with respect to chemical as well as crystalline phase transformation changes, in a covered temperature range. As discussed in FT-IR spectrum of Gd0.95PO4:Eu0.053+ phosphor, in La0.95PO4:Tb0.053+(Fig. 6(b)), also we have observed two bunches of absorption frequencies attributable to complex M–OPO3 (M = La, Tb) bonds in the wave-number range 1200–900 and 700–400 cm−1, with noticeable little shift in the absorption frequencies [24,28]. From the recorded SEM image of the samples La0.95PO4:Tb0.053+(Fig. 7(b)), it is seen that the individual spherical particles are ag-glomerated. The grain size is observed to be in the range of 150–200 nm. Based on the computed color coordinates and relative fluorescence intensity ratios (R), the optimum
Table 4
Relative fluorescence intensity ratios (R) of LaPO4:Tb3+powder phosphors
Phosphor (5D4→7F3)/(5D4→7F6) (5D4→7F4)/(5D4→7F6) (5D4→7F)5/(5D4→7F6) (5D4→7F6)/(5D4→7F6) GP-1 0.583 0.708 1.583 1.000 0.750 0.666 GP-2 0.437 0.562 2.875 1.000 0.656 0.437 GP-3 0.620 0.721 3.025 1.000 0.810 0.569 GP-4 0.814 0.851 1.740 1.000 0.888 0.777 GP-5 – – – –
168 U. Rambabu et al. / Materials Chemistry and Physics 78 (2002) 160–169
Table 5
The relative fluorescence intensity ratios (R), emission level peak positions (λp, nm) and half width at full maxima ( λp, nm) for the transition 2D→2F
5/2of LaPO4:Ce3+ phosphors
Phosphor (2D→2F5/2)/(2D→2F7/2) (R) λp λp UVP-1 10.22 342 26.10 UVP-2 8.20 341 26.10 UVP-3 24.4 342 24.10 UVP-4 11.9 341 26.10 UVP-5 9.0 341 28.10
concentration of the dopant ion (Tb3+) has been found to be 5 mol.
3.3. Ce3+:phosphors
The trivalent Ce3+-ions have an electronic structure con-taining one 4f-electron and as an activator, they generally result in phosphors having broad band UV emission. In the rare earth phosphates, the emission bands of Ce3+ are not like those found in other materials[3]. From the mea-sured fluorescence spectra (Fig. 5) of Ce3+:phosphors, two bands corresponding to the following electronic transitions are identified[7,32,33]:
• 2D(5d) →2F
5/2(4f) (342–341 nm)
• 2D(5d) →2F
7/2(4f) (460–458 nm)
The emission transition 2D → 2F5/2 appears more in-tense and broader in all Ce3+:phosphors. The fluorescence intensity increase with an increase in Ce concentration up to 5 mol, beyond which, the fluorescence intensity tends to quench. It is also noticed that the peak positions of the emission bands have also changed significantly. Since, these phosphors are emitting in the UV region, we could not compute the color coordinates ( ¯X, ¯Y ), however the emission level peak positions (λp, nm) and their effective half width at full maxima ( λp, nm) are given inTable 5, which significantly change with the chemical composition. The synthesized powder phosphors are also characterized by calculating the relative fluorescence intensity ratios (R) (Table 5). TGA of La0.95PO4:Ce0.053+ indicates the to-tal 0.344% weight loss out of 66.73 mg. No appreciable weight loss in TGA (Fig. 8(a3)) and the absence of any noticeable peak in DTA (Fig. 8(b3)) mode indicates ther-mal stability with respect to chemical as well as crystalline phase transformation changes, in a covered temperature range. As has been discussed earlier, La0.95PO4:Ce0.053+ also gives same absorption peaks except a few cm−1 shift in the frequencies (Fig. 6(c)) [28]. From the SEM image of La0.95PO4:Ce0.053+ (Fig. 7(c)), it has been noticed that the particles are having spherical shape which tend to ag-glomerate and size in the range of 150–200 nm. Based on the relative fluorescence intensity ratios (R), the con-centration of the dopant ion Ce3+ has been optimized to be 5 mol.
4. Conclusions
We have synthesized rich color emitting Eu3+, Tb3+, and Ce3+-doped powder phosphors by employing a pre-cipitation technique. The phase purity has been verified by XRD and a FT-IR spectral analysis. Based on the color coordinates ( ¯X, ¯Y ) and relative fluorescence inten-sity ratios (R), the optimum concentration of each of the dopant ions (Eu3+, Tb3+ and Ce3+) has been identified to be 5 mol. From the scanning electron microscopic stud-ies, it has been noticed that the particles are spherical in shape with size varying from 150 to 200 nm, and they tend to agglomerate. From the thermal analysis studies, it has been found that these phosphor materials are quite stable. A systematic studies could therefore result in the formulation of Gd0.95PO4:Eu0.053+, La0.95PO4:Tb0.053+ and La0.95PO4:Ce0.053+ phosphors as the three materials in order to observe brighter reddish-orange, green and UV emission from certain electronic display systems.
Acknowledgements
One of the authors URB would like to express grateful thanks to Dr. B.K. Das, Executive Director, C-MET, Pune for his active support towards this work.
References
[1] A.P.D. Silva, V.A. Fassel, Anal. Chem. 45 (3) (1973) 542. [2] L.H. Brixner, Mater. Chem. Phys. 16 (1987) 253. [3] R.C. Ropp, J. Electrochem. Soc. 115 (1968) 841.
[4] J.D. Ghys, R. Mauricot, M.D. Faucher, J. Luminesc. 69 (1996) 203. [5] R.C.L. Mooney, Acta. Cryst. 3 (1950) 338.
[6] W.A. McAllister, J. Electrochem. Soc. 115 (5) (1968) 535. [7] R.C. Ropp, J. Electrochem. Soc. 115 (1968) 531.
[8] L. Schwarz, B. Finke, M. Kloss, A. Rohmann, U. Sasum, D. Haberland, J. Luminesc. 72–74 (1997) 257.
[9] M. Kloss, B. Finke, L. Schwarz, D. Haberland, J. Luminesc. 72–74 (1997) 684.
[10] B. Finke, L. Schwarz, P. Gurtler, M. Krass, M. Joppien, J. Becker, J. Luminesc. 60–61 (1994) 975.
[11] J. Brabier, J.E. Greedan, T. Asaro, G.J. McCarthy, Eur. J. Solid State Inorg. Chem. 27 (1990) 855.
[12] S. Erdei, F.W. Ainger, D. Ravichandran, W.B. White, L.E. Cross, Mater. Lett. 30 (1997) 389.
[13] S. Erdei, L. Kovacs, M. Martini, F. Meinardi, F.W. Ainger, W.B. White, J. Luminesc. 68 (1996) 27.
[14] U. Rambabu, K. Annapurna, T. Balaji, S. Buddhudu, Mater. Lett. 23 (1995) 143.
[15] U. Rambabu, K. Annapurna, T. Balaji, J.V.S. Narayana, S. Buddhudu, Spectrochim. Acta. A52 (1996) 367.
[16] U. Rambabu, T. Balaji, K. Annapurna, S. Buddhudu, Mater. Chem. Phys. 43 (1996) 195.
[17] U. Rambabu, T. Balaji, S. Buddhudu, Mater. Res. Bull. 30 (7) (1995) 891.
[18] U. Rambabu, K. Annapurna, T. Balaji, J.V.S. Narayana, K.R. Reddy, S. Buddhudu, Spectrosc. Lett. 29 (5) (1996) 833.
[19] U. Rambabu, P.K. Khanna, I.C. Rao, S. Buddhudu, Mater. Lett. 34 (1998) 269.
[20] C. Chateau, J. Holsa, J. Chem. Soc., Dalton Trans. 1575 (1990). [21] U. Rambabu, T. Balaji, S. Buddhudu, B. Electrochem. 14 (11) (1998)
351.
[22] P. Chen, T. Ilmah, J. Mater. Sci. 32 (1997) 3863. [23] R. Ray, H.A. McKinsty, Acta Crystallogr. 6 (1953) 365.
[24] U. Sasum, M. Kloss, A. Rohmann, L. Schwarz, D. Haberland, J. Luminesc. 72–74 (1997) 255.
[25] A. Bril, W.L. Wanmaker, B. Electrochem. Soc. 111 (12) (1964) 1363. [26] R. Jagannathan, S.P. Manoharan, R.P. Rao, R.L. Narayana, J.
Electrochem. 4 (6) (1988) 597.
[27] Herzberg, Infrared and Raman Spectra of Polyatomic Molecules, Van Nostrand, Princeton, NJ, 1945, 162 pp.
[28] A. Hezel, S.D. Ross, Spectrochim. Acta. 22 (1966) 1949. [29] N. El Jouhari, C. Parent, G. Le Flem, J. Solid State Chem. 123
(1996) 398.
[30] S.L. Issler, C.C. Torardi, J. Alloys Compd. 229 (1995) 54. [31] Y.-J. Wang, W.- Zhao, M.-Z. Su, J. Luminesc. 40–41 (1988) 177. [32] T. Welker, C.R. Ronda, K.J.B.M. Niewesteeg, J. Electrochem. Soc.
138 (2) (1991) 602.