行政院國家科學委員會專題研究計畫 期中進度報告
花青素在乙醇溶液中顏色表現之研究(1/2)
計畫類別: 個別型計畫 計畫編號: NSC93-2313-B-002-052- 執行期間: 93 年 08 月 01 日至 94 年 07 月 31 日 執行單位: 國立臺灣大學食品科技研究所 計畫主持人: 吳瑞碧 共同主持人: 張鴻民 計畫參與人員: 曾國展 報告類型: 精簡報告 處理方式: 本計畫可公開查詢中 華 民 國 94 年 4 月 25 日
行政院國家科學委員會補助專題研究計畫期中進度報告
花青素在乙醇溶液中顏色表現之研究(1/2)
計畫類別:■ 個別型計畫 □ 整合型計畫
計畫編號:NSC 93-2313-B-002-052
執行期間:九十三年八月一日 至 九十四年七月三十一日
計畫主持人:吳瑞碧 教授
共同主持人:張鴻民 教授
計畫參與人員:曾國展 研究生
成果報告類型(依經費核定清單規定繳交):■精簡報告 □完整報告
本成果報告包括以下應繳交之附件:
□赴國外出差或研習心得報告一份
□赴大陸地區出差或研習心得報告一份
□出席國際學術會議心得報告及發表之論文各一份
□國際合作研究計畫國外研究報告書一份
處理方式:除產學合作研究計畫、提升產業技術及人才培育研究計畫、
列管計畫及下列情形者外,得立即公開查詢
□涉及專利或其他智慧財產權,□一年□二年後可公開查詢
執行單位:國立臺灣大學食品科技研究所
中 華 民 國 九十四 年 四 月 二十三 日
中文摘要 本試驗以國產黑后葡萄為試驗材料,利用還原酒及pH 3.5 之花青素乙醇模式溶液來探 討乙醇濃度對紅酒及利口酒中花青素呈色之影響。實驗結果顯示,還原酒之pH 值及 Hunter a 值(紅色度)隨著乙醇濃度的增加而增加;花青素乙醇模式溶液中,Hunter a 值亦隨著乙醇 濃度的增加而增加。在花青素模式溶液及 malvidin-3-glucoside 模式溶液中,其最高吸收波 長均有明顯向長波長偏移之現象(bathochromic shift),乙醇濃度越高偏移越多。高濃度模式 溶液(500 mg anthocyanin/L)經 95 ℃反應 48 小時後,可明顯的觀察到沉澱現象產生;在低 濃度模式溶液(50 mg anthocyanin/L)中,其花青素之褪色與乙醇濃度呈正相關;花青素模式 溶液與甘油模式溶液在相同的水活性下其褪色速率明顯不同。綜觀上述各項結果,我們認 為乙醇可能經由與花青素分子間的交互作用而影響花青素在紅酒及利口酒中之呈色。 關鍵字:花青素、紅酒、乙醇、bathochromic shift、褪色
英文摘要
Reconstituted red wines, pH 3.5 ethanolic model solutions of grape anthocyanin, and pH 3.5 malvidin-3-glucoside model solutions were prepared as model systems to investigate the change in color phenomena in red wine and liqueur as affected by ethanol concentration. The pH value and Hunter a value (redness) increased with an increase in ethanol concentration in the reconstituted wine. Hunter a value also increased with an increase in ethanol concentration in the anthocyanin model solution. Bathochromic shifts of anthocyanin occurred in both of the anthocyanin model solution and the malvidin-3-glucoside model solution upon the increase in ethanol concentration, indicating that some direct interaction between ethanol and anthocyanin molecules exists and affects the color phenomena of anthocyanin in red wine and liqueur. A mechanism based on the copigmentation between ethoxide anions and flavylium cations is proposed. Anthocyanin solutions at 500 mg/L, which is within the range of anthocyanin concentration in common red wines, are easier to degrade in high ethanol concentrations than in low concentrations, while easier to polymerize in low ethanol concentrations than in high concentrations.
1. Introduction
The structure and content of anthocyanin affect greatly the quality of red wine and fruit liqueur. Factors such as pH value, acidity, and ion species influence the structure of anthocyanin, which is liable to form flavylium cation in acidic solution and make the solution looked reddish (1). Flavylium cation is highly reactive with many nucleophiles due to its lack of electrons, and thus leads to the instability of anthocyanin. At a typical red wine pH of 3.5, about 6 % of total anthocyanin are in the form of flavylium cations (2).
The copigmentation reaction in anthocyanin was first reported by Robinson and Robinson (3). Copigmentation of anthocyanin plays an important role in the aging process of red wine. The loss in color during red wine aging is mainly due to the destruction of pigments that have been formed by self-association between anthocyanin molecules or by copigmentation between anthocyanin and other phenolics (flavan-3-ols, flavone-glycosides, etc.) (3-5). Asenstorfer et al. (6) indicated that at wine pH, increasing the ethanol concentration increases the concentration of quinonoidal base while decreases the concentration of the colourless hemiketal and chalcone forms. The addition of ethanol to red wine enhances the redness right away (7), probably because ethanol dehydrates hemiketals and chalcones to form flavylium cations and quinonoidal base or because ethanol decreases the hydration of flavylium cations (8). An increase in the concentration of ethanol may also result in an increase in pH value and a decrease in the degree of copigmentation of anthocyanin in Cencibel young red wine (9). All the experiments in these reports were performed in a system containing no more than 22 % ethanol to simulate common red wines and/or Porto wine. Fruit liqueurs at higher ethanol concentrations have not been covered yet.
The possibility for ethanol to be a reactant in alcoholic beverages for chemical reactions other than esterification is often neglected. We proved that ethanol affects the mechanism of Maillard reaction in a previous paper (10), and produces new compounds (11). Based on a similar logic, it is possible for ethanol to affect the color in red wine and liqueur through some unreported direct interaction with anthocyanin in addition to all the reported mechanisms, including a change in pH, water activity, the degree of self-association of anthocyanin molecules, and the degree of copigmentation between anthocyanin and some other solute.
The present study is focused to evaluate the possibility of a direct interaction between ethanol and anthocyanin through the investigation on the color phenomena of anthocyanin in ethanolic model solutions.
2. Materials and methods 2.1. Materials
Fresh red grape (Vitis labrusca x Vitis vinifera L. cv. Black Queen) harvested in Taichung County, Taiwan, in July 2003 was used for making young red wine (YRW) and for extracting anthocyanin.
2.2. Reagents
Switzerland). Acetic acid, acetonitrile, ethanol, hydrochloric acid, and formic acid were from Merck (Darmstadt, Germany). Acetone and methyl alcohol were from Mallinckrodt (Paris, KY, USA). Amberlite XAD-7 and sodium metabisulfite were from Sigma (St. Louis, MO, USA). Ethanol (95 %) was from Taiwan Tobacco & Liquor Corporation (Taipei, Taiwan). Yeast (Saccharomyces cerevisiae HP01) was supplied by courtesy of Dr. R. C. Yu in Institute of Food Science and Technology, National Taiwan University. Anthocyanin standards, including cyanidin-3-glucoside, delphinidin-3-glucoside, malvidin-3-glucoside, peonidin-3-glucoside, and petunidin-3-glucoside were from Extrasynthese (Génay, France).
2.3. Isolation and identification of anthocyanins
Grape was blended, mixed with 0.1 % HCl/methanol solution, set aside for overnight, filtered through cheese-cloth and filter paper, and then concentrated under reduced pressure in a rotary evaporator (Rotavapor R110, Buchi, Switzerland) to approximately 5-fold. The concentrate was filtered through No.1 filter paper. The filtrate was injected to an Amberlite XAD-7 column (6.0 x 40 cm). The column was eluted first with distilled water, and then with 0.1 % HCl/methanol solution. The eluate was concentrated under reduced pressure, and then filtered to obtain anthocyanin solution for the following experiments.
The identification of anthocyanins was done adopting the method developed by Goiffon et al. (12). Briefly, the anthocyanin solution was centrifuged (10,000 x g, 15 min, 10 ℃), and then filtered through a 0.45 µm membrane filter for high performance liquid chromatography (HPLC) analysis. The HPLC conditions are: MetaChem Polaris C18 column (5 µm packing, 250 x 4.6 mm); 20 µL injection volume; water/acetonitrile/formic acid = 84/6/10 (v/v/v) as the mobile phase; 1.0 mL/min flow rate; and UV970 Intelligent UV/Visible Detector (Jasco, Tokyo, Japan) at 525 nm. Anthocyanin standards were injected into the HPLC column to identity the peaks in the chromatogram by comparing the retention times.
2.4. Preparation of YRW
Grape was washed, set aside to dry, and then pulped. Cane sugar and sodium metabisulfite were added to reach 24 °Brix and 100 ppm respectively. Yeast at 106 CFU/mL was then inoculated. Fermentation was conducted at ambient temperature for 14 days, followed by filtration through cheese-cloth to collect YRW.
The ethanol concentration (%, v/v) in YRW was determined following the distillation and hydrometric method described by Zoecklein et al. (13). The titratable acidity of the fresh grape juice and YRW was evaluated adopting AOAC (14), and expressed as % tartaric acid (w/w). The volatile acidity was evaluated adopting AOAC (15), and expressed as g/L acetic acid. Total anthocyanin was determined following the spectrophotometric method reported by Cheng and Breen (16) based on the difference in absorbance 520 nm at pH 1.0 and pH 4.5.
2.5. Preparation of reconstituted wines
Reconstituted wines with 0-50 ethanol content were prepared to simulate common red table wine, fortified wine and fruit liqueur in studying the effect of ethanol concentration on color
phenomena. Reconstitution was done following the procedure reported by Hermosín-Gutiérrez (9) except that the step of pH adjustment was not performed. YRW was centrifuged (10,000 x g, 15 min, 10 ℃) to obtain the supernatant. It was then evaporated under reduced pressure to 30 % of the original volume. Ethanol and distilled water in different ratios were added to the concentrate to make up the volume lost.
The titratable acidity, volatile acidity and total anthocyanin in the reconstituted wines were determined employing the above-described methods.
2.6. Preparation of anthocyanin model solutions
Referring to Romero and Bakker (17-18), ethanol and distilled water was added to the anthocyanin solution to prepare 25 mM tartaric acid/NaOH pH 3.5 buffered 0-80 % ethanol model solutions at 500 mg or 50 mg anthocyanin/L. The total anthocyanin in the solution was then determined employing the above-described spectrophotometric method.
For comparison in the same range of water activity, 1.00-0.76, 25 mM tartaric acid/NaOH pH 3.5 buffered 0-61 % glycerol solutions at 50 mg anthocyanin/L were also prepared referring to Ross (19).
2.7. Preparation of malvidin-3-glucoside model solutions
The 50 % ethanol solution of 50 mg malvidin-3-glucoside/L buffered with 25 mM tartaric acid/NaOH at pH 3.5 was prepared also referring to Romero and Bakker (17-18). The aqueous solution was prepared to be a control.
2.8. Color measurement and stability test of anthocyanin solutions
Samples of reconstituted wines, ethanolic model solutions of anthocyanin, and malvidin-3-glucoside model solutions were scanned from 250 to 700 nm using a UV-Visible spectrophotometer (Model Herios Alpha, Spectronic Unicam, Cambridge, England). Samples of reconstituted wines and ethanolic model solutions of anthocyanin were also monitored for Hunter’s L (brightness), a (redness-greenness), and b (yellowness-blueness) values using a color difference meter (Model TC-1500 DX, Tokyo Denshoku Co., Tokyo, Japan), comparator block: X, 90.85; Y, 92.85; Z, 103.12.
Thermal treatments were conducted as accelerated tests to predict the stability of anthocyanin in long-term storage. The reconstituted wines and anthocyanin model solutions were exhausted using a vacuum pump (V-500, Buchi, Switzerland). Samples each 4 mL in volume were taken, sealed in 4.5 mL glass vials, then placed in a water bath at 95 ± 1 ℃. The reconstituted wines and 500 mg anthocyanin/L ethanolic model solutions were incubated for up to 48 hr, while the incubation time for 50 mg anthocyanin/L samples was limited to 14 hr. The optical absorbency at 530 nm of the heated samples was monitored to evaluate the color stability of anthocyanin. The 500 mg anthocyanin/L ethanolic model solutions were stirred after incubation to suspend the precipitates, and then monitored using a turbidity meter (Cyberscan IR Murbidimeter Model TB-1000, Eutech Instruments, Singapore) for the turbidity as a measure of the extent of polymerization.
2.9 Statistical analysis
All experiments were conducted in triplicates. The comparison among grape juice, YRW and the 12 % reconstituted wine pertaining to titratable acidity, volatile acidity, and total anthocyanin was done by analysis of variance and Duncan’s multiple range test (P < 0.05).
3. Results and discussion
3.1. Isolation and identification of anthocyanins
The anthocyanins in Black Queen grape include delphinidin-3-glucoside (Dp-3-glc, peak #1, 2.1 % of total anthocyanin), cyanidin-3-glucoside (Cy-3-glc, peak #2, 10.6 % of total anthocyanin), petunidin-3-glucoside (Pt-3-glc, peak #3, 7.4 % of total anthocyanin), peonidin-3-glucoside (Pn-3-glc, peak #4, 29.0 % of total anthocyanin), and malvidin-3-glucoside (Mv-3-glc, peak #5, 49.3 % of total anthocyanin, predominant) (Figure 1). Goiffon et al. (12) reported previously that a European cultivar contained all the above-mentioned five types of anthocyanin with Mv-3-glc as the predominant one. Mv-3-glc was also reported to be the predominant anthocyanin in other grapes by Williams et al. (20), McCloskey and Yengoyan (21), Hebrero et al. (22), and Gao and Cahoon (23).
3.2. Properties of grape juice, YRW, and reconstituted wines
The pH value, titratable acidity, volatile acidity, and total anthocyanin of the grape juice used in the present study are 3.28, 1.09 % (as tartaric acid), 0.09 g/L (as acetic acid), and 211 mg/L, respectively (Table 1). After a fermentation period of 14 days, the pH value of YRW rose to 3.50 with an ethanol content of 12 % (v/v) approximately. The anthocyanin concentration increased to 440 mg/L, presumably due to the release of this pigment from grape skin.
The reconstituted wine at 12 % ethanol concentration is characterized with a pH value of 3.42 and a total anthocyanin content of 414 mg/L (Table 1). No much difference in physico-chemical properties are found between the YRW and the reconstituted wine at 12 % ethanol concentration, indicating that reconstituted wines can be an adequate model system for studying the effect of ethanol concentration on the color phenomena of red wine and liqueur.
3.3. Effect of ethanol on pH and color of reconstituted wine
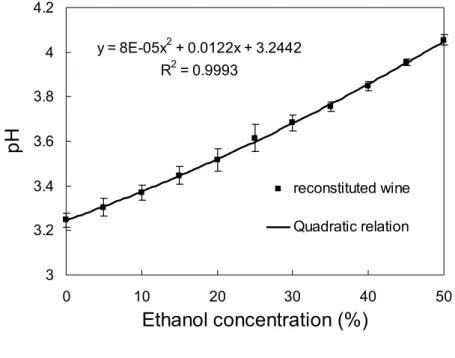
Figure 2 shows pH value versus ethanol concentration in the reconstituted wines. The pH
value increased from 3.25 to 4.05 with an increase in ethanol concentration from 0 to 50 %, in a well-adjusted quadratic relation (R2=0.9993) (Figure 2A). Hermosín-Gutiérrez (9) reported that
an increase in ethanol content in reconstituted Cencibel young red wine (ethanol content: 0 to 22 %) was accompanied by an increase in the pH value. Shen and Wu (10) observed a similar trend of pH change when the concentration of ethanol in glucose-glycine solution was varied. Ethanol seems to introduce changes in the pH values in aqueous media.
In Figure 2B, Hunter a value (redness) increases from 23 to about 29 when ethanol concentration increases from 0 to 40 %. The a value then decreases to about 27 as the ethanol content further increases to 50 %. The shift in pH, as proposed by Hermosín-Gutiérrez (9), and
the shift in absorption spectrum are among the possible reasons for the change in a value. The changes in L and b values, or brightness and blueness, are less pronounced throughout the range of ethanol concentration between 0 and 50 %.
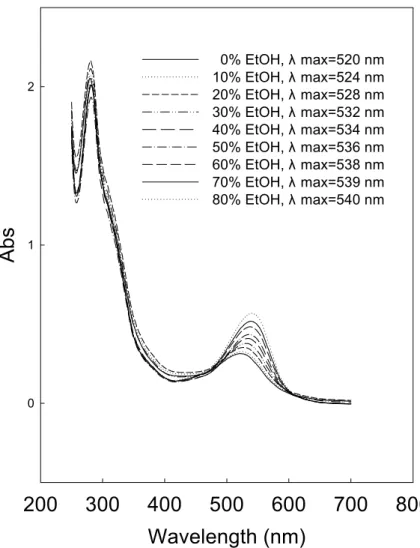
3.4. UV-Visible spectra of ethanolic model solutions of anthocyanin
Mazza and Brouillard (24) reported that a change in pH value affects the distribution of anthocyanin in different structures. Hermosín-Gutiérrez (9) attributed the change in color in Cencibel young red wine upon the addition of ethanol to the change in pH value. The same theory can be applied to explain the color difference among the reconstituted wines in various ethanol concentrations in the present study. However, the effect from an interaction between anthocyanin and other components, including ethanol, cannot be neglected.
The ethanolic model solutions of anthocyanin were prepared to investigate the interaction between anthocyanin and ethanol. Bathochromic shifts occur in the spectra of model solutions at pH 3.5 containing 0-80 % ethanol (Figure 3). The maximum absorption wavelength (λmax) shifts from 520 to 540 nm when the ethanol concentration increases from 0 to 80 %. The difference in λmax (∆λ) between aqueous solution and the ethanolic solution of anthocyanin increases with the increase in ethanol concentration, reaching the maximum value of 20 nm at 80 % ethanol.
Ethanol may affect the copigmentation between malvin and chlorogenic acid (25). An increase in ethanol concentration reduces the extent of copigmentation of anthocyanin in ethanolic solution kept at a constant pH (9). The copigmentation of anthocyanin is usually accompanied by a positive shift in the wavelength of the absorption maximum of the visible band (bathochromic shift) (25, 26). Following their logic, an increased concentration of ethanol would result in a negative shift in the wavelength of the absorption maximum of the visible band (hypsochromic shift). However, in the present study, a higher concentration of ethanol corresponds to a higher extent of bathochromic shift in the ethanolic model solutions of anthocyanin (Figure 3). The ethanolic model solutions contain only anthocyanins and ethanol. The concentration of ethanol is the only variable among the model solutions. The bathochromic shift indicates the occurrence of some direct interaction between anthocyanin and ethanol molecules.
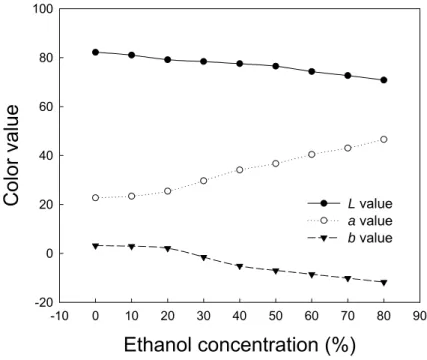
3.5. Color of ethanolic model solution of anthocyanin versus ethanol concentration and pH value
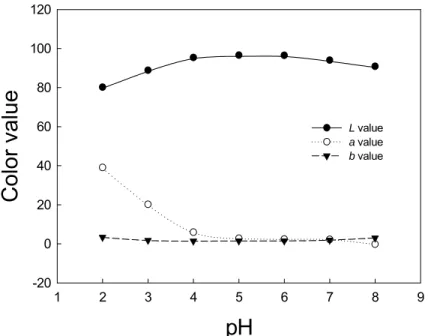
The Hunter L and b values decrease while a value increases with the increasing level of ethanol in anthocyanin model solutions buffered at pH 3.5 (Figure 4). The redness in aqueous solution of anthocyanin decreases as the pH value increases, suggesting a concomitant decrease in flavylium cations (Figure 5). According to Mazza and Brouillard (24), the amount of flavylium cations in aqueous cyaniding-3,5-diglucoside solution decreases with an increase in pH value from 2.21 to 10.66.
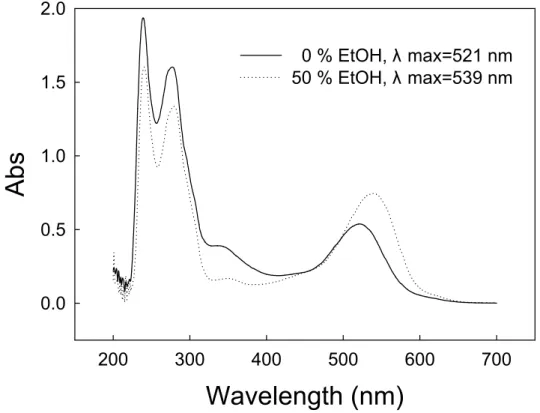
Similar to the results in ethanolic model solutions of anthocyanin (Figure 3A), bathochromic shift also occurs in the pH 3.5 ethanolic model solutions of malvidin-3-glucoside (Figure 6). The maximum absorption wavelength shifts from 521 to 539 nm when ethanol concentration increases from 0 to 50 %. The difference in λmax (∆λ) between aqueous solution and 50 % ethanolic solution of malvidin-3-glucoside is 18 nm. The profiles of UV-Visible spectra of aqueous and 50 % ethanol malvidin-3-glucoside solutions at pH 3.5 are different, indicating that ethanol molecules are able to affect the color phenomena.
Based on the above-described findings, we propose a hypothesis on the interaction between ethanol and anthocyanin molecules as follows:
(1) The water molecules in ethanolic solutions dissociate into hydroxide anions (OH-) and hydrogen cations (H+). The OH- anions induce the dissociation of ethanol molecules into ethoxide anions (CH3CH2O-) and H+ cations.
(2) The CH3CH2O- anions copigment with flavylium cations then, and cause a bathchromic shift
more than enough to offset the hypsochromic shift resulted from the weakening of self-association among anthocyanin molecules.
(3) Any further increase in ethanol concentration produces more CH3CH2O- anions to react with
more flavylium cations, and causes further bathchromic shift.
3.7. Color stability of anthocyanin
Thermal treatment was conducted as an accelerated study to forecast the color stability of anthocyanin in long-term storage. The anthocyanin used in the model system was a mixture of five chemical species. Each species has its own absorption spectrum. We had to choose a wavelength to stand for the overall color appearance. The λmax’s of these anthocyanin species vary in the range between 520 nm and 540 nm with the ethanol concentration in the anthocyanin model solutions (Figure 3). In pretests, we found the changes in color of the ethanolic model solutions of anthocyanin as measured at 520 nm, 525 nm, 530 nm, 535 nm and 540 nm follow the same pattern. A wavelength in the middle, 530 nm, was thus chosen the detecting wavelength in the present study.
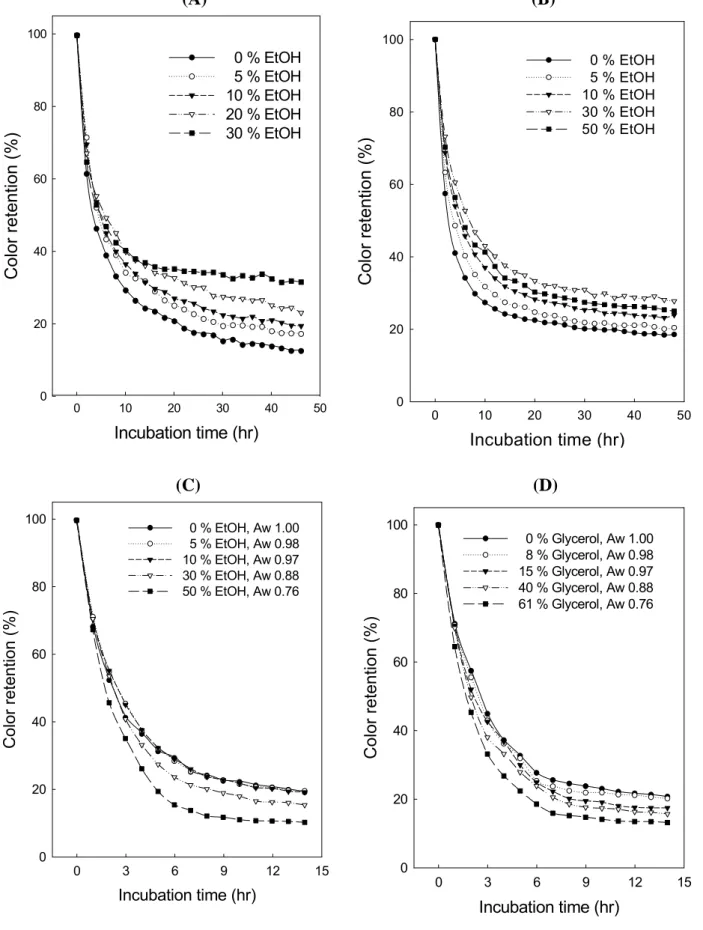
The color retention of anthocyanin at 95 ℃ is shown in Figure 7. Fast discoloration occurred in the incubation of all the reconstituted wine samples in 10 hr (Figure 7A), with the ethanol-free control being the fastest (down to about 29.5 %), followed by the 5 % ethanol sample (34.4 %), the 10 % ethanol sample (36.8 %), the 20 % ethanol sample (40.2 %), and the 30 % ethanol sample (40.6 %). Precipitates were found in each sample but the quantity decreased with the increasing concentration of ethanol. The precipitate could be a result of any interaction among various components such as sugars, organic acids, amino acids, proteins, anthocyanins, and phenolic compounds.
To rule out the contribution of components other than anthocyanins in the formation of precipitates, ethanolic model solutions of anthocyanin were incubated and investigated. The rates of discoloration of anthocyanin in these samples are all fast (Figure 7B), similar to the results in
Figure 7A. The contents of precipitates in low concentration ethanol samples as judged by visual
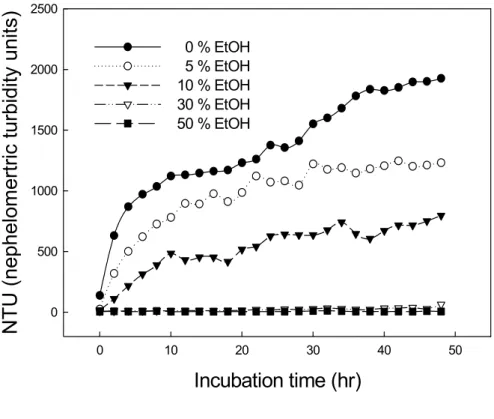
suspended particles in the result of turbidity test reconfirmed the order (Figure 8A). We found that the precipitates couldn’t dissolve in either water or ethanol. Obviously the precipitation was not resulted from a change in solubility.
No precipitation was observed in the 30 and 50 % ethanolic model solutions containing 500 mg anthocyanin/L in the stability test (Figure 7B), and in the turbidity test as well (Figure 8A). More precipitates and lighter color are observed in the incubated 0-10 % ethanolic solutions containing 500 mg anthocyanin/L than in the 30-50 % samples (Figure 8B). There is higher loss of color in the 50 % ethanolic samples than the 30 % ethanolic samples, which may be attributed to a weakened self-association in the former. Therefore, we conclude that anthocyanin solutions at 500 mg/L are easier to degrade in higher ethanol concentrations, while easier to polymerize in lower ethanol concentrations.
The formation of precipitate affects the result of the color measurement. In the pretest, we found that the ethanolic model solutions containing 50 mg anthocyanin/L allowed no precipitation. Therefore, these model solutions were used in the present study.
The incubation of all the 50 mg anthocyanin/L ethanolic model solutions at 95 ℃ for 14 hr led to a fast reduction of color without precipitation (Figure 7C), indicating the predominance of degradation over polymerization in these samples. Among them, samples with higher ethanol concentrations degraded more easily and therefore discolored more rapidly. Hermosin-Gutiérrez (9) reported the same trend in Cencibel young red wine. The decrease in the stability of anthocyanin can be attributed to a higher content of free flavylium cations resulted from the increase in the concentration of ethanol.
Fast discoloration of anthocyanin was also observed during incubation of 50 mg anthocyanin/L glycerolic model solutions (Figure 7D), similar to the results in ethanolic model solutions (Figure 7C). Garzon and Wrolstad (27) reported that the degree of anthocyanin degradation increases with water activity in glycerolic solutions. However, the degree of anthocyanin degradation in our experiments decreases with water activity (1.0-0.76) in both ethanolic and glycerolic model solutions kept at pH 3.5 (Figures 7C and 7D). Meanwhile, the rate of discoloration of anthocyanin in glycerolic model solutions differs from that in ethanolic solutions at the same water activity. Therefore, a change in the degree of hydration of flavylium cations by the addition of ethanol, as proposed by Ribereau-Gayon et al. (8), cannot account for all the changes in the stability of anthocyanin in the present study. The occurrence of some direct interaction between ethanol and anthocyanin molecules is revealed.
References
(1) Clifford, M. N. Anthocyanins-nature, occurrence and dietary burden. J. Sci. Food Agric. 2000, 80, 1063-1072.
(2) Darias-Martin, J.; Carrillo, M.; Diaz, E.; Boulton, R. B. Enhancement of red wine colour by pre-fermentaion addition of copigments. Food Chem. 2001, 73, 217-220.
(3) Robinson, G. M.; Robinson, R. A survey of anthocyanins. I. Biochem. J. 1931, 25, 1687-1705.
(4) Somers, T. C.; Evans, M. Grape pigment phenomena: Interpretation of major color lossed during vinification. J. Sci. Food Agric. 1979, 30, 623-633.
(5) Boulton, R. B. The copigmentation of anthocyanins and its role in the color of red wine: A critical review. Am. J. Enol. Vitic. 2001, 52, 67-87.
(6) Asenstorfer, R. E.; Iland, P. G.; Tate, M. E.; Jones, G. P. Charge equilibria and pKa of malvidin-3-glucoside by electrophoresis. Anal. Biochem. 2003, 318, 291-299.
(7) Berg, H. W.; Akiyoshi, M. A. On the nature of reactions responsible for color behavior in red wine: a hypothesis. Am. J. Enol. Vitic. 1975, 26, 134-143.
(8) Ribereau-Gayon, P.; Pontallier, P.; Glories, Y. Some interpretations of colour changes in young red wines during their conservation anthocyanins, tannins. J. Sci. Food Agric. 1983, 34, 506-516.
(9) Hermosín-Gutiérrez, I. Influence of ethanol content on the extent of copigmentation in a Cencibel young red wine. J. Agric. Food Chem. 2003, 51, 4079-4083.
(10) Shen, S. C.; Wu, J. S. B. Maillard browning in ethanolic solution. J. Food Sci. 2004, 69, 273-279.
(11) Shen, S. C.; Tseng, K. C.; Wu, J. S. B. Studies in kinetics and semi-products of Maillard browning in ethanolic solution. IFT Annual Meeting 2005, paper 98B-6.
(12) Goiffon, J. P.; Mouly, P. P.; Gaydou, E. M. Anthocyanic pigment determination in red fruit juices, concentrated juices and syrups using liquid chromatography. Anal. Chim. Acta. 1999, 382, 39-50.
(13) Zoecklein, B. W.; Fugelsang, K. C.; Gump, B. H.; Nury, F. S. Production Wine Analysis; Van Nostrand Reinhold: New York, 1990; pp 161-166.
(14) AOAC. Official Methods of Analysis, 14th ed.; Association of Official Analytical Chemists: Washington DC, 1984a; Section 11.042.
(15) AOAC. Official Methods of Analysis, 14th ed.; Association of Official Analytical Chemists: Washington DC, 1984b; Section 11.043.
(16) Cheng, G.; Breen, P. J. Activity of phenylalanine ammonia-lyase (PAL) and concentrations of anthocyanins and phenolics in developing strawberry fruit. J. Am. Soc. Hortic. Sci. 1991, 116, 865-869.
(17) Romero, C.; Bakker, J. Effect of storage temperature and pyruvate on kinetics of anthocyanin degradation, vitisin A derivative formation, and color characteristics of model solutions. J. Agric. Food Chem. 2000, 48, 2135-2141.
(18) Romero, C.; Bakker, J. Effect of acetaldehyde and several acids on the formation of vitisin A in model wine anthocyanin and colour evolution. Int. J. Food Sci. Technol. 2000, 35, 129-140. (19) Ross, K. D. Estimation of water activity in intermediate moisture foods. Food Technol. 1975,
(20) Williams, M.; Hrazdina, G.; Wilkinson, M. M.; Sweeny, J. G.; Iacobucci, G. A. High-pressure liquid chromatographic separation of 3-glucosides, 3, 5-diglucosides, 3-(6-O-p-coumaryl)glucosides and 3-( 6-O-p-coumarylglucoside)-5-glucosides of anthocyanidins (from fruits and their products). J. Chromatogr. 1978, 155, 389-398.
(21) McCloskey, L. P.; Yengoyan, L. S. Analysis of anthocyanins in Vitis vinifera wines and red color versus aging by HPLC and spectrophotometry high pressure liquid chromatography. Am. J. Enol. Vitic. 1981, 32, 257-261.
(22) Hebrero, E.; Santos-Buelga, C.; Rivas-Gonzalo, J. C. High performance liquid chromatography-diode array spectroscopy identification of anthocyanins of Vitis vinifera variety Tempranillo. Am. J. Enol. Vitic. 1988, 39, 227-233.
(23) Gao, Y.; Cahoon, G. A. High performance liquid chromatographic analysis of anthocyanins in the red seedless table grape Reliance. Am. J. Enol. Vitic. 1995, 46, 339-345.
(24) Mazza, G.; Brouillard, R. Color stability and structural transformations of cyaninin 3,5-diglucoside and four 3-deoxyanthocyanins in aqueous solutions. J. Agric. Food Chem.
1987, 35, 422-426.
(25) Brouillard, R.; Wigand, M. C.; Dangles, O.; Cheminat, A. pH and solvent effects on the copigmentation reaction of malvin with polyphenols, purine and pyrimidine derivatives. J. Chem. Soc. Perkin Trans. 2. 1991, 1235-1241.
(26) Mirabel, M.; Saucier, C.; Guerra, C.; Glories, Y. Copigmentation in model wine solutions: Occurrence and relation to wine aging. Am. J. Enol. Vitic. 1999, 50, 211-218.
(27) Garzon, G. A.; Wrolstad, R. E. The stability of pelargonidin-based anthocyanins at varying water activity. Food Chem. 2001, 75, 185-196.
4 5 2
3 1
Figure 1. HPLC chromatogram of Black Queen grape anthocyanins.
Experiment conditions: column, MetaChem Polaris C18 (5 µm packing, 250 x 4.6 mm); injection volume, 20 µL; mobile phase, water/acetonitrile/formic acid = 84/6/10 (v/v/v); flow rate, 1.0 mL/min.
Peaks 1-5 are: delphinidin-3-glucoside, cyanidin-3-glucoside, petunidin-3-glucoside, peonidin-3-glucoside, and malvidin-3-glucoside, respectively.
(A) y = 8E-05x2 + 0.0122x + 3.2442 R2 = 0.9993 3 3.2 3.4 3.6 3.8 4 4.2 0 10 20 30 40 5 Ethanol concentration (%) pH reconstituted wine Quadratic relation 0
Ethanol concentration (% )
0 10 20 30 40 50Color
v
alue
0 10 20 30 40 L value a value b value (B)Figure 2. Changes of (A) pH, and (B) Hunter L, a, b values versus ethanol concentration (%, v/v) in reconstituted wines. Bars in the curve refer to standard deviations. Each value represents the average of three determinations.
Wavelength (nm)
200
300
400
500
600
700
800
Abs
0 1 2 0% EtOH, λ max=520 nm 10% EtOH, λ max=524 nm 20% EtOH, λ max=528 nm 30% EtOH, λ max=532 nm 40% EtOH, λ max=534 nm 50% EtOH, λ max=536 nm 60% EtOH, λ max=538 nm 70% EtOH, λ max=539 nm 80% EtOH, λ max=540 nmEthanol concentration (%)
-10 0 10 20 30 40 50 60 70 80 90Color value
-20 0 20 40 60 80 100 L value a value b valueFigure 4. Hunter L, a, b values of 25 mM tartaric acid/1N NaOH buffered anthocyanin ethanolic
pH
1 2 3 4 5 6 7 8 9Color value
-20 0 20 40 60 80 100 120 L value a value b valueFigure 5. Hunter L, a, b values of anthocyanin aqueous model solutions at pH 2.0-8.0. The pH
2.0 and 3.0 aqueous solutions contained 1 mM H3PO4/1 N KOH buffer, and pH 4.0-8.0 solutions
contained 1mM KH2PO4/1 N KOH buffer. Each value represents the average of three
Wavelength (nm)
200 300 400 500 600 700Abs
0.0 0.5 1.0 1.5 2.0 0 % EtOH, λ max=521 nm 50 % EtOH, λ max=539 nmFigure 6. UV-Visible spectra at the maximum absorption wavelength of pH 3.5
Incubation time (hr) 0 10 20 30 40 50 Color retention (%) 0 20 40 60 80 100 0 % EtOH 5 % EtOH 10 % EtOH 30 % EtOH 50 % EtOH Incubation time (hr) 0 10 20 30 40 50 Color retention (%) 0 20 40 60 80 100 0 % EtOH 5 % EtOH 10 % EtOH 20 % EtOH 30 % EtOH (A) (B) Incubation time (hr) 0 3 6 9 12 15 Color retention (%) 0 20 40 60 80 100 0 % EtOH, Aw 1.00 5 % EtOH, Aw 0.98 10 % EtOH, Aw 0.97 30 % EtOH, Aw 0.88 50 % EtOH, Aw 0.76 Incubation time (hr) 0 3 6 9 12 15 Color retention (%) 0 20 40 60 80 100 0 % Glycerol, Aw 1.00 8 % Glycerol, Aw 0.98 15 % Glycerol, Aw 0.97 40 % Glycerol, Aw 0.88 61 % Glycerol, Aw 0.76 (C) (D)
Figure 7. Color retention during incubation at 95 ℃ in (A) reconstituted wines, (B) 500 mg anthocyanin/L ethanolic model solutions, (C) 50 mg anthocyanin/L ethanolic model solutions, and (D) 50 mg anthocyanin/L glycerolic model solutions. The detecting wavelength was 530 nm. Each value represents the average of three determinations.
Incubation time (hr)
0 10 20 30 40 50NT
U (
nephelomert
ric t
urbidit
y unit
s)
0 500 1000 1500 2000 2500 0 % EtOH 5 % EtOH 10 % EtOH 30 % EtOH 50 % EtOH(A) (B)
Ethanol 0 % 5 % 10 % 30 % 50 %
Figure 8. (A)Turbidity changes in 500 mg anthocyanin/L ethanolic model solutions during
incubation at 95 ℃, each value represents the average of three determinations; and (B) a photo of the model solutions incubated at 95 ℃ for 48 hr.
Table 1. Some physico-chemical properties of Black Queen grape juice, the young red
wine and the reconstituted winea, b
Item Grape juice Young red wine
Reconstituted wine
Ethanol concentration (Vol. %) -c 12.0 ± 0.5a 12.0 ± 0.5a
PH 3.28 ± 0.01c 3.50 ± 0.01a 3.42 ± 0.03b
Titratable acidity (as g tartaric acid/100 mL)
1.09 ± 0.01a 0.94 ± 0.01b 0.90 ± 0.02c
Volatile acidity (as g acetic acid/L)
0.09 ± 0.01b 0.21 ± 0.01a 0.20 ± 0.02a
Total anthocyanins (mg/L) 211 ± 7b 440 ± 10a 414 ± 15a
a Each value represents the average of three determinations.
b Different letters (a-c) within the same row are significantly different (P < 0.05) in Duncan’s
multiple range test.