The Synthesis and Characteristics of Vanadoaluminosilicate MCM-41
Mesoporous Molecular Sieves
DER-SHING LEE∗ AND TSUNG-KWEI LIU
Department of Geosciences, National Taiwan University, 245 Choushan Road, Taipei 106, Taiwan
yuwenche@ms28.hinet.net
Received September 14, 2000; Accepted April 20, 2001
Abstract. A series of vanadoaluminosilicate MCM-41 mesoporous molecular sieves with various compositions have been hydrothermally synthesized. Hexadecyltrimethylammonium bromide was used as a surfactant in the synthesis. The samples were characterized with nitrogen sorption, X-ray diffraction, differential thermal analysis, thermogravimetric analysis, Fourier transform-Infrared spectroscopy, UV-visible spectroscopy, scanning electron microscopy, transmission electron microscopy, and solid state NMR. The solid products had the MCM-41 struc-ture and contained only atomically dispersed vanadium and aluminum consistent with framework vanadium and aluminum. The samples were hydrophobic and contained large amount of surfactant in the as-synthesized samples. The surfactant could be removed upon calcination at 450◦C. N2sorption measurements and TEM demonstrate the
high mesoporosity of [V, Al]-MCM-41. The incorporation of vanadium and aluminum into MCM-41 decreased the surface area to some extent. The morphologies of all the samples were the agglomerate of plates.29Si MAS NMR shows that the pore wall is amorphous.27Al MAS NMR shows that all of aluminum species were tetrahedrally coordinated even after calcination at 550◦C.
Keywords: mesoporous material, MCM-41, characteristics of porous material, metal-containing MCM-41, vanadoaluminosilicate
1. Introduction
Since the discovery of mesoporous molecular sieves [1, 2], many research has been focused on this mate-rial [3–10]. One form of this series, MCM-41, which possessed a uniform arrangement of hexagonal shape mesopores of diameter varying from 15 to 100 ˚A, have received great attention in material science and cata-lysis. MCM-41 is of particular interest because it has two important roles. Its narrow pore size distribution and straight, unconnected channels make it an ideal model adsorbent for fundamental theoretical studies of fluid behavior in confined regions [11–27]. Its large and controllable pore size enables it to host must large molecule than alternative catalytic materials, bringing
∗To whom all correspondence should be addressed.
it into the size range required for hosting biological materials [4].
Isomorphous substitution of silicon with other ele-ments is an excellent strategy in creating active sites and anchoring sites for active molecules in the de-sign of new heterogeneous catalyst. Many metals, e.g., aluminum, titanium, manganese, iron, boron, niobium and vanadium, have been incorporated into the frame-work of MCM-41 [6, 16, 17, 28–37]. Reddy et al. [31] reported the inclusion of vanadium into the siliceous MCM-41 framework. Incorporation of vanadium in the siliceous framework of MCM-41 increased the hexag-onal unit cell size from 3.6 to 3.7 nm and the average pore diameter from 2.52 to 2.58 nm, while preserving the hexagonal structure. Sayari and Moudrakovski [38] synthesized V-ZSM-12, V-HMS, and V-MCM-41 and characterized them by magnetic resonance technique
(EPR and NMR). They showed that in calcined sam-ples, vanadium was coordinated to four oxygen atoms in a tetrahedral configuration and that it could be eas-ily converted from V5+ to V4+ and vice versa. Park
et al. [39] reported the synthesis and characterization of a series of vanado-silicates with Si/V= 10 to 160. The authors concluded that in the as-synthesized ma-terials, vanadium was in octahedral coordination and located mainly at the wall-surfactant interface. After calcination, vanadium became 4-coordinate as a result of water loss.
Most of previous studies only incorporate single element such as Al or V into the MCM-41. In this study, V and Al were simultaneously incorporate into MCM-41. The materials were characterized with X-ray diffraction (XRD), nitrogen sorption measure-ment, thermogravimetric analysis (TGA), differential thermal analysis (DTA), Fourier-transform infrared (FTIR) spectroscopy, UV-visible spectroscopy, scan-ning electroscopy (SEM), transmission electron micro-scopy (TEM), and solid state NMR.
2. Experimental
2.1. Chemicals
The chemicals used in the synthesis were sodium sili-cate (Showa), vanadium(IV) oxidsulfat pentahydrate (VOSO4·5H2O, Merck),
hexadecyltrimethylammo-nium bromide (C16TMABr, TCI Tokyo Kasei), sodium
aluminate (Riedel-deHaen), and H2SO4(Hayashi).
2.2. Synthesis
A series of [V, Al]-MCM-41 samples with various compositions were synthesized. The procedure to pre-pare the sample with Si : Al : V ratios of 100 : 1 : 2 was as following. Solution I was made by adding 5.4673 g C16TMABr in 14 ml distilled water with stirring and
0.0283 g sodium aluminate was then added. 3.3964 g sodium silicate was dissolved in 7.5654 g distilled wa-ter to make solution II. The solution III was prepared by dissolving 0.1517 g VOSO4·5H2O in 15 ml distilled
water. Solutions I and II were mixed with vigorous stirring for 10 min. Solution III was then added with stirring. The pH value was adjusted to 10 with 1.1 M H2SO4. The gel composition of the sample with Si : Al :
V= 100 : 1 : 2 was 1 SiO2: 0.5 C16TMABr: 0.4627
Na2O: 0.02 VO2: 0.005 Al2O3: 2.0314 H2O (mole
ra-tio). The gel was loaded into a Teflon-lined stainless-steel autoclave and stayed at 150◦C for 48 h. The resulting solid products were recovered by centrifu-gation, filtered, washed with deionized water and then dried in air at 100◦C. The dried sample was then cal-cined in air at 450, 550 and 650◦C for 6 h, respec-tively, to obtained thermal products. Samples were des-ignated as AxVy-MCM-z where x and y are the ratios of Al/Si and V/Si, respectively, and z is the calcina-tion temperature. For example, A1V2-MCM-550 rep-resents the MCM-41 sample with Al : V : Si molar ratio of 1 : 2 : 100 and was calcined at 550◦C.
2.3. XRD
XRD patterns were recorded using a Siemens D500 powder diffractometer with Cu-Kα radiation (40 kV, 30 mA), 0.02◦ step size and 1 sec step time from 1◦to 8◦. Fluorophologopite mica (Standard Reference Material 675, National Bureau of Standards) were used as an external standard in order to protect the detec-tor from the high energy of the incident X-ray beam and to resolve a peak at low angles, narrower inci-dent and diffracted beam slits were required in this work.
2.4. N2Sorption
Pore size, pore volume, and surface area of the sample were obtained from the analysis of nitrogen adsorption and desorption isotherms carried out at−196◦C in a volumetric apparatus (Micromeritics Co., ASAP 2000). Sets of nitrogen adsorption-desorption iso-therms were analyzed using a cylindrical mode and the Kelvin equation. Prior to the experiment, sample was dehydrated at 350◦C until the vacuum pressure was below 7 Torr.
2.5. Thermal Analysis (DTA and TGA)
The thermal properties of the samples were examined by thermogravimetric analysis (TGA, Perkin Elmer TGA-7) and differential thermal analysis (DTA, Perkin Elmer DTA-1700), respectively. The samples used for TGA and DTA were the dried products (100◦C, 48 h). For both TGA and DTA experiments, the samples were heated in a flowing oxygen atmosphere at a heating rate of 5◦C/min from 30 to 800◦C.
2.6. Fouries Transform Infrared Spectroscopy (FT-IR)
The samples were mixed and ground with KBr (10 : 90) and pressed them as slices. The samples were then mea-sured with FT-IR spectrometer (Bio-Rad FTS-155). The range of scan was from 400–4000 cm−1.
2.7. Ultraviolet/Visible Absorption Spectroscopy (UV-vis)
The diffuse reflectance UV-vis spectra were measured with a Varian Lary 5E spectrophotometer equipped with a 60 mm Hitachi integrating sphere accessory. Powdered samples were loaded in a quartz cell with Suprasil windows, and spectra were collected in the 200–500 nm wavelength range against a quartz standard.
2.8. Scanning Electron Microscopy (SEM)
The microstructure of the sample was examined using a field emission SEM (Hitachi S-800) operated at 200 kV. Samples were dried at 100◦C and then placed on a stage specially made for SEM. The samples were coated with Au for 4 min. before the experiment.
2.9. Transmission Electron Microscopy (TEM)
The sample powders were dissolved in water and be-came colloid in the water. The powders in the col-loidal solution were deposited on a grid with a holey carbon copper film and rapidly transferred to a JEOL JEM-1200 EX II electron microscope operating at 100 kV. TEM images were recorded at magnification of 100,000× to 400,000×.
2.10. Solid-State NMR
The solid state NMR measurements were performed on a Bruker bsx-3 spectrometer equipped with a magic angle spinning (MAS) unit. The29Si MAS NMR were
recorded at a frequency of 59.6 MHz and a spinning rate of 3 kHz with a pulse length of 1 us, a pulse interval of 8 s, and approximately 8000 scans. The27Al MAS
NMR was recorded at a frequency of 78.21 MHz and a spin rate of 3 kHz with a pulse length of 4 us, a
pulse interval of 1 s, and approximately 10000 scans. 1 M Al(NO3)3 solution was used as a reference.29Si
spectra were acquired at 79.4 MHz with a 90◦ pulse, 600 s recycle delay, and 80 scans. Chemical shifts were given in ppm from external trimethylsilane.
3. Results and Discussion
3.1. Synthesis
A series of [V, Al]-MCM-41 samples with various compositions was synthesized. The addition of vanadyl sulfate aqueous solution directly to the sodium sili-cate mixture resulted in phase separation and formation of free V2O5because vanadyl sulfate was rapidly
hy-drolyzed in a solution of silicate monomer. For better incorporation of vanadium into the silicate framework, the vanadyl sulfate aqueous solution was added to the gel mixture little by little in drops.
It is important that the autoclave should be quenched in ice water after synthesis. If the autoclave was cooled in room temperature, the product was separated into two parts: one was a transparent gel, and the other was hard, white translucent gel with no characteristic XRD peaks. The as-synthesized [V, Al]-MCM-41 showed light green color, and the calcined sample showed white color. After rehydration, they showed light yel-low color.
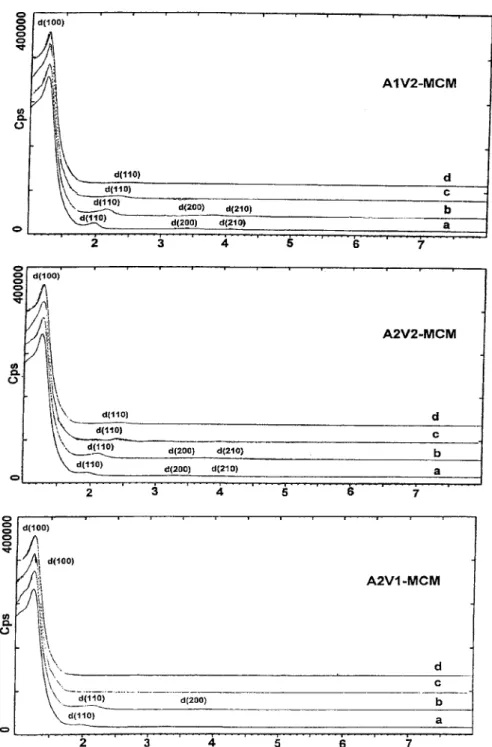
3.2. XRD
The powder X-ray diffraction patterns of the sam-ples (Fig. 1) feature distinct Bragg peaks in the range 2θ = 1–8◦, which can be indexed to different hkl reflec-tions, in good agreement with a patterns from a purely siliceous MCM-41 [2, 32, 40]. Because the atomic ar-rangement in MCM-41 was not crystalline, one should refer to “crystallinity” in the sense of the regular dis-position of the channels, the only element of order in the material. The as-synthesized samples gave a very strong (100) peak and three lower intensity peaks. The intensities of the three peaks d110, d200and d210were
decreased upon calcination. These three peaks finally vanished at 650◦C. The results could be explained by the fact that the hexagonal lattice is contracted upon calcination, as can be expected when organic cations were replaced by protons and adjacent silanol groups condense [24]. Depending on the compositions of [V, Al]-MCM-41, lattice contractions can be as high
Figure 1. XRD spectra: (a) as-synthesized, (b) calcined at 450◦C, (c) calcined at 550◦C, (d) calcined at 650◦C.
as 25%. The percentage of lattice contraction for the sample A1V2-MCM is 11%, calculated from the inten-sity of peak d110, as the sample calcined at 450◦C. It was
11–16% when the sample was calcined at 550◦C, and increased to even greater than 20% when the sample
calcined at 650◦C. The absence of XRD peaks above 10◦2θ indicates that the atomic arrangement within the mesopore walls is disordered.
While the precise structure of the [V, Al]-MCM-41 matrix is unknown, the presence of similar distinct
reflections in the XRD patterns suggested the long-range order in the framework, similar to that in siliceous MCM-41.
3.3. TGA and DTA
All of the samples show similar TGA shapes and have significant weight losses. In addition, A2V2-MCM has a higher weight loss than A1V2-MCM and A2V1-MCM. The weight loss was increased with an increase of vanadium or aluminum content, indicat-ing that vanadium and aluminum subsituted in the sil-icon position were located in the framework of the structure.
Mass spectroscopy reveals that only water is re-moved from the sample below 150◦C. The endothermic peak at 100◦C in DTA spectra, assigned to water des-orption, reconfirms this observation. Very small weight loss below 150◦C was observed, indicating that these samples are hydrophobic.
The weight loss between 150–450◦C is accompanied by exothermic peaks, indicating the combustion and decompositions of organic species (C16TMABr
surfac-tant) in air. The biomodal amine desorption probably results from the association of C16H33(CH3)3N+with
siloxy groups and Bronsted sites, the latter from the aluminum or vanadium [16, 40]. The siloxy groups are stronger bases and should promote Hoffmann elimination at lower temperature. The weight loss between 150–300◦C was attributed to the dissocia-tion of C16H33(CH3)3N+with SiO−[16]. The weight
loss between 300 and 450◦C was assigned to the dis-sociation of C16H33(CH3)3N+ with AlO− or VO−
[40]. Two exothermic peaks appeared in DTA spec-tra reconfirm this conclusion. The major weight loss was from the surfactant. The as-synthesized samples contained about 50 wt% of surfactant, indicating that as-synthesized samples contained large amounts of or-ganic templates because of the presence of mesoporous materials with large void volume.
The weight loss between 450–650◦C is related to water losses via condensation of hydroxyl groups (Si OH, Al OH, and V OH) [3, 16, 40]. The weight loss levels off after 650◦C. These results reveal that most of organic surfactant species can be removed upon decomposition and/or desorption below 450◦C. In addition, the [V, Al]-MCM-41 structure was quite stable because of the straight weight loss line after 650◦C.
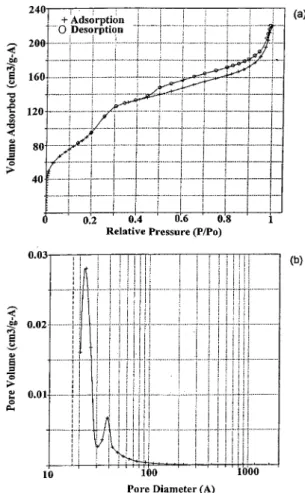
Figure 2. Nitrogen sorption results of A1V2-MCM-550.
3.4. Surface Area and Pore Size Distribution
The most reliable information about the mesoporous structure of solids comes from low-temperature N2
sorption isotherms. The typical result is shown in Fig. 2. The isotherm is of type IV, typical of mesoporous solids. A well-defined step occurs between p/po=
0.2 and 0.3, which is indicative of the filling of the mesopore. The p/pocoordinate of the inflection point
depends on the pore size. The sharpness in this step suggests a uniform size pore system. The shape of the
t-plot (not shown) appears to confirm that
monolayer-multilayer adsorption has occurred on the pore walls before the onset of capillary condensation at p/po=
0.2 [40]. Furthermore, the fact that the initial region can be extrapolated back to the origin confirms the absence of any detectable micropore filling at low
p/po. The large hysteresis loop at p/po> 0.9
Table 1. Pore properties of [V, Al]-MCM-41.
BET surface Pore size
Samples area (m2/g ) (nm ) A1V2-MCM-450 879 3.37 A1V2-MCM-550 452 3.43 A1V2-MCM-650 404 4.53 A2V2-MCM-550 333 3.50 A2V1-MCM-550 302 5.66
pressures. This shows the formation of macropores upon calcination.
The isotherms contain an H3hysteresis loop as
de-fined by IUPAC, associated with solids with slit-shaped pores or plate-like particles. Beck et al. [1] reported that the existence of slit-liked particles was formed. The SEM results in the latter section will show that the pack-age of these plate-liked primary particles causes the ex-istence of slit-liked pores. The capillary condensation inside the pores occurs when two lamellars adsorbed on the parallel walls touch each other, and fills the whole pore. The capillary evaporation happens when the average curve radius equals to dk, where dk= dp− t
in Kelvin equation, P/P0= exp(−2γ VL/RTr), dp is
the diameter of slit-liked pore, t is the thickness of adsorbate.
The BET surface area (Table 1) was calculated with the cross sectional area of a nitrogen molecule taken as 0.162 nm2. Incorporation of aluminum and vanadium caused a decrease in BET surface area, in agreement with those in the literature [16, 41]. The low surface area indicates that the samples are not pure and contain amorphous silica. It should be noted that the samples in this study was synthesized at 150◦C for 48 h. Most of the samples reported in the literature were synthe-sized at 150◦C for 72 h. The pore size distribution is also shown in Fig. 2. Although the desorption branch is often used for the assessment of the distribution of mesopore sizes, a type H3hysteresis loop is unlikely to
yield a reliable estimate of pore size distribution, even for comparison purposes. Accordingly, the adsorption branch was used to calculate the mesopore size distri-bution. The BJH plot for the physisorption of N2 on
the mesoporous materials give a remarkable narrow pore size distribution with a pore size of ca. 3 nm. The sharp pore size distribution, with a ca. 0.5 nm width at half-height, shows that the mesopores are exception-ally uniform. An additional peak is observed around 4 nm. This peak is sharp and can be attributed to the mesopores of a second type.
3.5. FTIR
Infrared spectroscopy had been used extensively for the characterization of transition metal cations-modified zeolites. In the FTIR spectrum of calcined siliceous MCM-41, the asymmetric and symmetric stretching vi-bration bands of framework Si O Si bands, assigned by Sohn et al. [42] for zeolites, appeared at 1123 cm−1 and 814 cm−1. In as-synthesized A1V2-MCM these two bands appeared at somewhere lower wavenumbers, 1098 cm−1and 802 cm−1. After calcination to decom-pose the surfactant, these bands shifted to 1098 cm−1 and 802 cm−1. In addition, the peak at 2780 cm−1was assigned to the presence of surfactant. By the disap-pearing peak at 2780 cm−1, one could conclude that the surfactant was completely decomposed.
The FT-IR spectra of the [V, Al]-MCM-41 with vari-ous compositions upon calcination at 550◦C are shown in Fig. 3. On introduction of V, most of the bands were shifted to lower wavenumbers consistent with their incorporation in lattice positions. Additionally, an absorption band at ca. 960 cm−1assigned to the vi-bration of Si O V linkages was observed. An FTIR band around 960 cm−1was also observed in all samples. Such a band has been assigned to a stretching vibration mode of a [SiO4] unit bonded to a titanium ion (O3Si
O TiO3) in titanosilicate [19, 41] or to a vanadium
Figure 3. FTIR absorption spectra of [V, Al]-MCM-41: (a) siliceous MCM-41, (b) A1V2-MCM, (c) A2V2-MCM, (d) A2V1-MCM.
ion (O3Si O VO3) in vanadosilicate molecular sieves
[24]. This could be related to vanadium incorporation into framework positions. However, the origin and in-terpretation of this band were still in debate [19]. More-over, the relative intensity of this band was almost the same for all samples (Fig. 5). This indicated that, in this case, no reliable information regarding vanadium in-corporation could be drawn from FT-IR data, in agree-ment with that reported in the literature [30].
3.6. UV-vis
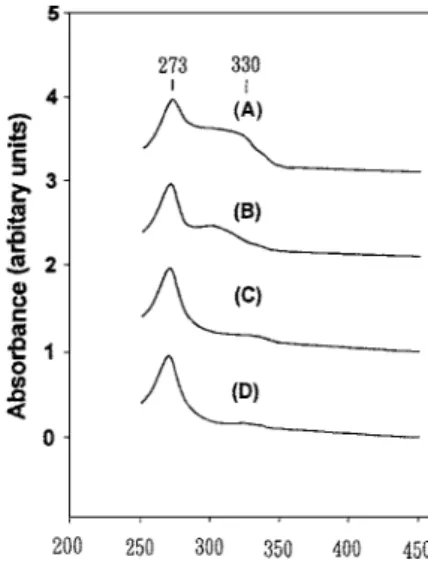
The [V, Al]-MCM-41 samples with various compo-sitions showed strong UV-vis absorption bands with overlapping maxima at 273 nm and 330 nm (Fig. 4). The relation between 273 nm and 330 nm seemed to have a relatively higher intensity for higher vanadium loading. These bands were assigned to the low-energy charge transfer transitions between tetrahedral oxygen ligands and a central V5+ion [24, 28]. Such a tetrahe-dral environment was typical for framework V5+ions in zeolites [28] and was also found for some supported V2O5catalysts [24]. Since the vanadium source added
to the synthesis gel was a V4+salt, the UV-vis results
clearly indicated that most of the V4+ ions were oxi-dized to V5+ions during synthesis.
Upon calcination in air, the [V, Al]-MCM-41 sam-ples changed from light green to white due to oxida-tion of small amount of VO2+to V5+ions. After expo-sure of these calcined samples to hydrated air, the color
Figure 4. Diffuse reflectance UV-vis spectra: (a) A1V2-MCM, (b) A2V2-MCM, (c) A2V1-MCM, (d) siliceous MCM-41.
changed rapidly to bright yellow and then orange. This indicated additional coordination of water molecules to the V5+ions. Based on these assignment, one can conclude that the charge transfer band at ca. 330 nm was attributable to V5+ions with a short V O double
bond and three longer V O bonds [24, 31].
3.7. SEM
The SEM results show that the morphology is plate ag-glomerate. It is relatively large in size, showing stepped and smooth surfaces. There was no significant influence on the morphology of the samples with various compo-sitions. The big plate-agglomerate of the sample, com-paring the spherical shape of siliceous MCM-41, leads to a lower surface area inside the plates. Definitely, the surface area for fine dispersed spherical particles is larger than that for plates in close package. In addition, calcination has negligible influence on the morpho-logy of the samples providing the temperature is less than 650◦C. It should be noted that the morphologies of siliceous MCM-41 [1, 40] and vanadosilicate MCM-41 [16, 24] are spherical shape. The results of this study demonstrate that the morphology of [V, Al]-MCM-41 is plate shape.
3.8. TEM
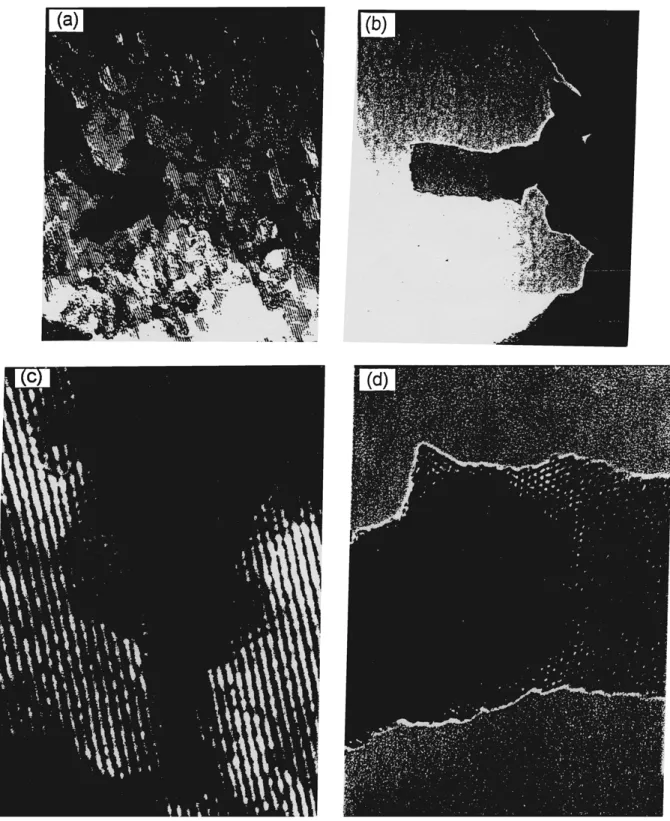
Transmission electron micrographs viewed down the pore axis in Fig. 5 reveal a regular hexagonal array of uniform channels in a hexagonal arrangement. The repeat distance between the channels is about 4 nm, which is in excellent agreement with the position of the first peak in the XRD patterns. From TEM, the size of the pore is about 3 nm, the thickness of the pore wall is about 1 nm, and no order can be observed in the inorganic structure. When view in the direction per-pendicular to their axis in Fig. 5, the pores are seen to be arranged in patches composed of regular rows more than 4 nm long. The morphology of MCM-41 tubules can be rectilinear. The pore size from Fig. 6 is ca. 3.5 nm in diameter. This is entirely consistent with the XRD and N2sorption results. The spacing between
the neighboring rows in Fig. 6 is ca. 3.1 nm, which is related to the ca. 3.5 nm distance between pore centers by the factor of√3/2. Chenite et al. [42] have report that the interline distance of projection of a hexagonal array of tubules is related to the distances between pore centers by the same factor, and confirms that these lines
Figure 5. TEM micrographs of A2V2-MCM viewed down the pore axis at magnification (a) 150000× (b) 100000×. (c) and (d) are magnification to 3 in×5 in images from (a) and (b).
Figure 6. TEM micrographs of A2V2-MCM viewed in the direc-tion perpendicular to the pore axis.
are images of hexagonal tubes and not of the lamellar phase.
Some of the rows conjucated and showed square pore is not real, as shown in Fig. 6. However, we believe that there are virtually regular hexagonal arrays of fine pore arrangement existing in these samples. Besides, other workers found that samples which display only the 100 diffraction peak have very poorly organized pore sys-tem [5]. It is concluded that simultaneous incorporation of V and Al into the framework of MCM-41 affects the long-range order of the mesopores without damaging the essentially mesoporous nature of the materials.
3.9. 29Si MAS NMR
The “Qn notation” is often adopted for the
descrip-tion of building units in silicates. In this notadescrip-tion, Q stands for a silicon atom bonded to four oxygen atoms forming a SiO4 tetrahedron. The superscript n
indicates the connectivity, i.e., the number of other
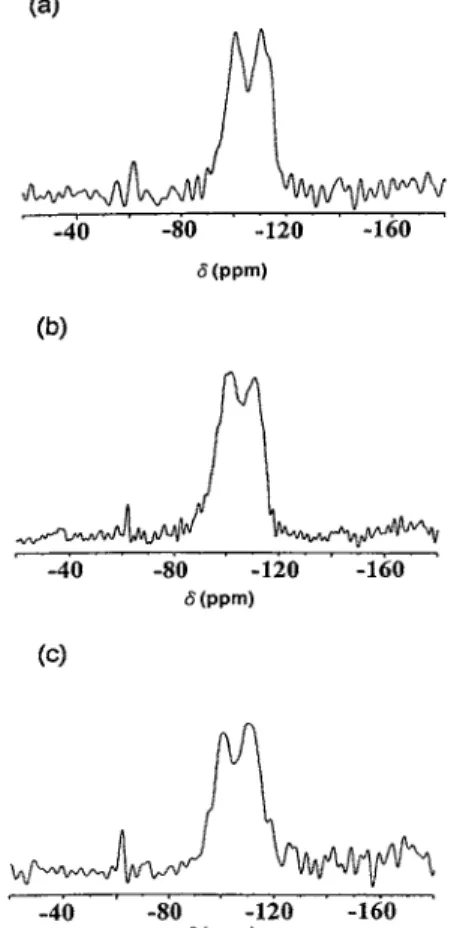
Figure 7. 29Si NMR spectra of the as-synthesized samples:
(a) A1V2-MCM, (b) A2V2-MCM, (c) A2V1-MCM.
Q units attached to the unit in question. The SiO4
tetra-hedron is 4-connected, and the remaining (4− n) units linked it are often hydroxyl groups. Thus, Q4stands for
three-dimensionally cross-linked Si(OSi)4units, Q3for
Si(OSi)3(OH) units, and Q2 for Si(OSi)2(OH)2 units.
Polycondensation in silicates is clearly equivalent to the generation of Q4units from Qnunits with n< 4.
The 29Si MAS NMR spectra of [V, Al]-MCM-41
shown in Figs. 7, 8 consist of three broad overlapping peaks from Q4silicons (ca.−112 ppm), Q3silicons (ca.
−100 ppm), and Q2silicons (ca.−95 ppm). The spectra
closely resemble those of amorphous silica suggesting a broad range of Si O Si (T O T) bond angles in this material. The very broad MAS 29Si-NMR reso-nance indicates a broad range of T O T angles in the pore walls. This is consistent with a framework that lacks precise repeats of Si positions at the second near-est neighbor (T T) length scale. The intense peaks at −110 ppm and the shoulder at −112 ppm indicated
the existence of Si(OSi)4. The peak at −100 ppm
represented the Si(OSi)3OH species. The shoulder at
−95 ppm shows the structural tetrahedral units occu-pied by two silicon atoms and two metal atoms. The two metal atoms might be two Al atoms, two V atoms, or one Al atom and one V atom. In addition, the shoulder at−90 ppm is the tetrahedron units of Si(OSi)2(OH)2.
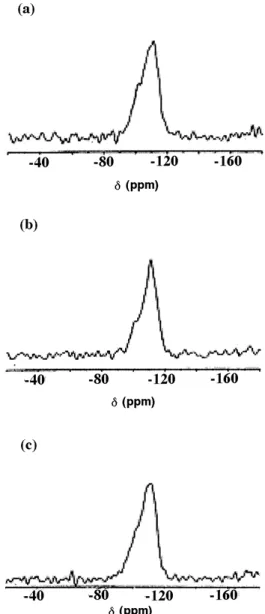
Besides, a shoulder at−107 ppm shown in Fig. 8 for the sample calcined at 550◦C represented the existence of structural unit occupied by three silicon atoms plus one metal atom. The metal could be either Al or V. One can see that the peaks at−90 ppm, −100 ppm and the shoulder at −95 ppm vanished after heating and the peak at−110 ppm became more intense. It is as-cribed to the condensation of the species O Si OH to O Si O Si. There was no difference on the NMR spectra when the contents of vanadium and alu-minum were increased, possibly because the composi-tions of Al and V were low in this study. The peak at −60 ppm is just the side band of the spectra.
Quantitative analysis was not possible since the peaks were broad and overlapping and could not be re-solved using nonquantitative CP technique. However, deconvolution of the spectra of as-synthesized and cal-cined [V, Al]-MCM-41 suggests about 20% and 40% of the silicon atoms, respectively, are silanols (Q3)
sim-ilar to the results for amorphous silica before and after heating at 550◦C.
3.10. 27Al MAS NMR
The as-synthesized sample exhibits only one resonance at 54 ppm, assigned to tetrahedral aluminum species incorporated into the framework of MCM-41. The re-sults indicate that the aluminum species have been fully incorporated into the framework of the structure. The position of27Al peaks shifts from 54 to 53 ppm upon
calcination. The broad peak centered at 0 ppm is due to the background aluminum in the MAS probe itself and the peak around 129 ppm represents a spinning sideband. Subtraction of the background shows the ab-sence of octahedrally coordinated aluminum, normally represented by a sharp peak with a chemical shift at ca. 0 ppm. At the same time, there was no evidence of the appearance of a peak due to octahedrally coor-dinated aluminum. The background subtracted 27
Al-MAS NMR spectra of the calcined sample suggests that the aluminum present in the calcined sample can no longer be observed by27Al MAS NMR under the
conditions of the experiment. This indicates the
trans-Figure 8. 29Si NMR spectra of the samples calcined at 550◦C: (a) A1V2-MCM, (b) A2V2-MCM, (c) A2V1-MCM.
formation of the tetrahedrally coordinated aluminum into aluminum in a lower symmetry environment. The presence of vanadium did not influence the27Al MAS NMR spectra, possibly due to the low concentration of vanadium in this study.
4. Conclusions
A series of [V, Al]-MCM-41 materials prepared from gels with various compositions have been synthesized. The products were characterized by XRD, TGA, DTA,
N2sorption, FTIR, UV-vis, SEM, TEM,29Si and27Al
MAS NMR. The MCM-41 structure of the sample was confirmed by XRD. Both of aluminum and vanadium were incorporated into the framework structure. The as-synthesized samples were hydrophobic and contained large amount of surfactants. The surfactants could be removed upon calcination at 450◦C. The pore sizes of each samples were distributed very narrow. The pres-ence of vanadium and aluminum decreased the sur-face area to some extent. The morphology of [V, Al]-MCM-41 is plate. TEM reveals a regular hexagonal array of uniform channels with curved and rectilinear morphologies. The hexagonal array structure of uni-form pore size was observed by TEM. It is proved that the pores were highly aligned.
References
1. J.S. Beck, J.C. Vartuli, W.J. Roth, M.E. Leonowicz, C.T. Kresge, K.D. Schmitt, C.T.W. Chu, D.H. Olson, E.W. Sheppard, S.B. McCullen, J.B. Higgins, and J.B. Schlenker, J. Am. Chem. Soc. 114, 10834 (1992).
2. C.T. Kresge, M.E. Leonowicz, W.J. Roth, J.C. Vartuli, and J.S. Beck, Nature 359, 710 (1992).
3. C.Y. Chen, H.X. Li, and M.E. Davis, Micro. Mater. 2, 27 (1993).
4. D.M. Antonelli and J.Y. Ying, Curr. Op. Coll. Interf. Sci. 1, 523 (1996).
5. M.E. Davis, Nature 364, 391 (1993).
6. P.T. Tanev, M. Chibwe, and T.J. Pinnavaia, Nature 368, 321 (1994).
7. C.J. Brink, Curr. Op. Solid State Mater. Sci. 1, 798 (1996). 8. Q. Huo, D.I. Margolese, and G.D. Stucky, Chem. Mater. 8, 1147
(1996).
9. Q. Huo, D.I. Margolese, U. Ciesla, D.G. Demuth, P. Feng, T.E. Gier, P. Sieger, A. Firouzi, B.F. Chmelka, F. Schuth, and G.D. Stucky, Chem. Mater. 6, 1176 (1994).
10. A. Sayari, Chem. Mater. 8, 1840 (1996).
11. M.A. Camblor, A. Corma, and A. Martinez, J. Chem. Soc. Chem. Comm., p. 589 (1992).
12. W.A. Carcalho, P.B. Varaldo, M. Wallu, and U. Schuchardt, Zeolites 18, 408 (1997).
13. C.F. Cheng and J. Klinowski, J. Chem. Soc., Faraday Trans. 92, 289 (1996).
14. C.F. Cheng, H. He, W. Zhou, J. Klinowski, J.A.S. Goncalves, and L.F. Gladden, J. Phys. Chem. 100, 283 (1996).
15. C.F. Cheng, Z.H. Luan, and J. Klinowski, Langmuir 11, 2815 (1995).
16. Y.W. Chen and Y.H. Lu, Ind. Eng. Chem. Res. 28, 1893 (1999).
17. Y.W. Chen, K.K. Koh, and Y.M. Wang, J. Chin, Inst. Chem. Engrs. 31, 123 (2000).
18. M.J. Climent, A. Corma, R. Guil-Lopez, S. Iborra, and J. Primo, J. Catal. 175, 70 (1998).
19. A. Corma, T. Navarro, and J.P. Pariente, J. Chem. Soc., Chem. Commun., p. 147 (1994).
20. A. Corma, M.A. Camblor, P. Esteve, A. Martinez, and J. Perez-Pariente, J. Catal. 151, 213 (1994).
21. A. Corma, V. Fornes, M.T. Navarro, and J. Perez-Pariente, J. Catal. 148, 569 (1994).
22. H.P. Lin and C.Y. Mou, Science 273, 765 (1996). 23. C.C. Liu, X.K. He, and Y. Wu, Catal. Lett. 36, 263 (1996). 24. Z.H. Luan, J. Xu, H. He, J. Klinowski, and L. Kevan, J. Phys.
Chem. 100, 19595 (1996).
25. M.W. Maddox, J.P. Olivier, and K.E. Gubbins, Langmuir 13, 1737 (1997).
26. A. Chenite, L.Y. Page and A. Sayari, Chem. Mater. 7, 1015 (1995).
27. J.Y. Ying, C.P. Liu, C.P. Mehnert, and M.S. Wong, Angew. Chem. Int. Ed. 38, 56 (1999).
28. M. Morey, A. Davidson, H. Eckert, and G.D. Stucky, Chem. Mater. 8, 486 (1996).
29. K.M. Reddy and C. Song, Catal. Lett. 36, 103 (1996). 30. J.S. Reddy, P. Liu, and A. Sayari, Appl. Catal. A: General 148,
7 (1996).
31. K.M. Reddy, I. Moudrakovski, and A. Sayari, J. Chem. Soc., Chem. Commun., p. 1059 (1994).
32. Z.H. Luan, C.F. Cheng, W. Zhou, and J. Klinowski, J. Phys. Chem. 99, 1018 (1995).
33. Z.Y. Yuan, S.Q. Liu, T.H. Chen, J.Z. Wang, and H.X. Li, J. Chem. Soc. Chem. Commun., p. 973 (1995).
34. A. Sayari, C. Danumah, I.L. Moudrakouski, K.I. Ratcliffe, J.A. Ripmeester, and K.F. Preston, J. Phys. Chem. 99, 373 (1995). 35. A. Sayari, C. Danumah, and I.L. Moudrakovcki, Mater. Res.
Soc. Symp. Proc. 371, 81 (1995).
36. W. Zhang, J. Wang, P.T. Tanev, and T.J. Pinnavaia, J. Chem. Soc., Chem. Commun., p. 979 (1996).
37. L. Zhang and J.Y. Ying, Ceramics Processing 43, 11 (1997). 38. A. Sayari and I.L. Moudrakovski, in Synthesis of Porous
Mate-rials: Zeolites, Clays and Nanostructures, edited by M. Ocelli
and H. Kessler (Marcel Dekker, New York, 1997), p. 417. 39. D. H. Park, C.F. Cheng, H. He, and J. Klinowski, J. Mater. Chem.
7, 159 (1997).
40. J.C. Vartuli, K.D. Schmitt, C.T. Kresge, W.T. Roth, M.E. Leonowicz, S.B. McCullen, S.D. Hellring, J.S. Beck, J. L. Schlenker, D.H. Olson, and E.W. Sheppard, Chem. Mater. 6, 2317 (1994).
41. Z.H. Luan, P.A. Meloni, R.S. Czernuszewicz, and L. Kevan, J. Phys. Chem. 101, 9046 (1997).
42. J.R. Sohn, S.J. Decanio, J.H. Lunsford, and D.J. Odonnell, Zeolites 3, 225 (1986).
![Figure 3. FTIR absorption spectra of [V, Al]-MCM-41: (a) siliceous MCM-41, (b) A1V2-MCM, (c) A2V2-MCM, (d) A2V1-MCM.](https://thumb-ap.123doks.com/thumbv2/9libinfo/8843131.239584/6.892.478.768.704.1041/figure-ftir-absorption-spectra-mcm-siliceous-mcm-mcm.webp)