Effect of Silver on the
Sintering and Grain-Growth Behavior of Barium Titanate
Chin-Yi Chen and Wei-Hsing Tuan*
Institute of Materials Science and Engineering, National Taiwan University, Taipei, Taiwan 106, Republic of China Silver and its alloys frequently are used as electrode materialfor BaTiO3-based dielectrics. In the present study, a small amount of fine silver particles have been intimately mixed with BaTiO3powder. The sintering and grain-growth behavior of the silver-doped BaTiO3in air are investigated. The solubility of silver in BaTiO3, as revealed by lattice-parameter measure-ment, electrical measuremeasure-ment, and electron probe microanal-ysis, is <300 ppm. The densification of BaTiO3 is slowed slightly by the addition of silver inclusions. However, the presence of a small amount (<0.3 wt%) of silver increases the
amount and size of abnormal grains. When the silver content is>0.3 wt%, the grain growth of BaTiO3then is prohibited by the silver inclusions.
I. Introduction
C
OMPOUNDSbased on barium titanate (BaTiO3) frequently are used as capacitor materials, because of their excellent dielec-tric properties. To increase the volume efficiency, the dielecdielec-tric layers and inner electrodes are stacked layer by layer to form a multilayered structure. The capacitance is inversely proportional to the thickness of the dielectric layer; therefore, the thickness of the dielectric layer is progressively reduced. Currently, the thickness of the dielectric layer in a commercial multilayer capacitor (MLC) varies over a range of 10 –20m. However, the thickness of the dielectric layer may be reduced down to 5m over the next 10–20 years.1Silver and its alloys, such as silver–palladium (Ag-Pd) alloys, frequently are used as the inner electrode material for MLCs.2
The thickness of the inner electrode is⬃1–3 m. The influence of silver on BaTiO3-related dielectrics increases as the thickness of the dielectric decreases. The effect of silver on the dielectric properties of BaTiO3 has been determined by Ikushima and Hayakawa.3
Their results suggest that a small amount (⬃0.1 wt%) of silver can dissolve into BaTiO3as the silver-doped BaTiO3is sintered in an atmosphere with a low partial pressure of oxygen. However, to the surprise of the present authors, the effect of silver on the sintering behavior and microstructure of BaTiO3previously has not been determined. In the present study, a small amount of silver particles has been intimately mixed with a BaTiO3powder, and the effect of silver addition on the sintering and grain-growth behavior of BaTiO3has been investigated.
II. Experimental Procedures
BaTiO3powder (Product No. 216-9, Ferro Co., New York) and various amounts of silver nitrate (AgNO3) (Johnson Matthey
Chemical Co., Ward Hill, MA) were ball-milled together in deionized water for 4 h. The Ba/Ti ratio of the BaTiO3powder was 0.995, as reported by the manufacturer. Zirconia (ZrO2) balls were used as the grinding media. The amount of ZrO2that was picked up from the grinding media was determined using inductively coupled plasma (ICP) atomic emission spectroscopy. The slurry was stirred and dried slowly to remove the water. Then, the powder mixtures were calcined at 300°C for 3 h in air to decompose the AgNO3to metallic silver. The amount of silver in the sintered specimens was determined by measuring the area fraction from the micrographs. The amount of resultant silver varied over a range of 0 –1 wt%. Then, the dried lumps were crushed and passed through a plastic sieve with an aperture size of 100m. The morphology of the silver-coated BaTiO3powder was observed using transmission electron microscopy (TEM) (Model H-7100, Hitachi Co., Tokyo, Japan). The powder was formed into disks by uniaxially pressing at 25 MPa; no binder was used in the present study. The disks had a green density of⬃54% and were 10 mm in diameter and ⬃2.5 mm thick. Then, the compacts were buried in a pure ZrO2powder and sintered in a covered alumina (Al2O3) crucible at a temperature of 1290°C for 2 h in air. There was no contamination from Al2O3, because there was no contact between the specimens and the Al2O3. The heating and cooling rates each were 3°C/min. A separate sintering study was conducted using a differential dilatometer (Theta Industries, Port Washing-ton, NY). A minimum of two runs for each composition was performed, to check the reproducibility of the sintering-kinetics data.
A lighter-colored surface layer was observed on the silver-containing specimens. The vapor pressure of silver is high at temperatures above its melting point,4
which resulted in a thin, silver-depletion surface layer after sintering. Both surface layers of the sintered disks were removed, first by grinding with SiC sandpaper, before any measurement. The specimens were buried in a pure ZrO2powder bed during sintering; therefore, this procedure also can remove the ZrO2diffusion layer. The final density was determined using the Archimedes method. The solubility of silver in BaTiO3 is negligible (this observation will be demonstrated later); therefore, the theoretical density of the silver-doped BaTiO3 is estimated using values of 6.02 g/cm3
for BaTiO3and 10.5 g/cm 3
for silver. The polished surface was prepared by grinding with SiC particles and polishing with Al2O3particles. The grain boundaries and domain structure were revealed by etching with a solution of hydrochloric acid (HCl) and hydrofluoric acid (HF).5
The solution was sufficiently dilute to leave the silver inclusions intact. The microstructure was observed via optical microscopy (OM) and scanning electron microscopy (SEM). The amount of silver within the BaTiO3grains was determined using electron probe microanal-ysis (EPMA) (Model JXA-8600SX, JEOL Co., Tokyo, Japan). An undoped BaTiO3 specimen that was prepared using the same procedures was used as the reference specimen. Then, the center of the BaTiO3grains in the BaTiO3specimens that were doped with 0.3% silver was analyzed. More than ten measurements were conducted.
Abnormal grains could be observed on the polished surface after sintering. The volume fraction of abnormal grains was determined by measuring the area fraction from the micrographs.
P. P. Phule—contributing editor
Manuscript No. 190009. Received July 22, 1998; approved June 13, 2000. Supported by the National Science Council, Republic of China, through Contract No. NSC85-2216-E002-024.
*Member, American Ceramic Society.
2988
journal
The size of the BaTiO3 grains was determined using the line-intercept technique. The size of the silver inclusions was deter-mined by measuring the size of the inclusions directly from the micrographs. Phase identification was performed using X-ray diffractometry (XRD). A very slow scanning rate (0.004°2/s) also was used to determine the lattice constants of the BaTiO3. A thin layer of silicon slurry was coated on the surface of the XRD specimens. The silicon layer was used as an internal standard, for accurate determination of the diffraction angles. A silver content of 1 wt% was too low to be detected via XRD; therefore, a doped powder mixture that contained 5 wt% of silver also was prepared, for the purpose of phase analysis. The dielectric properties were measured with a LCZ meter (Model HP 4272A, Hewlett–Packard Co., Palo Alto, CA) with a signal of 1 V at a frequency of 1 kHz. Silver paste was applied as an electrode. The permittivity– temperature curves were determined by first increasing the tem-perature to 150°C, then maintaining the specimens at the measured temperature during the cooling stage for 9 min and determining the capacitance.
III. Results
XRD patterns of the calcined powder and sintered specimen that contained 5 wt% of silver are shown in Fig. 1. Silver was observed in the AgNO3-doped BaTiO3powder after calcination at 300°C in air; no silver(I) oxide (Ag2O) was detected. The amount of ZrO2 in the starting BaTiO3powder, as revealed by ICP–AES analysis, was 160 ppm. The amount of ZrO2increased to 350 ppm after the material was milled with ZrO2grinding media for 4 h. The amount of ZrO2 was too small to be detected via XRD analysis. The morphology of the undoped and silver-doped powders can be observed via TEM (see Fig. 2). Typical microstructures of the sintered specimens that contain various amounts of silver are shown in Fig. 3. The bright particles in the silver-doped BaTiO3 specimens, as revealed by EPMA, are silver inclusions. The relative density of the silver-doped BaTiO3, as a function of the silver content, is shown in Fig. 4; the data points indicate the average values, and the error bars represent one standard deviation. The density varies within a rather narrow range (97.0%–98.2%). A constant heating rate was used during the sintering in the dilatom-eter; therefore, the densification rate can be estimated by differ-entiating the density relative to temperature. A comparison of the densification rate between the BaTiO3and the silver-doped Ba-TiO3, in regard to the relative density, is shown in Fig. 5. Each line on the figure shows the average of two measurements. The difference between the two doped specimens is relatively smaller than that between the undoped and silver-doped BaTiO3powder compacts. Figure 5 shows that the densification of BaTiO3 is
slowed slightly in the beginning of the sintering, because of the presence of silver.
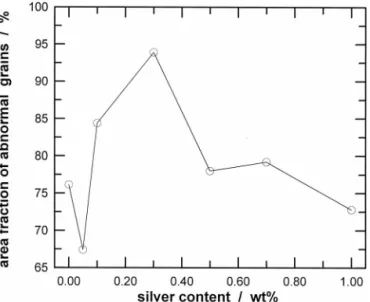
The size of BaTiO3 grains— especially that of the abnormal grains—is strongly dependent on the silver content (see Fig. 6). Furthermore, the amount of abnormal grains also shows a strong dependence on the silver content (see Fig. 7). Both the size and amount of abnormal grains attain their highest values when the silver content is 0.3 wt%, which indicates that the presence of a small amount of silver enhances the grain growth of BaTiO3. However, growth of the BaTiO3grains is prohibited by the silver inclusions when the silver content is⬎0.3 wt%. The size of the silver inclusions is shown in Fig. 8, as a function of the silver content.
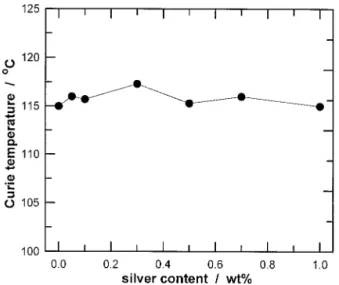
The lattice parameters (a and c) of BaTiO3are shown in Fig. 9, as a function of the silver content. The index of tetragonality (c/a) also is shown in the figure. The values of a, c, and the c/a ratio exhibit little dependence on the silver content. Figure 10 shows the relative permittivity at room temperature (Kr) and at the Curie temperature (Kmax), as a function of the silver content. The variation of Curie temperature (Tc) is shown in Fig. 11, as a function of the silver content. Tcalso shows little dependence on the silver content.
IV. Discussion
In the present study, AgNO3is used as the starting material for fine silver particles. The number of contacts between the silver and the BaTiO3particles is much greater than that in a multilayered
Fig. 1. XRD patterns of BaTiO3doped with 5 wt% of silver.
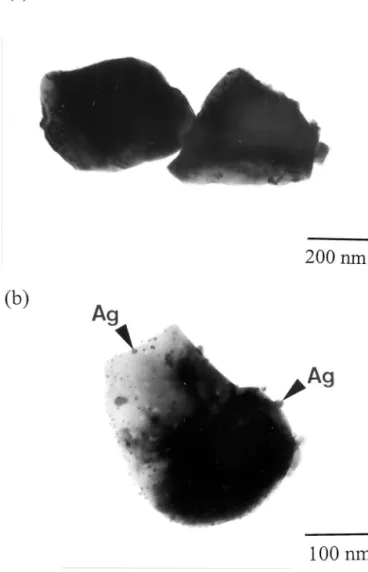
Fig. 2. TEM micrographs of (a) undoped BaTiO3and (b) silver-doped
structure in which the inner electrode and the dielectrics are stacked layer by layer. Therefore, the interactions (if any) between the silver and BaTiO3are enhanced by the methodology that has been used in this study. Despite the fact that the calcination and sintering operations are conducted in air, no Ag2O is detected in the silver-doped BaTiO3(see Fig. 1). Thermodynamic studies have suggested that silver is more stable than Ag2O at temperatures of ⬎189.8°C in air.2,6
Therefore, any Ag2O that is present decom-poses to metallic silver during the heat-up stage. Figure 1 shows that fine silver inclusions remain in their metallic state after the calcination at 300°C. The formation of Ag2O is a very slow process at low temperature;7
thus, the amount of Ag2O that is formed during the cooling stage from the calcination temperature may be too low to be detected via the XRD technique. The silver
inclusions are isolated from the external atmosphere after sinter-ing. Ag2O cannot form during the cooling stage from the sintering temperature anymore. Therefore, no Ag2O is observed in the sintered specimens. Fine spherical particles (⬍10 nm in diameter) are observed on the surface of the silver-doped BaTiO3particles (see Fig. 2(b)); however, such fine spheres are not observed on the surface of undoped BaTiO3powder particles (see Fig. 2(a)). The AgNO3melts first as the temperature increases.
8
The morphology of the AgNO3 liquid becomes spherical before it decomposes. XRD analysis and TEM observation suggests that the small spherical particles on the silver-doped BaTiO3particles are silver inclusions.
The solubility of silver in BaTiO3has been determined in the present study using three techniques, namely the lattice parameter, the Curie temperature (Tc), and EPMA analysis. The lattice parameters of BaTiO3are not affected by the addition of silver. The Curie temperature of BaTiO3, which is very sensitive to the presence of solute,1,9
also is independent of the silver content. Furthermore, the differences of the lattice parameters and Tc between undoped and BaTiO3that has been doped with 500 ppm of silver are negligible (see Figs. 9 and 11). Therefore, these two techniques suggest that the solubility of silver in BaTiO3 is negligible. However, EPMA analysis suggests a silver solubility of 300 ⫾ 45 ppm in BaTiO3. EPMA analysis can easily detect information under the surface. Although care was taken to avoid the silver particles and the grain boundaries, the EPMA analysis
Fig. 3. Typical microstructures of silver-doped BaTiO3((a) 0, (b) 0.3,
and (c) 1 wt% of silver). Some silver inclusions in Figs. 3(b) and (c) are indicated by arrows.
Fig. 4. Relative density of silver-doped BaTiO3, as a function of the
silver content.
Fig. 5. Densification rate of silver-doped BaTiO3, as a function of the
still may overestimate the amount of silver in the BaTiO3grains. Therefore, we can conclude that the solubility of silver in BaTiO3 is⬍300 ppm.
The radius of the Ag⫹ion (0.149 nm)10
is slightly larger than that of the Ba2⫹
ion (0.135 nm) and is much larger than that of the Ti4⫹
ion (0.061 nm). One might expect that the Ag⫹ion would occupy the Ba2⫹
site; however, such replacement may be difficult, because the radius of the Ag⫹ion is larger than that of the Ba2⫹ ion. Furthermore, other defects (such as oxygen vacancies) would be needed to fulfill the requirement of electrical neutrality. In comparison with the study of Ikushima and Hayakawa,3
the silver-doped BaTiO3in the present study has been sintered in air instead of nitrogen; thus, the concentration of oxygen vacancies is expected to be less in the specimens that have been prepared in the present study. The low concentration of oxygen vacancies in-creases the difficulty of dissolving metallic silver into BaTiO3.
A small amount of ZrO2(⬃200 ppm) from the grinding media is picked up during processing. The presence of the ZrO2solute can reduce the value of Tc.
11
The amounts of ZrO2in the undoped and doped BaTiO3powders are approximately the same, because the milling conditions are the same. The difference in Tcbetween the undoped and doped BaTiO3specimens can contribute to the effect of silver.
The relative permittivity at room temperature (Kr) and at the Curie temperature (Kmax) are strongly dependent on the size of the BaTiO3 grains. Previous studies have clearly indicated that the
value of Krdecreases as the grain size increases. 12
In contrast, the value of Kmax increases as the grain size increases.
13
Thus, the variation of the relative permittivity, relative to the silver content (Fig. 10), can be related to the grain-size effect.
The sintering-kinetics data (Fig. 5) suggest that the densification of BaTiO3 is slightly slowed by the addition of silver. The presence of second-phase inclusions increases the interdiffusion
Fig. 6. Size of the BaTiO3 grains in the silver-doped BaTiO3, as a
function of the silver content.
Fig. 7. Area fraction of abnormal grains in the silver-doped BaTiO3, as a
function of the silver content.
Fig. 8. Size of silver inclusions in the silver-doped BaTiO3, as a function
of the silver content.
Fig. 9. Lattice parameters (c and a) and index of tetragonality (c/a), as a function of the silver content.
Fig. 10. Relative permittivity at room temperature (Kr) and at the Curie
distance between BaTiO3 grains, thus slowing the densification. The amount of silver is small; thus, the influence of silver inclusions on the densification is limited.
Abnormal grain growth in TiO2-excess BaTiO3is a frequently observed phenomenon. Abnormal grains are observed in the undoped specimens. The addition of silver primarily affects the amount and size of abnormal grains. For example, 76 vol% of the undoped BaTiO3specimen consists of abnormal grains that are 25 m in size; the amount and size of the abnormal grains increase to 93 vol% and 40m, respectively, when 0.3 wt% of silver is added to the BaTiO3. However, the addition of silver has little influence on the size and amount of abnormal grains when the silver content is⬎0.5 wt%. The abnormal grains originate from heterogeneities in the chemical composition, particle size, and packing density.14 The nuclei of abnormal grains may be formed during different stages, such as powder processing or sintering.
The AgNO3becomes a liquid phase before it decomposes. 8
The liquid phase exists preferentially in small pores and particle contacts. The capillary force that is generated by the liquid phase can drag the nearby particles close together. The distribution of the liquid may not be uniform, because the amount of liquid is small.15 Agglomerates subsequently are formed, and such agglomerates may survive after the sieving and forming stages and act as the nuclei of abnormal grains. The amount of AgNO3 is high; therefore, obtaining a uniform distribution of liquid phase is much easier. Thus, the influence of AgNO3on the size and amount of abnormal grains is reduced. Furthermore, silver is in its molten state during sintering at 1290°C. The distribution of melted silver during sintering may not be uniform, because the silver content is small. Such chemical heterogeneity may trigger the formation of nuclei of abnormal grains. Because the number of nuclei is small, the nuclei have a greater chance to grow at their own pace until they encounter other abnormal grains. Thus, the size and amount of abnormal grains each is as high as the silver content is low.
The silver inclusions are located either at the grain boundaries of BaTiO3grains or within the BaTiO3grains. The coarsening of the silver inclusions is accompanied by the growth of BaTiO3 grains. Thus, the size of the silver inclusions in the sintered specimens is much larger than that of the original silver particles (see Figs. 8 and 2(b)).
V. Conclusions
X-ray diffractometry, dielectric measurement, and electron probe microanalysis indicate that the solubility of silver in BaTiO3 is⬍300 ppm when silver-doped BaTiO3is sintered in air. Changes in the relative permittivity that are due to the addition of silver primarily are a result of the microstructure differences. A small amount of additive can induce the formation of agglomerates or density heterogeneities during processing; these heterogeneities form the nuclei of abnormal grains. Thus, the size and amount of abnormal grains are great in a system that contains a small amount of silver. When the content of added silver is high, the presence of silver inclusions can inhibit the coarsening of BaTiO3.
References
1Y. Sato, H. Kanai, and Y. Yamashita, “Effects of Silver and Palladium Doping on
the Dielectric Properties of 0.9Pb(Mg1/3Nb2/3)O3–0.1PbTiO3 Ceramic,” J. Am.
Ceram. Soc., 79 [1] 261–65 (1996).
2S. F. Wang, J. P. Dougherty, W. Huebner, and J. G. Pepin, “Silver–Palladium
Thick-Film Conductors,” J. Am. Ceram. Soc., 77 [12] 3051–72 (1994).
3H. Ikushima and S. Hayakawa, “Electrical Properties of Ag-Doped Barium
Titanate Ceramics,” Jpn. J. Appl. Phys., 4 [5] 328 –36 (1965).
4D. R. Gaskell, Introduction of Metallurgical Thermodynamics, 2nd Ed.; p. 589.
Hemisphere Publishing Co., Bristol, PA, 1981.
5F. Kulcsar, “A Microstructure Study of Barium Titanate Ceramics,” J. Am. Ceram.
Soc., 39 [1] 13–17 (1956).
6J. Assal, B. Hallstedt, and L. J. Gauckler, “Thermodynamic Assessment of the
Silver–Oxygen System,” J. Am. Ceram. Soc., 80 [12] 3054 – 60 (1997).
7R. O. Suzuki, T. Ogawa, and K. Ono, “Use of Ozone to Prepare Silver Oxides,”
J. Am. Ceram. Soc., 82 [8] 2033–38 (1999).
8R. C. Weast (ed.), CRC Handbook of Chemistry and Physics. CRC Press, Boca
Raton, FL, 1978.
9H. J. Hwang, T. Nagai, T. Ohji, M. Sando, M. Toriyama, and K. Niihara, “Curie
Temperature Anomaly in Lead Zirconate Titanate/Silver Composites,” J. Am. Ceram.
Soc., 81 [3] 709 –12 (1998).
10R. D. Shannon, “Revised Effective Ionic Radii and Systematic Studies of
Interatomic Distances in Halids and Chalcogenides,” Acta Crystallogr., Sect. A:
Found. Crystallogr., 32, 751– 67 (1976).
11T. R. Armstrong, L. E. Morgens, A. K. Maurice, and R. C. Buchanan, “Effects
of Zirconia on Microstructure and Dielectric Properties of Barium Titanate Ceram-ics,” J. Am. Ceram. Soc., 72 [4] 605–11 (1989).
12G. Arlt, D. Hennings, and G. de With, “Dielectric Properties of Fine-Grained
Barium Titanate Ceramics,” J. Appl. Phys., 58 [4] 1619 –25 (1985).
13H. C. Graham, N. M. Tallan, and K. S. Mazdiyasni, “Electrical Properties of
High-Purity Polycrystalline Barium Titanate,” J. Am. Ceram. Soc., 54 [11] 548 –53 (1971).
14D. Kolar, “Discontinuous Grain Growth in Multiphase Ceramics”; pp. 529 – 45 in
Ceramic Transactions, Vol. 7, Sintering of Advanced Ceramics. Edited by C. A. Handwerker, J. E. Blendell, and W. A. Kaysser. American Ceramic Society, Westerville, OH, 1988.
15J.-M. Heintz, M. Sanz, E. Marquestaut, J. Etourneau, and J.-P. Bonnet, “Influence
of BaCuO2on the Sintering and the Properties of YBa2Cu3O7⫺␦-Based Ceramics,”
J. Am. Ceram. Soc., 74 [5] 998 –1002 (1991). 䡺