骨與植體接觸百分比對人工牙根植體最大鎖入扭力之影響
The Effect of Bone-Implant Contact Percentage on the Insertion
Torque of the Dental Implant
許瑞廷
Jui-Ting Hsu
1, 黃恆立Heng-Li Huang
1, 蘇國誌Kuo-Chih Su
2,張志涵
Chih-Han Chang
2, 蔡明慈Ming-Tzu Tsai
3*1 中國醫藥大學牙醫學系School of Dentistry, China Medical University and Hospital
2國力成功大學醫學工程研究所Institute of Biomedical Engineering, National Cheng Kung University 3弘光科技大學生物醫學工程學系Department of Biomedical Engineering, HungKuang University
* Corresponding Email:
Ming-Tzu Tsai, [email protected]
1. 中文摘要 本研究目標為探討將人工牙根植體鎖入的 最大扭力和骨與植體介面狀態之相關性。本研究 將 人 工 牙 根 植 體 植 入 四 種 不 同 強 度 的 人 造 假 骨,並取得其利用高解析度電腦斷層掃瞄影像。 利用醫學影像軟體計算三維的骨與植體接觸百 分比。實驗結果顯示,增加人造假骨的彈性係數 可以增加人工牙根植體的初期穩定度。人工牙根 的最大鎖入扭力與三維骨與植體接觸百分比的 相關性為0.797。 關鍵詞:人工牙根、最大鎖入扭力、骨與植體接 觸、高解析度電腦斷層掃瞄 AbstractThe purpose of this study was to determine the correlation between the peak insertion torque value (ITV) of a dental implant and the bone–implant contact percentage (BIC%). Dental implants were inserted into specimens comprising a 2-mm-thick artificial cortical shell and artificial foam bone representing cancellous bone with four densities. Each specimen with an inserted implant was subjected to micro-computed tomography (micro-CT) scanning, from which the three-dimensional (3D) BIC% values were calculated. Pearson’s correlation coefficients (r) between the ITV and BIC% were calculated. Pearson’s correlation coefficient between ITV and BIC% was r=0.797).
Keywords: Dental implant, insertion torque, bone–implant contact; micro-computed tomography
2. Introduction
Implant stability is a critical factor for the survival rate of the dental implant [1-2]. Implant stability can be divided into two stages: initial (or
primary) stability and secondary stability. The initial stability is a function of the mechanical stability immediately after inserting the implant into the bone, while the secondary stability is formed by osseointegration, which is the bone ingrowth into the implant surface. Despite the importance of the initial stability of a dental implant to osseointegration, there is still no method for directly measuring relative movement at the interface between the bone and implant. The peak insertion torque value (ITV) has also often been used to quantify the initial stability [3-4]. Basically, a high ITV may indicate a mechanically stable implant . The implant stability is theoretically affected by the bone–implant contact (BIC) area, with a larger amount of bone in contact with the implant producing a higher structural stiffness, resulting in higher interfacial strength [3]. Previous studies [3-4] that found no correlation between the ITV and BIC quantified BIC based on two-dimensional (2D) histomorphometric evaluations. The use of one or only a few histological sections can not represent the entire three-dimensional (3D) BIC between the implant and bone [5]. Therefore, the present study aimed to determine the relation between the 3D BIC percentage (BIC%), measured using high-resolution micro-computed tomography (micro-CT) images, and the initial stability, as quantified by ITV.
3. Materials and Methods
(1) Specimen Preparation
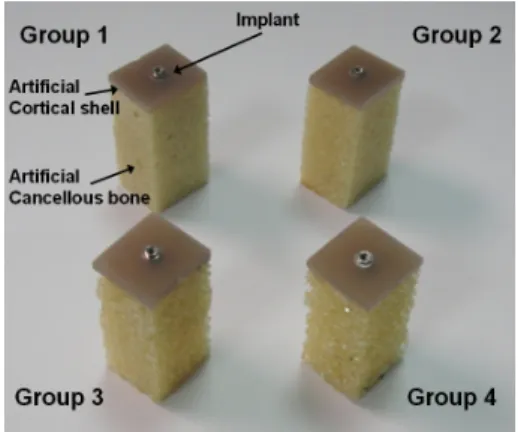
Four cellular rigid polyurethane foam blocks (Sawbones, Vashon, WA, USA) representing cancellous bone with elastic moduli of 137 MPa (Group 1), 47.5 MPa (Group 2), 23 MPa (Group 3), and 12.4 MPa (Group 4) were attached to a 2-mm-thick synthetic cortical shell with an elastic modulus of 16.7 GPa (Figure 1a). A commercial dental implant (4 mm in diameter and 12 mm long; ATLAS Implant System, Cowell Medi, Busan, South Korea) was used as the target dental implant in this study(Figure 1b).
Figure 1. Models of artificial foam bone with inserted implant as used in the experiments.
(2) Measurement of Peak Insertion Torque Value
Pilot holes were drilled into each artificial foam bone specimen using a 3.2-mm drill, and a commercial dental implant (4 mm in diameter and 12 mm long; ATLAS Implant System, Cowell Medi, Busan, South Korea) was inserted according to the manufacturer’s instructions. The peak ITV (in N.cm) was recorded for each specimen using a digital torque meter (TQ-8800, Lutron Electronic Enterprise, Taipei, Taiwan) (Figure 2).
Figure 2. Setup for measuring the peak ITV of the implants using a digital torque meter.
(3) Measurement of Bone–Implant Contact Percentage
The BIC% values were determined by using micro-CTto obtain 3D information. The micro-CT images of each specimen with an implant were imported into professional medical imaging software and then segmented using different thresholds for implant and bone (Figure 2). The entire exterior surface of the implant inside the specimen and the BIC area were then determined, with BIC% calculated as the area of the BIC region divided by the exterior surface area of the implant. In addition, the porosity was calculated in a region of approximately 4×3 mm3 (diameter×height) away
from where the implant was inserted in each artificial cancellous bone specimen.
Figure 2. (a) 3D model of the foam bone specimen with the inserted implant; (b) artificial cortical bone
and cancellous bone (closed view); (c) cylinder region for the calculation of porosity; (d) 3D model
of the implant; (e) exterior surface of the implant inside the artificial foam bone specimen; and (f)
BIC region.
(4) Statistical Analysis
The values of ITV and BIC% of the implants and the porosities in the four groups of artificial foam bones were summarized as mean±SD (standard deviation) values, with differences between them tested using one-way analysis of variance. Pearson’s correlation coefficient (r) was used to evaluate whether there was a statistically significant correlation between ITV and BIC%. The level of significance was deemed to be P<0.05. All statistical analyses were performed with SAS software.
4. Results and Discussion
Porosity of the Artificial Foam Bone Specimen
The porosities of the artificial foam bone specimens of the four groups are listed in Table 1. The porosity was highest in Group 4 (lowest density, 83.5±0.6%) and lowest in Group 1 (highest density, 62.3±0.2%). The SD of the porosity value was less than 1% in all of the groups, and the highest coefficient of variation of the four groups was 1.21% (0.8/66.1%). This small variation indicates that the porosity was very consistent across all of the artificial foam bone specimens.
Table 1. ITV and BIC% values of artificial jawbone specimens. The porosities of the four specimen groups are also listed. The values of density and elasticity were obtained from the manufacturer.
Insertion Torque
The ITVs of the implants in the four groups are also listed in Table 1. The mean value of the ITV in the four groups ranged between 38.5 and
56.2 N.cm, and was higher in higher density foam bone specimens. However, the difference between Groups 2 (45.6±0.9 N.cm) and 3 (43.3±4.3 N.cm) was not statistically significant.
Bone–Implant Contact Percentage
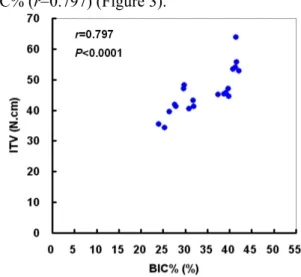
The mean BIC% value ranged from 26.2% to 41.5% (Table 1). The 3D BIC% was highest and lowest in Groups 1 and 4, respectively. There was strong positive correlation between the ITV and BIC% (r=0.797) (Figure 3).
Figure 3. Scattergraph illustrating the correlation between ITV and BIC%.
5. Conclusion
The experimental results obtained in this study indicate that the ITV decreases as the density/elasticity of the specimen increases as well as when the porosity of the specimen decreases. The initial implant stability, quantified as the ITV, was strongly positively correlated (r=0.797,
P<0.0001) with the 3D BIC%, as measured from
micro-CT images. 6. References
[1] Huang HL, Chang YY, Lin DJ, Li YF, Chen KT, Hsu JT (2011) Clin Oral Implants Res Online publication
[2] Huang HL, Fuh LJ, Tu MG, Hsu JT (2010) J
Med Biol Eng 30:85-89
[3] Degidi M, Perrotti V, Strocchi R, Piattelli A, Iezzi G (2009) Clin Oral Implants Res 20:778-781
[4] Nkenke E, Hahn M, Weinzierl K, Radespiel-Troger M, Neukam FW, Engelke K (2003) Clin Oral Implants Res 14:601-609 [5] Ito Y, Sato D, Yoneda S, Ito D, Kondo H,
Kasugai S (2008) Clin Oral Implants Res 19:9-14