Methods paper
Analysis of the association between transcription factor binding site variants and
distinct accompanying regulatory motifs in yeast
Sufeng Chiang
a, Krishna B.S. Swamy
a,b,e, Ting-Wei Hsu
a, Zing Tsung-Yeh Tsai
a,b,e, Henry Horng-Shing Lu
f,
Daryi Wang
c,⁎
, Huai-Kuang Tsai
a,b,d,⁎
a
Institute of Information Science, Academia Sinica, Taiwan
b
Bioinformatics Program, Taiwan International Graduate Program, Academia Sinica, Taiwan
c
Biodiversity Research Center, Academia Sinica, Taiwan
d
Research Center for Information Technology Innovation, Academia Sinica, Taiwan
eInstitute of Biomedical Informatics, National Yang-Ming University, Taiwan f
Institute of Statistics, College of Science, National Chiao Tung University, Taiwan
a b s t r a c t
a r t i c l e i n f o
Article history: Accepted 25 August 2011 Available online 16 September 2011 Received by A.J. van Wijnen Keywords:
Transcription factor binding site Variable position
Co-occurring TFs Gene expression
It is generally accepted that genes are regulated by the interactions between transcription factors (TFs) and their binding sites (TFBSs). Some studies have demonstrated that nucleotide variants at variable positions in TFBSs affect yeast gene regulation. Furthermore, variable positions in TFBSs in association with distinct accom-panying regulatory motifs of other TFs (i.e., co-TFs) can also impact gene regulation in eukaryotes. Given that, even low-affinity TF–DNA interactions are abundant in vivo; we used both low- and high-affinity TFBSs and per-formed a genome-wide analysis of associations between variable positions and co-TFs. We found that, in Saccharomyces cerevisiae, approximately 14% of the variable positions in TFBSs demonstrate such associations. These associations occurred in close proximity on the same promoters (i.e., highly co-localized). Moreover, such associations were highly conserved between sensu stricto yeasts and also influenced gene expression, which were consistent with enriched functional categories.
© 2011 Elsevier B.V. All rights reserved.
1. Introduction
Transcription factors (TFs) control gene regulation by binding to
specific binding sites (TFBSs) in the promoter regions of genes.
TFBSs are usually short (5–20 bp) and contain variable and invariable
positions (Fig. 1(a)) (Bulyk, 2003). Some studies have posited that
nucleotide substitutions at invariable positions usually result in bind-ing site loss, while different nucleotides at variable positions could be
functionally equivalent (Mirny and Gelfand, 2002; Moses et al., 2003).
However, a significant number of studies have shown that nucleotide
variants at variable positions in a TFBS can still cause differences in
gene expression (Segal et al., 2007; Andersen et al., 2008; Michal
et al., 2008; Swamy et al., 2009).
Eukaryotic transcription is a complex process that is often
mediated with a combination of TFs (Pilpel et al., 2001). In addition
to position variants in TFBSs, the accompanying binding sites of
different TFs (co-occurring TFs or co-TFs) (Fig. 1(b)) might also affect
gene regulation. A number of studies have emphasized the impor-tance of the synergistic effects of TFs while elucidating eukaryotic
transcriptional regulation (Pilpel et al., 2001; Keles et al., 2002;
Banerjee and Zhang, 2003; Chiang et al., 2003; Das et al., 2004;
Phuong et al., 2004; Tsai et al., 2005). Moreover, Pan et al. illustrated
that nucleotide variants in a TFBS may lead to different TF–DNA
bind-ing affinity, and the binding strength of TF–DNA may in turn affect the
binding of co-occurring TFs (co-TFs) in the promoter region (Pan
et al., 2010).
In a previous study (Swamy et al., 2009), we used a
chromatin-immunoprecipitation DNA chip (ChIP-chip) p-value of less than
0.01 as a TFBSfiltering criterion and showed that more than one
third of variable positions (i.e., functional variable positions) in
flu-enced gene expression. Some of them were functional both individ-ually and in combination with other variable positions. The results
were further confirmed by exploring the relationship between
these functional variable positions and co-TFs. However, a stringent ChIP-chip p-value criterion might restrict the results to TFBSs with
high TF–DNA affinity. Yet, previous studies have shown that even
low-affinity TF–DNA interactions can play an important role in
eu-karyotic transcriptional regulation (Tanay, 2006; Segal et al.,
2008). Although several computational methods have been
pro-posed for genome-wide detection of functional single nucleotide ⁎ Corresponding authors at: Institute of Information Science, Academia Sinica 128
Academia Road, Section 2, Nankang, Taipei 115, Taiwan. Tel.: +886 2 27883799x1718; fax: +886 2 27824814.
E-mail addresses:schiang@iis.sinica.edu.tw(S. Chiang),krishna@iis.sinica.edu.tw
(K.B.S. Swamy),twhsu@iis.sinica.edu.tw(T.-W. Hsu),zing@iis.sinica.edu.tw
(Z.T.-Y. Tsai),hslu@stat.nctu.edu.tw(H.H.-S. Lu),dywang@gate.sinica.edu.tw
(D. Wang),hktsai@iis.sinica.edu.tw(H.-K. Tsai).
0378-1119/$– see front matter © 2011 Elsevier B.V. All rights reserved. doi:10.1016/j.gene.2011.08.028
Contents lists available atSciVerse ScienceDirect
Gene
variants in TFBSs (Andersen et al., 2008; Michal et al., 2008;
Torkamani and Schork, 2008), to the best of our knowledge, the
synergistic effects of the nucleotide variants in TFBSs and their co-TFs have not been considered in a genome-wide scale. These factors motivated us to conduct a more comprehensive analysis to infer the relationships between variable positions in TFBSs and their co-TFs.
This study extends our previous work (Swamy et al., 2009), but
we focus on the relationships between variable positions in TFBSs and co-TFs in a more comprehensive manner. In the current analysis,
to include both low- and high-affinity TFBSs, we excluded the criteria
of promoters bound in ChIP-chip at p-value less than 0.01 but consid-ered a genome-wide set of predicted yeast TFBSs. Then, we explored the relationships between variable positions in TFBSs and co-TFs; that is, for each TF binding motif, we examined the association between the variable position and co-TFs. An association was suggested if the nucleotide frequencies at the variable position in the presence of
the co-TFs were significantly different from those of the motif alone
(Fig. 1(c)). We also investigated whether the significant association
had biological functions by integrating cDNA microarray data and
searching its functional annotations in FunCat (Ruepp et al., 2004).
Our results indicated that more than 14% of the variable positions
were significantly associated with other co-TFs. Most of the
associa-tions had synergistic effects on their target genes under certain envi-ronmental conditions, or the associations were enriched in FunCat.
Furthermore, the significantly associated pairs of variable positions
and co-TFs were highly conserved in Saccharomyces sensu stricto yeast species, suggesting that such associations are subject to evolu-tionary constraints.
2. Results and discussion
2.1. Association between variable positions in TFBS and co-TFs
Although our previous study focused on the variable positions that
cause differential gene expression, defined as functional variable
po-sitions (Swamy et al., 2009), the transcription of genes in a cell is
mostly due to multiple factors. To understand this complex mecha-nism, we analyzed the association between each variable position and their corresponding co-TFs (i.e., position-co-TF pairs) for all
yeast TFs. In total, we found 127 significant position-co-TF pairs,
in-cluding 74 variable positions (i.e., 14.2% of 520 variable positions in
all consensuses, seeSection 4.2) in 46 consensuses (Table S1).
In our previous study (Swamy et al., 2009), we retrieved yeast
TFBSs that showed high TF–DNA binding affinity in ChIP-chip data
and studied the functional variable positions (variable positions that
significantly influence gene expression). Further, we explored the
lationships between the variable positions and co-TFs, but we re-stricted our analysis to only functional variable positions. Therefore,
in this current work, we have used both low- and high-affinity
TFBSs and considered all variable positions in the predicted TFBSs to examine the position-co-TF pairs in a genome-wide scale. As a result,
the number of significant position-co-TF pairs is much larger in this
study. In fact, by extending beyond the confined sets of TFBSs, we
dis-covered many previously unknown position-co-TF pairs.
To assess how much the associated co-TFβ favors the preferred
nucleotide at the variable position p, we calculated the PC ratio (see
Section 4.3and Table S1). The value of the PC ratio can be used to
speculate the role played by a position-co-TF pair in regulatory mech-anism. A larger PC ratio indicates that the association of the co-TF with a TF, which regulates the target genes, is highly dependent on the occurrence of the preferred nucleotide at the variable position.
We then classified our 127 significant position-co-TF pairs into three
categories: the significant position-co-TF pairs with (I) strong
depen-dence on the preferred nucleotide (the PC ratioN0.8; Table S2(a));
(II) moderate dependence on the preferred nucleotide (0.8≥the PC
ratioN0.5; Table S2(b)); and (III) weak dependence on the preferred
nucleotide (the PC ratio≤0.5; Table S2(c)). For example, the
SKN7_a-8-Swi4 pair in category-I demonstrates that position 8 in
SKN7_a is mostly occupied by C when Swi4 co-occurs (Fig. 2(a)). In
category-III, the position-co-TF pairs do not demonstrate distinct
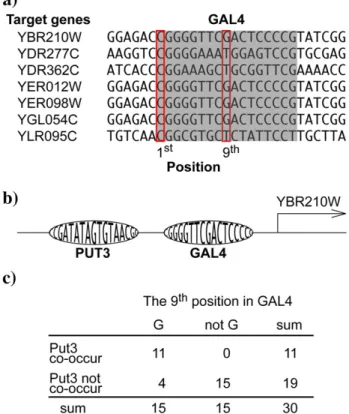
Fig. 1. Illustration of the association between one variable position in TFBSs and the co-TF. (a) The gray part denotes the GAL4 TFBSs in the promoter regions of the listed tar-get genes. These TFBSs contain both variable and invariable positions. At the variable positions in the TFBSs, there are nucleotide variants between the promoter regions. For example, position 9 is a variable position, and we canfind G in some promoters and T in other promoters. In contrast, position 1 is an invariable position with nucleo-tide C in all promoter regions. The variable and invariable positions are defined in Sec-tion 4.1. (b) In the promoter region of YBR210W, Put3 is a co-occurring TF (co-TF) of Gal4. (c) The contingency table for analyzing the relationship between position 9 in GAL4 and the co-TF Put3. It shows the frequency distribution of target genes of Gal4, which are grouped according to the 9th nucleotide in GAL4 and whether Put3 co-oc-curs. Position 9 in GAL4 is always G in the co-occurrence of Put3. When Put3 does not co-occur, other nucleotides, except G, occupy position 9 in most of the promoter regions.
Fig. 2. Two examples of significant position-co-TF pairs in category-I and category-III. (a) The contingency table of the SKN7_a-8-Swi4 pair, which is a category-I pair. (b) The contingency table of the ARG81-8-Reb1 pair, which is a category-III pair.
dependence between the co-TF and the variable position. However, the nucleotide frequencies at the variable positions of these pairs
that associated with a co-TF are still significantly different from
those with no association. Taking the ARG81-8-Reb1 pair as an exam-ple, the highest odds at position 8 in ARG81, along with Fisher's exact test, suggest an association between this position with G and the
co-TF Reb1 (Fig. 2(b)). The numbers of position-co-TF pairs in the three
categories are 52, 44 and 31, respectively. This finding indicates
that, in most of the significant position-co-TF pairs, the association of
the co-TF is highly dependent on the occurrence of the preferred nu-cleotide at the variable position.
Furthermore,five consensuses have significant position-co-TF pairs
that share the same co-TFs, but they are associated with different
var-iable positions (Table 1). For example, the co-TF Put3 is significantly
associated with consensus GAL4 at positions 7, 9, 12 and 14 with pre-ferred nucleotides T, G, T and C respectively. Although the positions in a TFBS are frequently considered to be independent of each other when predicting TFBSs, some studies have demonstrated position
interdependence of prokaryotic and metazoan TFBSs (Man and
Stormo, 2001; Bulyk et al., 2002). Our results imply the possibility
that, in yeast, variable positions in a TFBS associated with the same co-TF work together during gene regulation.
2.2. Evaluating significant position-co-TF pairs
To evaluate the reliability of our significant position-co-TF pairs,
wefirst generated a synthetic set of TFBSs by random shuffling of
the locations of TFBSs that were predicted by MYBS across the
pro-moters of S. cerevisiae genes. Then, we examined for significant
posi-tion-co-TF pairs by using the same method. None of the previously
identified significant position-co-TF pairs or any new significant
posi-tion-co-TF pairs were found when the synthetic set of TFBSs was
used. This demonstrated that the significant position-co-TF pairs
iden-tified in our analysis were indeed non-random and can be considered
reliable.
Furthermore, we also assessed the influence of possible false
pos-itive predictions of TFBSs on our detected significant position-co-TF
pairs. Wefirst assumed that the TFBSs used in this analysis (
Sec-tion 4.1) as well as our identified significant position-co-TF pairs are
true positives. Next, we generated a set of false positive TFBSs from all the TFs used in our analysis by relaxing the phylogenetic footprint-ing criterion. We then selected false positive TFBSs for each TF at ran-dom and included them into our true positive set and re-examined
for significant position-co-TF pairs. We performed this analysis by
in-cluding randomly selected false positive TFBSs in increasing amounts
of 5%, 10%, 15%, 20% and 25% into our true positive set of TFBSs. The
increase in number of significant position-co-TF pairs from false
posi-tive TFBSs indeed affect the results but was not substantial to com-promise our analysis (results not shown).
2.3. The synergism of position-co-TF pairs
The presence of position-co-TF pairs indicates that TF pairs may
have a synergistic effect on gene regulation. Tofind previously
pub-lished co-regulatory TF pairs that support our results, we compared
our significant position-co-TF pairs with the co-regulatory TF pairs
predicted byBalaji et al. (2006). Some of our significant
position-co-TF pairs (35 out of 127) are supported by their results (indicated by asterisk in Table S1). For example, we detected that the co-TF Rap1
associated significantly with position 13 in consensus CAT8. Balaji et
al. also observed that Cat8 and Rap1 may have synergistic effects on
gene regulation. These supporting results suggest that significant
po-sition-co-TF pairs can form combinations of TFs that control gene reg-ulation in a coordinated manner rather than individually.
Moreover,Hannenhalli and Levy (2002)showed that TFs that
regu-late synergistically probably have TFBSs co-localized at specific distances
in the genome. They used the co-localization index (CI) score to identify
synergistic TF pairs in the human genome. Theirfindings showed that
synergistic regulation may require that two TFBSs are in close physical proximity to each other. To determine the synergism in our results, we
calculated the CI50scores, i.e., two TFBSs that co-localize within 50 bp,
(see Supporting Materials A) for two groups of TF pairs: CI50associatedfor
the TF pairs from the 127 significant position-co-TF pairs and CI50allfor
all other potential TF pairs (seeSection 4.2). By a one-sided KS test,
we found that FCI50associatedbstFCI50allwith p-value=2.18 ×10
−7, where F
de-notes the distribution function of the CI50scores of TF pairs in a specific
group. We repeated this analysis by also calculating the CI200scores. On
comparison, we found that CI50showed more discriminatory bias than
CI200(Supporting Materials A). Thus we only considered the CI50scores
for further discussion of our results. Thisfinding indicates that our
signif-icant position-co-TF pairs are more likely to regulate synergistically than the other potential TF pairs.
2.4. Significant position-co-TF pairs are conserved between related
yeast species
The conserved functional elements in the promoter regions of
relat-ed yeasts tend to be constrainrelat-ed under selection (Kellis et al., 2003). To
assess the significance of our results, we estimated the evolutionary
conservation of our predicted position-co-TF pairs in S. cerevisiae and
other four related sensu stricto yeast species (seeSection 4.4). From
one-sided Kolmogorov–Smirnov (KS) test, we found that the
con-served proportions in the predominant target genes of the 127 signi
fi-cant position-co-TF pairs were significantly higher than that of
position-co-TF pairs, which were not significant according to Fisher's exact test
(p-value= 5.37 × 10⁻¹⁹). A similar comparison was performed for
pro-portions of these significant position-co-TF pairs in the predominant
and non-predominant groups of target genes. The conserved
propor-tions in the predominant groups were significantly higher than that
in the non-predominant groups (p-value= 2.98 × 10⁻⁹). These results
indicate that our detected significant position-co-TF pairs are indeed
conserved. The high degree of conservation of our significant
position-co-TF pairs suggests that they are under selection constraints; thus, they might be functional in the regulation.
Furthermore, a comparison of conserved proportions of 127 signif-icant position-co-TF pairs in the other four related yeast species
be-tween the three categories defined earlier was made. The
position-co-TF pairs in category-III was found to have lower conserved proportions,
while categories-I and II showed higher conserved proportions (Fig. 3).
This implies that the position-co-TF pairs with distinct dependence are more likely to be evolutionary conserved in the other four species. Table 1
Significant position-co-TF pairs that share the same co-TF, but are associated with dif-ferent variable positions.
Consensusa
Co-TF Associated variable positions
ARG81 (NNBARNHN) Reb1 (3,8)
GAL4 (CGSVVNNNNNBNBNHCG) Put3 (7,9,12,14)
GAL80 (CGVRVBDSVVYNYBCCG) Hap1 (9,11)
HAP1 (GSNNDHNNCGS) Gal4 (3,4,6,7,8) Gal80 (3,4,5,6,7,8) Leu3 (3,4,7) Opi1 (3,4,6,7) Put3 (3,4,6,7) PUT3 (CSGNNNNNNNNBNMCG) Gal4 (2,5,9,11,13,14) Gal80 (2,5,9,11,13,14) Hap1 (7,14) Leu3 (8,9,11,13,14) Opi1 (2,4,9,14)
Some significant position-co-TF pairs share the same co-TF and are associated with more than one variable position in a specific consensus. Five consensuses have such position-co-TF pairs.
a
2.5. The influence of significant position-co-TF pairs on gene expression Next, we used the two-way ANOVA test to examine the effects of
significant position-co-TF pairs on gene expression under different
bi-ological conditions. For this test, we used 23 expression datasets
(de-tailed in Table S3) obtained from SMD (Demeter et al., 2007). Since
most of the significant position-co-TF pairs produce unequal cell
fre-quencies, conventional ANOVA performs poorly on such unbalanced data. Here, we adopted the hierarchical Bayesian approach to analyze
the effect of significant position-co-TF pairs (Section 4.6) (Qian and
Shen, 2007). A position-co-TF pair was deemed to be“effective” in a
dataset if it showed significant influence on gene expression in that
dataset. As shown in Table S4, 45 significant position-co-TF pairs
(~36%) are effective in at least one dataset.
Furthermore, to understand the overall influence of these 45
effective pairs on gene expression, we classified the 23 expression
data sets into eight groups (Table 2) and examined the number of
datasets that contained the pairs' information. We found 21 effective
pairs, were only effective in one group of datasets (Table 3(a)), with
most of these pairs involved in stress group (13 pairs), and only a few of them were effective in the metal ion group (3 pairs), DNA damage group (4 pairs) and cell cycle group (1 pair). While, for the remaining 24 effective pairs that were effective in at least two groups
of datasets (Table 3(b)), were found in higher concentration in the
glucose group (10 pairs), stress group (19 pairs) and cell cycle group (10 pairs).
Among the eight groups of datasets, the stress group contains most of the gene expression datasets, and the highest number of effective pairs corresponds to this group. There are fourteen datasets in the
stress group and 32 significant position-co-TF pairs are effective in
those datasets. In the stress group, the highest number of effective pairs (13 pairs) corresponds to the HP dataset, which is related to the response of yeast genes under hydrogen peroxide treatment
(Shapira et al., 2004). We found that a combination of co-TFs (Gal4,
Gal80, Leu3, Opi1, and Put3) is significantly associated with position
7 in HAP1, and they are effective in the HP dataset (Table S4). In S. cer-evisiae, Hap1 is known to regulate the enzymes that protect yeast
against oxidants (Jamieson, 1998). Here, our results demonstrate
that variable positions in Hap1 binding sites are highly associated with the co-TFs under oxidative stress. Although it is known that the regulation mechanism is mediated by a combination of TFs, our
results suggest that the roles of position-co-TF pairs seem to be more dominant, particularly in stress related environments.
As an another example, in the metal ion group, both the Na and Ca
datasets (Yoshimoto et al., 2002) contain the gene expression
regulat-ed by calcineurin when yeasts are exposregulat-ed to Na(+) and Ca(2+) ions. The SKN7_b-7-Rox1 pair is shown to be effective in the Na and Ca data-sets (Table S4). It is known that Skn7 is involved in the stabilization of
Crz1 and the regulation of calcineurin signaling (Williams and Cyert,
2001). Therefore, we propose that Skn7 and Rox1 might coordinate
and be involved in the homeostasis of Na(+) and Ca(2+) ions in yeast. The DNA damage group contains data about the response of yeast genes to chemical DNA damage (MMS dataset), physical DNA damage
(Gamma dataset) and mock irradiation (Mock dataset) (Gasch et al.,
2001). We found that the CHA4-8-Hap1 pair is effective in the MMS
dataset (Table S4). Both Cha4 and Hap1 have been linked to the
MMS response in a previous study byBenton et al. (2006). They
found that genes regulated by the combination of Cha4 and Hap1 were down-regulated in response to MMS. This suggests the contri-bution of the CHA4-8-Hap1 pair when DNA molecules suffer chemical damage in yeast.
The sporulation group only contains the Sp dataset published by
Chu et al. (1998). The dataset comprises the yeast gene expression
profile during sporulation. Eight position-co-TF pairs are effective in
this dataset. All of them are involved in the transient stage of sporu-lation, and one of them also affects the later stages. For example, the UME6-2-Tbf1 pair affects the transient stage during sporulation (Table S4). It has been shown that Ume6 regulates the meiotic
induc-tion of meiosis-specific genes (Steber and Esposito, 1995). This
find-ing indicates that the UME6-2-Tbf1 pair might contribute to the early induction of sporulation. These groups of datasets exemplify
the possibility that most of the significant position-co-TF pairs are
ef-fective under diverse environmental conditions and sporulation. Fig. 3. The relationships between conserved proportions and categories of significant
position-co-TF pairs. The box plot includes the distributions of conserved proportions of the significant position-co-TF pairs in categories-I, II and III. The red line represents the median; the bottom and top of the box represent the lower and upper quantiles, respectively; and the ends of the whiskers represent the 9th and 91st percentiles of the conserved proportions.
Table 2
Overview of effective pairs.
Groups of expression datasets # of effective pairs
Glucose perturbation 10 Glu 10 Stress 32 Hp 13 Md 11 Hs 6 Os 3 T25 4 T30 1 HPII 4 Diamide 3 Nitrogen 1 Metal ion 10 Na 2 Ca 8 Zn 2 DNA damage 8 MMS 3 Gamma 2 Mock 3 Knock out 4 Snf 2 Swi 2 Cell cycle 11 Alpha 6 Cdc15 6 Elu 2 Sporulation 8 Sp 8 Diauxic shift 3 Ds 3
Out of the 127 significant position-co-TF pairs, 45 are effective in gene expression in at least one of the 23 gene expression datasets (shown in lightface). To facilitate a comprehensive discussion, we also classified the 23 datasets into eight groups (shown in boldface).
2.6. The functional annotation of significant position-co-TF pairs
To assess the biological function of the 127 significant position-co-TF
pairs, we used Functional Catalogue (FunCat,
http://mips.helmholtz-muenchen.de/proj/funcatDB/search_main_frame.html) (Ruepp et al.,
2004) to look for functional enrichment of the predominant target
genes of each pair. FunCat provides a set of hierarchically structured annotations of gene functions for prokaryotes, fungi, plants and ani-mals. It employs the hypergeometric test to examine the enriched functional category for a group of target genes. To determine the enriched functional categories, we compared multiple hypergeometric p-values corresponding to distinct functional categories. Further, we
performed q-value correction to control for false discovery rate (Storey
and Tibshirani, 2003) due to multiple hypothesis testing. A
position-co-TF pair was considered as enriched in a functional category if the
q-value of the enrichment score was≤0.05 and at least five genes in
the group of predominant target genes were classified into that
catego-ry. Note that assignment of position-co-TF pairs to a category varied among the different levels of the hierarchy. Based on our q-value
criterion, some pairs were assigned to more than one category, includ-ing the main category and its sub-categories. We also found that some pairs were assigned to a sub-category, but not the main category. As
shown in Table S5, 51 out of 127 significant position-co-TF pairs are
enriched in 13 functional categories (we call such position-co-TF pairs enriched pairs). Among the 13 categories, four are main categories and the remaining nine correspond to sub-categories. These categories also corresponded to six distinct biological processes in yeast (marked by asterisks in Table S5).
The majority of the enriched pairs (50 out of 51) correspond to three functional categories with the following FunCat numbers {43, 43.01,
43.01.03}. This suggests that the functional annotations of the signi
fi-cant position-co-TF pairs in FunCat are concentrated in“cell type
differ-entiation”. As an example of such enriched pairs, the HAP1-4-Opi1 pair
is enriched in the functional categories {43, 43.01, 43.01.03}. Under
specific environmental conditions, yeast is known to change into
other cell types (i.e., from a diploid cell to a haploid cell during glucose
starvation, and even to pseudohyphalfilament during nitrogen
starva-tion) (Madhani, 2000). Both Hap1 and Opi1 are known to participate in
Table 3
Categories of effective pairs.
Effective pairs Glucose Stress Metal ion DNA damage Knock out Cell cycle Sporulation Diauxic shift
(a) AFT1-2-Met31 + ARG81-6-Met31 + ARG81-8-Reb1 + FKH1-3-Repressor of Car1 + GIS1-8-Mal63 + HAP1-4-Put3 + HAP1-6-Gal4 + HAP1-6-Put3 + HAP1-7-Gal80 + HAP1-8-Gal4 + HAP1-8-MSE + HAP3-2-Mig1 + MAC1-4-Ace2 + MAL63-6-Opi1 + MBP1-1-Ace2 + REB1-6-Ppr1 + RFX1-11-Ste12 + SIP4-1-Sut1 + STB4-6-GC_FAR + SUT1-8-STRE + SWI6_a-1-Ace2 + (b) ABF1-9-Gcn4 + + CAT8-12-Sut1 + + CAT8-13-Rap1 + + + + CHA4-8-Hap1 + + HAP1-3-Leu3 + + HAP1-3-Opi1 + + + HAP1-4-Gal4 + + + HAP1-4-Leu3 + + + HAP1-4-Opi1 + + + + HAP1-6-Opi1 + + HAP1-7-Gal4 + + HAP1-7-Leu3 + + + + + HAP1-7-Ndd1 + + + HAP1-7-Opi1 + + + + + HAP1-7-Put3 + + + HAP2_3_4-9-Hap1 + + LYS14-6-Xbp1 + + + MAL63-4-Opi1 + + + NDD1-6-Mtf2 + + PUT3-9-Leu3 + + REB1-6-Lys14 + + SKN7_b-7-Rox1 + + TEA1-8-Hap1 + + UME6-2-Tbf1 + +
45 effective pairs were classified into two categories: (a) the effective pairs were effective in only one group of datasets; (b) the effective pairs were effective in multiple groups of datasets.
the important mechanism of cell membrane biogenesis during the
pro-gress of yeast differentiation (Sreenivas and Carman, 2003; Nohturfft
and Zhang, 2009). This implies that the HAP1-4-Opi1 pair might be
functional in protein fate and yeast differentiation by playing a role in cell membrane biogenesis.
It was interesting that these 50 enriched pairs were found to in-volve a very small number of TFs, most of them with very degenerate consensuses. To evaluate if the functional association of these motifs and their being associated with different co-TFs was an artifact of de-generacy; we estimated the number of co-TFs and the number of position-co-TF pairs as a function of the number of variable positions in such degenerate consensuses (not shown). We found that the number of co-TFs associated with a consensus did not linearly in-crease with the level of degeneracy of consensus. Only two consen-suses (HAP1 and PUT3) were found to be associated with a distinguishable number of position-co-TF pairs (HAP1 with 24 pairs and PUT3 with 23 pairs). Other consensuses were associated with
less thanfive position-co-TF pairs. This indicates that the occurrence
of degenerate motifs in position-co-TF pairs might be coincidental and need not be a computational artifact. Moreover, it is suggested
(Hannenhalli and Levy, 2002) that TFBSs which associate with other
co-TFs in close proximity can be considered to be reliable. Hence, we believe that the functional annotations detected by our analysis can be deemed as reliable.
We alsofind it interesting that the enriched pairs have higher
con-served proportions of predominant target genes in yeast S. cerevisiae and the other four related species (with a sample mean of 0.355 and a standard deviation of 0.04). These enriched pairs also belong to categories-I or II (Table S2). The two exceptions are position-co-TF pairs HAP1-3-Put3 and HAP1-7-Put3, which reside in category-III. This demonstrates that position-co-TF pairs that are enriched in func-tional categories according to FunCat also have a tendency to be the pairs in categories-I and II (i.e., pairs with the strongest evidence for dependence between their variable positions and the co-TFs). More-over, the high conservation of these enriched pairs in the other four species is evidence of their functional importance.
2.7. Some significant position-co-TF pairs are biologically functional
To derive an overview of the possible biological functions of the
significant position-co-TF pairs, we considered the union of effective
and enriched pairs. Of the 127 significant position-co-TF pairs, about
64% (81 position-co-TF pairs) were found to belong to either effective pairs or enriched pairs. Moreover, these position-co-TF pairs are plen-tiful in categories-I, II and III, which could imply that most of them
have biological functions. On a closer view, wefind a total of 15 out
of 51 enriched pairs are also effective pairs. Though, the number of enriched pairs that are also effective is not high, it can be considered reasonable; while considering the fact that the functions of the enriched pairs are related to the biological conditions in which the pairs are effective (Table S6). We can consider the HAP1-4-Opi1 pair again as an example; it is effective in the conditions correspond-ing to glucose perturbation, stress, cell cycle and sporulation. This enriched pair is involved in protein fate and yeast differentiation. Our results thus indicate the possibility that these position-co-TF pairs may facilitate several biological processes under related conditions.
Although the functional roles of several position-co-TF pairs were
identified by our gene expression analysis and by the enrichment in
functional categories, we still found several inconsistencies. For ex-ample, the HAP1-8-Gal80 pair was enriched in the functional catego-ries {43, 43.01 and 43.01.03}, but it was not effective in our downloaded datasets. The cause of the inconsistency is not clear; however, it may be because we employed a simple model for ANOVA. The noise inherent in gene expression datasets may also be responsible. A method that considers additional factors, such as
nucleosome occupancy and the presence of a TATA box, might im-prove the overall consistency between the set of effective pairs and enriched pairs. In addition, inconsistencies could be due to our down-loaded datasets. Though the dataset currently used in this analysis is
substantial to explore the influence of effective pairs on gene
expres-sion, it does not cover all the environmental conditions in yeast. Using a larger set of microarray data can probably enhance the overall consistency between the set of effective pairs and enriched pairs. Moreover, the function annotations in FunCat only cover a portion of all yeast functions. By considering the compositional bias of nucle-otides while determining the variable positions, we have attempted
to determine the combinatorial influence of TFs in regulatory
mecha-nism. The detailed analysis of possible source of inconsistency is com-plex and beyond the scope of this work. This can be considered separately in our future analysis.
3. Conclusion
In this study, we have attempted to demonstrate the importance
of position-co-TF pairs in yeast. Significant position-co-TF pairs are
more likely to have synergistic effects on gene regulation. They also exhibit high conservation in sensu stricto yeast species, which rein-forces their functional importance. Furthermore, integrating the gene expression data and the functional annotations provides an
overview of the functions of the significant position-co-TF pairs.
Although the mechanism responsible for the combinatorial regulation of the variable positions in TFBSs and the co-TFs is still unclear, our findings support the association and the possibility that it may influ-ence gene regulation in yeast.
4. Materials and methods
Fig. 4shows theflowchart for analyzing the association between
nucleotide variants at variable positions in TFBSs and co-TFs. First, we collected target genes and the consensuses of all yeast TFs. Then for each consensus, we determined the variable positions and poten-tial co-TFs. Next, we performed Fisher's exact test to determine the association between each pair of variable positions and the co-TFs (called position-co-TF pair). We also applied two-way ANOVA test to
assess the influence of significant position-co-TF pairs on gene
expression.
4.1. Collecting target genes, consensuses and variable positions of TFs We retrieved the target genes of TFs from Mining Yeast Binding
Sites database (MYBS, http://cg1.iis.sinica.edu.tw/~mybs/) (Tsai
et al., 2007). MYBS integrates experimentally verified and predicted
consensuses or position weight matrices (PWMs) and contains the target genes that correspond to a total of 183 known yeast TFs. It also allows users to dynamically select criteria and search for occur-rences of motifs (possible binding sites) in the promoters of the genes of interest. In our study, we only analyzed consensuses (or PWMs) that were deemed as reliable by MYBS. To determine whether a TFBS should be included in our analysis, it was subjected to the
phy-logenetic footprintingfilter, i.e., it must be conserved in at least two of
the other seven related yeast species in MYBS. To avoid ambiguity, a target gene was excluded from the analysis if the TFBS bound by the same TF occurred more than once, but with different sequences, in the gene's promoter region. However, some TFBSs are known to occur in clusters and there is a possibility that TFBSs present in such
target genes have been excluded because of thisfilter. We estimated
the percentage of excluded target genes bound by each TF and found that only a small part of TFs (~10%) have more than 20% of total target
genes excluded. Since, by thisfilter, only a small part of target genes
were excluded for the most TFs, we can assume that it will not induce a great degree of bias in the following analyses.
For a TF with more than one consensus, we considered all of their
target genes and compiled a“universal consensus” by taking the
com-mon subsequence of all consensuses corresponding to the TF. For ex-ample, Rds1 had three consensuses (CGGCCG, CGGCCGAV and KCGGCCGA) in MYBS, so our universal consensus was the common subsequence, CGGCCG. Seven TFs, namely, Hac1, Met4, Ndt80, Pho2, Rox1, Skn7 and Swi6 had two distinct consensuses; therefore, for
those TFs, we compiled a“universal consensus” for each of the two
distinct consensuses separately. Furthermore, five consensuses,
namely, HAP2_3_4, INO2_4, MSN2_4, PDR1_3 and SWI4_6, were
recognized by more than one distinct TF. We considered thosefive
consensuses as their respective universal consensuses. For example,
the consensus of HAP2_3_4 was identified by Hap2, Hap3 or Hap4.
In total, our dataset comprised 150 universal consensuses in the S. cerevisiae genome (Table S7).
Next, we determined the variable positions in a universal consensus. Although it is customary to determine variable positions by employing information content (IC) cutoff, to be consistent with our previous
work (Swamy et al., 2009), we followed our previous definition of
vari-able positions. For each position in a universal consensus, wefirst
calcu-lated the frequency of each nucleotide (i.e., the number of target genes containing a particular nucleotide in the position of interest). Then, we
defined a position as variable if at least two nucleotides occurred
sepa-rately more thanfive times in the total number of occurrences.
4.2. Identifying potential co-TFs
To reduce the computational time complexity we examined for each
consensusα, if there existed a potential co-TF; that is, whether the
pre-dicted TFBSs of TFβ occurred more often than under random
expecta-tion in the promoter regions of the same target genes. A consensusα
without any variable positions was excluded, as it does not qualify for studying the association between variable positions and co-TFs. After
ex-cluding the consensuses without any variable positions, our refined
con-sensusα dataset contained 129 consensuses with 520 variable positions.
On the other hand, for co-TFβ, we considered all 150 consensuses.
Whether a potential co-TFβ co-occurred with consensus α was
deter-mined by calculating if N12/N was greater than the random expectation
(N1/N)×(N2/N), where N1is the total number of target genes of
consen-susα; N2is the total number of target genes of TFβ; N12is the total
number of target genes of bothα and β; and N is the total number of
genes in the S. cerevisiae genome. In spirit, this test is similar to the chi-square test of independence. Under random association, the joint
probability of N12/N should be equal to the product of the two marginal
probabilities, (N1/N) ×(N2/N). If N12/N is greater than (N1/N)× (N2/N),
then there is a positive association. Note that target genes in which
the binding sites ofα and β overlapped in the promoter regions were
not considered. This procedure only eliminated those TFs which had
the least possibility of forming co-TFβ for a given consensus α.
4.3. Examining the association between variable positions and co-TFs
We defined that, for each variable position p in consensus α, its
as-sociated potential co-TFβ formed a position-co-TF pair (α-p-β pair).
Then, we performed Fisher's exact test (Mehta and Patel, 1986) to
de-termine whether the pair was significant; that is, whether the
nucle-otide variants at position p associated significantly with the potential
co-TFβ to form a significant position-co-TF pair. To analyze the
asso-ciation, we constructed a contingency table. As shown in Figure S1,
we divided the target genes ofα into groups based on the nucleotides
at p and whether they were bound/not-bound byβ. The null
hypoth-esis is that the nucleotide variants at p are independent ofβ. To assess
the significance of the association between p and β, we computed the
exact two-sided p-value. This was computed by summing the proba-bilities of all possible arrangements of target genes that were equal to or less than the probabilities of the observed arrangements under fixed marginal totals. Then, we determined the false discovery rate
(FDR) (Storey and Tibshirani, 2003) to control false positive
(q-value) due to multiple hypothesis testing. In the set of
position-co-TF pairs, we defined a pair as significant if its q-value was ≤0.05.
Moreover, we identified the most preferred nucleotide of a
position-co-TF pair based on the highest odds derived by the following formula:
the odds of a nucleotide at the variable position¼Xi1
Xi2; Fig. 4. Flowchart of the proposed method. (a) The consensuses, target genes, and
pre-dicted TFBS sequences for TFs are retrieved. (b) The variable positions and potential co-TFs are determined. For example, we group the target genes of GAL4 corresponding to position 9 with the preferred nucleotide G or T and targeted by Put3 into“Put3 co-oc-curring” group with “G” or “T” separately. (c) We apply Fisher's exact test to determine the association between position 9 in GAL4 and the co-TF Put3. (d) We integrate micro-array data to study if such associations influence gene expression.
where i represents the nucleotide (A, T, C or G) at the variable
posi-tion; Xi1represents the number of common target genes of both
con-sensusα and co-TF β; and Xi2represents the number of target genes
of consensusα alone. For each position-co-TF pair, we defined the
pre-dominant target genes as the subgroup of common target genes of
bothα and β with the preferred nucleotide occupying p. We also
de-fined the predominant/common ratio (PC ratio) as the ratio of the number of predominant target genes over the common target genes
of consensusα and co-TF β.
4.4. Conservation of position-co-TF pairs
To measure the degree of conservation of significant position-co-TF
pairs across related yeast species, we downloaded the orthologous TFBSs of four related yeast species (S. paradoxus, S. mikatae, S. kudriavzevii
and S. bayanus) from MYBS (Tsai et al., 2007). A position-co-TF pair in a
promoter region is deemed conserved if it occurs in S. cerevisiae and each of its related species within a window size of 25 bp. Furthermore, the preferred nucleotide had to remain unchanged at the variable posi-tion p of interest in all orthologs and also the co-TF had to co-occur with all the orthologs. We next arrived at the proportion of promoter re-gions in the predominant target genes that contained the conserved
position-co-TF pairs. Then, to determine whether the significant
position-co-TF pairs were more conserved, we applied the one-sided KS test to examine their conserved proportion with that of the potential
position-co-TF pairs (i.e., not significant according to Fisher's exact test).
In addition, we also estimated the level of conservation of a position-co-TF pair in promoters of the non-predominant group of tar-get genes. These estimates were derived by applying the same criteria used for assessing conservation in the predominant group. Except that, the non-preferred nucleotide (i.e., the nucleotide was not a pre-ferred nucleotide; and it occurred at p) had to be the same at the var-iable position p in all the orthologs. Further, we compared if the conserved proportions in the predominant groups was higher than the proportions in non-predominant groups of target genes by the one-sided KS test.
4.5. Microarray data
We used 23 cDNA microarray datasets (see Table S3) downloaded
from the Stanford Microarray Database (SMD,http://genome-www5.
stanford.edu) (Demeter et al., 2007). The datasets contained the gene
expression profiles for experiments ranging from cell nature (e.g., cell
cycle) and gene response to environmental perturbation (e.g., heat shock). First, to reduce the bias within each microarray, we applied
MA lowess normalization (Quackenbush, 2002). Then, the center of
the log 2 transformed experiment/reference intensity ratio (log 2 ratio) distribution was shifted to zero. Next, we performed quantile
normalization (Bolstad et al., 2003) to moderate the biases between
microarrays.
4.6. The relationships between TFBS variable positions and co-TFs in gene expression
To determine whether both nucleotide variants at a variable
posi-tion p in a consensusα and co-TF β influence gene expression, we
used the following two-way ANOVA model: Yijk¼ μ0þ μiþ μjþ μijþ εijk;
where, i represents the nucleotide (A, T, C or G) at the variable
po-sition p; j indicates whether TFβ co-occurs with a consensus α; μ0is
the overall mean of all the target genes of a consensusα; μiis the
main effect of the nucleotide variants at the variable position p;μjis
the main effect of the co-TFβ; μij is the effect of the interaction
between the nucleotide variants and the co-TFβ; and Yijkis the
ex-pression level of gene k.
In conventional ANOVA, the total variance is partitioned into com-ponents related to the effects used in the model. For example, the
total variance in Yijkis partitioned into between-group variance (σ2i,
σ2
j, andσ2ijcorresponding to their meansμi,μj, andμijrespectively)
and within-group variance (σ2, the variance of the residual term
εijk). These can be calculated in terms of sum-of-squares, which are
examined by F-test for significance. The F-test is robust against the
assumption of equal variance, when the sample sizes are equal. In cases when sample sizes are different, it suffers from serious lack of power.
As shown in Figure S1, we divided the target genes ofα into groups
based on the nucleotides at p and whether they were
bound/not-bound byβ. Since, for significant position-co-TF pairs detected by
Fish-er's exact test, the number of target genes in each cell of this contingen-cy table is disparate and for such cases conventional ANOVA performs poorly. Instead of using conventional analysis, we thus adopted the
hi-erarchical Bayesian approach for ANOVA (Qian and Shen, 2007) to
es-timate the model coefficients of ANOVA. Importantly, Bayesian
models can estimate posterior distribution of model coefficients and
can seamlessly handle unbalanced and small-sample designs. Further-more, it is easy to implement their computation using Markov chain
Monte Carlo simulations (MCMC) (Qian et al., 2003).
Specifically, we estimated the interaction terms, μij, for each
posi-tion-co-TF pair by performing MCMC using the“OpenBUGS” software
(Lunn et al., 2009). For the analysis, we constructed Markov chains
whose states comprised all the above-mentioned ANOVA coefficients
and iterated MCMC simulations. In the simulations, we assumed that
the prior distributions of all ANOVA coefficients followed the normal
distribution for cDNA microarray data analysis. Hence, we derived the
estimates ofμijafter the Markov chains converged. At least two
Mar-kov chains were required for the convergence diagnostics (Brooks
and Gelman, 1998). However, constructing Markov chains is
compu-tationally expensive, so we only constructed three Markov chains for the iterative MCMC simulations. After convergence, we derived the Bayesian inference with the estimated posterior distribution of the
coefficient μij. To ensure that the associated interactions between
the nucleotide variants at the variable position and the co-TF were
significant, we set the criterion that the 95% confidence interval of
the estimated posterior distribution ofμijshould exclude zero.
Acknowledgments
This work was supported by the Institute of Information Science, Academia Sinica and the National Science Council of Taiwan (Grants NSC98-2221-E-001-015 and NSC99-2627-B-001-003) to H.-K. T. Appendix A. Supplementary data
Supplementary data to this article can be found online atdoi:10.
1016/j.gene.2011.08.028.
References
Andersen, M.C., et al., 2008. In silico detection of sequence variations modifying tran-scriptional regulation. PLoS Comput. Biol. 4, e5.
Balaji, S., Babu, M.M., Iyer, L.M., Luscombe, N.M., Aravind, L., 2006. Comprehensive analysis of combinatorial regulation using the transcriptional regulatory network of yeast. J. Mol. Biol. 360, 213–227.
Banerjee, N., Zhang, M.Q., 2003. Identifying cooperativity among transcription factors controlling the cell cycle in yeast. Nucleic Acids Res. 31, 7024–7031.
Benton, M.G., Somasundaram, S., Glasner, J.D., Palecek, S.P., 2006. Analyzing the dose-dependence of the Saccharomyces cerevisiae global transcriptional response to methyl methanesulfonate and ionizing radiation. BMC Genomics 7, 305. Bolstad, B.M., Irizarry, R.A., Astrand, M., Speed, T.P., 2003. A comparison of
normaliza-tion methods for high density oligonucleotide array data based on variance and bias. Bioinformatics 19, 185–193.
Brooks, S.P., Gelman, A., 1998. General methods for monitoring convergence of itera-tive simulations. J. Comput. Graph Stat. 7, 434–455.
Bulyk, M.L., 2003. Computational prediction of transcription-factor binding site loca-tions. Genome Biol. 5, 201.
Bulyk, M.L., Johnson, P.L., Church, G.M., 2002. Nucleotides of transcription factor bind-ing sites exert interdependent effects on the bindbind-ing affinities of transcription fac-tors. Nucleic Acids Res. 30, 1255–1261.
Chiang, D.Y., Moses, A.M., Kellis, M., Lander, E.S., Eisen, M.B., 2003. Phylogenetically and spatially conserved word pairs associated with gene-expression changes in yeasts. Genome Biol. 4, R43.
Chu, S., et al., 1998. The transcriptional program of sporulation in budding yeast. Sci-ence 282, 699–705.
Das, D., Banerjee, N., Zhang, M.Q., 2004. Interacting models of cooperative gene regula-tion. Proc. Natl. Acad. Sci. U.S.A. 101, 16234–16239.
Demeter, J., et al., 2007. The Stanford microarray database: implementation of new analysis tools and open source release of software. Nucleic Acids Res. 35, D766–D770.
Gasch, A.P., Huang, M., Metzner, S., Botstein, D., Elledge, S.J., Brown, P.O., 2001. Genomic expression responses to DNA-damaging agents and the regulatory role of the yeast ATR homolog Mec1p. Mol. Biol. Cell 12, 2987–3003.
Hannenhalli, S., Levy, S., 2002. Predicting transcription factor synergism. Nucleic Acids Res. 30, 4278–4284.
Jamieson, D.J., 1998. Oxidative stress responses of the yeast Saccharomyces cerevisiae. Yeast 14, 1511–1527.
Keles, S., van der Laan, M., Eisen, M.B., 2002. Identification of regulatory elements using a feature selection method. Bioinformatics 18, 1167–1175.
Kellis, M., Patterson, N., Endrizzi, M., Birren, B., Lander, E.S., 2003. Sequencing and compar-ison of yeast species to identify genes and regulatory elements. Nature 423, 241–254. Lunn, D., Spiegelhalter, D., Thomas, A., Best, N., 2009. The BUGS project: evolution,
cri-tique and future directions. Stat. Med. 28, 3049–3067.
Madhani, H.D., 2000. Interplay of intrinsic and extrinsic signals in yeast differentiation. Proc. Natl. Acad. Sci. U.S.A. 97, 13461–13463.
Man, T.K., Stormo, G.D., 2001. Non-independence of Mnt repressor–operator interac-tion determined by a new quantitative multiplefluorescence relative affinity (QuMFRA) assay. Nucleic Acids Res. 29, 2471–2478.
Mehta, C.R., Patel, N.R., 1986. ALGORITHM 643: FEXACT: a FORTRAN subroutine for Fisher's exact test on unordered r× c contingency tables. ACM Trans. Math Softw. 12, 154–161. Michal, L., Mizrahi-Man, O., Pilpel, Y., 2008. Functional characterization of variations on
regulatory motifs. PLoS Genet. 4, e1000018.
Mirny, L.A., Gelfand, M.S., 2002. Structural analysis of conserved base pairs in protein– DNA complexes. Nucleic Acids Res. 30, 1704–1711.
Moses, A.M., Chiang, D.Y., Kellis, M., Lander, E.S., Eisen, M.B., 2003. Position specific variation in the rate of evolution in transcription factor binding sites. BMC Evol. Biol. 3, 19. Nohturfft, A., Zhang, S.C., 2009. Coordination of lipid metabolism in membrane
biogen-esis. Annu. Rev. Cell Dev. Biol. 25, 539–566.
Pan, Y., Tsai, C.J., Ma, B., Nussinov, R., 2010. Mechanisms of transcription factor selectiv-ity. Trends Genet. 26, 75–83.
Phuong, T.M., Lee, D., Lee, K.H., 2004. Regression trees for regulatory element identifi-cation. Bioinformatics 20, 750–757.
Pilpel, Y., Sudarsanam, P., Church, G.M., 2001. Identifying regulatory networks by com-binatorial analysis of promoter elements. Nat. Genet. 29, 153–159.
Qian, S.S., Shen, Z., 2007. Ecological applications of multilevel analysis of variance. Ecol-ogy 88, 2489–2495.
Qian, S.S., Stow, C.A., Borsuk, M.E., 2003. On Monte Carlo methods for Bayesian infer-ence. Ecol. Model. 159, 269–277.
Quackenbush, J., 2002. Microarray data normalization and transformation. Nat. Genet. 32 (Suppl), 496–501.
Ruepp, A., et al., 2004. The FunCat, a functional annotation scheme for systematic clas-sification of proteins from whole genomes. Nucleic Acids Res. 32, 5539–5545. Segal, E., Raveh-Sadka, T., Schroeder, M., Unnerstall, U., Gaul, U., 2008. Predicting
ex-pression patterns from regulatory sequence in Drosophila segmentation. Nature 451, 535–540.
Segal, L., Lapidot, M., Solan, Z., Ruppin, E., Pilpel, Y., Horn, D., 2007. Nucleotide variation of regulatory motifs may lead to distinct expression patterns. Bioinformatics 23, i440–i449.
Shapira, M., Segal, E., Botstein, D., 2004. Disruption of yeast forkhead-associated cell cycle transcription by oxidative stress. Mol. Biol. Cell 15, 5659–5669.
Sreenivas, A., Carman, G.M., 2003. Phosphorylation of the yeast phospholipid synthesis regulatory protein Opi1p by protein kinase A. J. Biol. Chem. 278, 20673–20680. Steber, C.M., Esposito, R.E., 1995. UME6 is a central component of a developmental
reg-ulatory switch controlling meiosis-specific gene expression. Proc. Natl. Acad. Sci. U. S.A. 92, 12490–12494.
Storey, J.D., Tibshirani, R., 2003. Statistical significance for genomewide studies. Proc. Natl. Acad. Sci. U.S.A. 100, 9440–9445.
Swamy, K.B., Cho, C.Y., Chiang, S., Tsai, Z.T., Tsai, H.K., 2009. Impact of DNA-binding po-sition variants on yeast gene expression. Nucleic Acids Res.
Tanay, A., 2006. Extensive low-affinity transcriptional interactions in the yeast genome. Genome Res. 16, 962–972.
Torkamani, A., Schork, N.J., 2008. Predicting functional regulatory polymorphisms. Bio-informatics 24, 1787–1792.
Tsai, H.K., Chou, M.Y., Shih, C.H., Huang, G.T., Chang, T.H., Li, W.H., 2007. MYBS: a com-prehensive web server for mining transcription factor binding sites in yeast. Nucleic Acids Res. 35, W221–W226.
Tsai, H.K., Lu, H.H., Li, W.H., 2005. Statistical methods for identifying yeast cell cycle transcription factors. Proc. Natl. Acad. Sci. U.S.A. 102, 13532–13537.
Williams, K.E., Cyert, M.S., 2001. The eukaryotic response regulator Skn7p regulates calcineurin signaling through stabilization of Crz1p. EMBO J. 20, 3473–3483. Yoshimoto, H., et al., 2002. Genome-wide analysis of gene expression regulated by the
calcineurin/Crz1p signaling pathway in Saccharomyces cerevisiae. J. Biol. Chem. 277, 31079–31088.