科技部補助專題研究計畫成果報告
期末報告
管理者過度自信之策略影響
計 畫 類 別 : 個別型計畫 計 畫 編 號 : MOST 103-2410-H-004-100-執 行 期 間 : 103年08月01日至104年09月30日 執 行 單 位 : 國立政治大學經濟學系 計 畫 主 持 人 : 何靜嫺 計畫參與人員: 博士班研究生-兼任助理人員:傅中原 處 理 方 式 : 1.公開資訊:本計畫涉及專利或其他智慧財產權,2年後可公開查詢 2.「本研究」是否已有嚴重損及公共利益之發現:否 3.「本報告」是否建議提供政府單位施政參考:否中 華 民 國 104 年 11 月 23 日
中 文 摘 要 : 本計畫首先以一寡佔數量模型分析當其中一位管理者為過度自信時, 該廠商可能採取一先佔性的高產量. 當面臨需求變動時(正向或負向 ), 由自信管理者所管理的廠商所面臨的衝擊較大. 其次, 本計畫以 美國2008-2012年(全球金融危機)之廠商別資料, 以選擇權來衡量過 度自信, 實證結果發現, 約53.05%的有效樣本歸類為過度自信. 我 們進一步將樣本區分為新舊兩群:舊的自信管理者指的是那些已經 於1993-2003 被Hirshleifer et al. (2012)歸類為過度自信的管理 者, 而新的自信管理者指的是那些於蕭條時期新產生的自信管理者. 結果發現, 不同於Hirshleifer et al 的結果, 本計畫發現股票波 動性和管理者過度自信在全球金融危機期間為負相關, 此外, 管理 者過度自信在三各面向的廠商績效評量部分均有正的影響:獲利率 (靜態), 股票波動性(穩定)及銷售成長(動態). 中 文 關 鍵 詞 : 管理者過度自信, 策略影響, 蕭條
英 文 摘 要 : Our paper presents a simple Cournot model where one of the two managers overestimates the market demand. We
demonstrate that the firm run by overconfident manager can pre-dominate the market by producing a large amount of output. When there is a demand shock (positive or
negative), the positive or negative impact will be higher with the firm operated by an overconfident manager. Next, we analyses the firm-level data of U.S.A. during the 2008-2012 global financial crisis. According to the “options exercise measure“ for managerial overconfidence, 2634 CEOs, 53.05% of the effective samples, are classified as “overconfident“. Our research further considers two subgroups: Old overconfident CEOs who were already classified as overconfident during 1993-2003, and New overconfident CEOs who only emerge as overconfident CEOs during 2008-2012. The Old overconfident CEOs are defined so that we can investigate the fame effect of overconfidence, and make a comparison to Hirshleifer et al. (2012) who conclude that stock return volatility is positively related to managerial overconfidence during 1993-2003, while our results suggests that stock return volatility is negatively related to managerial overconfidence during the global financial crisis. Overall, our results identify positive strategic impacts of managerial overconfidence on three aspects of performance: profitability (static), stock return volatility (stability) and sales growth (dynamic). 英 文 關 鍵 詞 : Overconfident CEOs, Strategic impacts, Recession.
Strategic Impacts of Managerial Overconfidence in
Bad Times
∗
Chung Yuan Fu
Department of Economics
National Chengchi University
Shirley J. Ho
Department of Economics
National Chengchi University
November 23, 2015
JEL classification: G21, O16.
Keywords: Overconfident CEOs, Strategic impacts, Recession.
1
Introduction
Overconfidence or overoptimistism has been called the most pervasive and potential catastro-phe of all cognitive biases to which human beings fall victim (Plous, 1993).1 When an agent’s subjective judgment is better than objective evaluation, the decision based on this illusive belief can also be biased (see Harvey (1997), Hoffrage (2004) and Alicke and Govorun (2005) for reviews ). Despite of these negative impressions, in business practices firms often employ overconfident managers and let them follow their biased beliefs in making major investment and financing decisions (Malmendier and Tate (2005, 2008) and Ben-David, Graham, and Harvey (2010)).
One possible reason for hiring overconfident managers comes from the strategic impacts that they can create within market competition. For example, in Cournot competition an overconfident manager who overestimates the market demand can pre-dominate the market by producing a large amount of output2 (see also Englmaier, 2004). This bias in produc-tion, however, is not necessarily an advantage once we consider market or cost uncertainty. As demonstrated in the first part of our paper, when the market demand falls short of ex-pectation, the negative impact will be higher with the firm operated by an overconfident manager.
Therefore, to measure the overall effect of managerial overconfidence, one needs to com-bine both the positive strategic impact and the negative or positive impact from demand shock, and the relative sizes of these two possibly conflicting forces depend on the mar-ket environment and various firm-specific conditions. Since the positive strategic impact is partly or fully absorbed by negative demand shock in bad times, if we can still observe a 1It has been blamed for lawsuits, strikes, wars, and stock market bubbles and crashes (Thompson and
Loewenstein, 1992; Babcock and Olson, 1992).
2Our main results remain the same within price competition. Our focus on the strategic impact of
managerial overconfidence is different from recent theories by Goel and Thakor (2008), Gervais, Heaton, and Odean (2011).
positive relationship between managerial overconfidence and firm performance, then it will constitute a strong evidence for the presence of positive strategic impact from managerial overconfidence and hence provide a justification for hiring overconfident managers.
This motivates the empirical research in the second part of our paper, which focuses on the strategic impacts of managerial overconfidence during the global financial crisis of 2008-2012.
Many interesting papers in corporate finance have studied how managers’ overconfidence affects various corporate decisions including leverage, mergers, R&D and investments, and their relative performance (Bertrand and Schoar, 2003; Baker, Pan, and Wurgler, 2009; Slothouber, 2010; Stechyshyna, 2012). Their results are inconclusive about whether over-confident CEOs can bring in better or worse corporate performance.
On the negative side, it is believed that overconfident CEOs overestimate benefits and underestimate costs of investments, which result in inaccurate forecasts, distorted corpo-rate investments (Heaton, 2002; Malmendier and Tate, 2005; Doukas and Petmezas, 2007; Glaser et al., 2008) and low-quality acquisitions (Jensen and Ruback, 1983; Roll, 1986; Hay-ward and Hambrick, 1997; Rau and Vermaelen, 1998; Andrade and Stafford, 2004; Moeller, Schlingemann and Stulz, 2005; Gombola and Marciukaityte, 2007; Malmendier and Tate, 2008). In a financial market context, Benos (1998), Daniel, Hirshleifer and Subrahmanyam (1998), and Odean (1998) show theoretically that overconfidence leads to poor performance. Gombola and Marciukaityte (2007) use managerial overoptimism to explain poor long-term stock performance following stock and bond issuance. Niu (2010) shows that banks with overconfident CEOs take greater risks than their peer institutions, and top-performing mu-tual fund managers tend to trade more following success and exhibit worse performance when they do so (Puetz and Ruenzi, 2011).
On the positive side, the literature contends that overconfidence can help leaders to achieve corporate goals (Hiller and Hambrick, 2005), see problems as challenges as well
as opportunities and search for and appreciate the positive aspects of difficult situations (Tombaugh, 2005; Li and Tang, 2010). Moreover, Van den Steen (2005) shows that man-agerial overconfidence also serves as a commitment device, that helps attract and retain similarly minded employees. Gervais, Heaton, and Odean (2009) present a model in which overconfidence can increase value by mitigating moral hazard and aligning incentives. Gra-ham, Harvey, and Puri (2010) provide evidence of a matching of growth firms with more confident managers.
Our paper contributes to the literature on managerial overconfidence by demonstrating the interaction between the negative impacts from cognitive biases and demand shock and the positive strategic impacts in a simple Cournot model. Then, by using the firm-level data of U.S.A. during the 2008-2012 global financial crisis, we identify the positive strategic impact of managerial overconfidence on three aspects of performance: profitability (static), stock return volatility (stability) and sales growth (dynamic).
Following Malmendier and Tate (2005a), Campbell et al. (2011) and Hir74411shleifer et al. (2012), we adopt the "options exercise measure" for managerial overconfidence, by calculating the average moneyness of the CEO’s option portfolio for each year. Hirshleifer et al. (2012) conclude that overconfident managers are better innovators, as a possible solution to the overconfident manager puzzle. Our paper suggests that this general effect of managerial overconfidence on innovation should be decomposed into two forces: the positive strategic impact and the positive impact from demand increase during 1993-2003.3 Our sampling period covers the 2008-2012 global financial crisis. Since in bad times the positive strategic impact is partly or fully absorbed by negative demand shock, if we can still observe a positive relationship between managerial overconfidence and firm performance, then it will constitute a strong evidence for the presence of positive strategic impact from managerial overconfidence.
Our model is closely related to Krahmer (2003), Englmaier (2006), Rozanova (2010) and Khachatryan (2011) in addressing managers’ overconfidence in market competition. With ownership and management separated, Englmaier (2006) and Rozanova (2010) study strategic delegation (see Fershtman and Judd, 1987), considering that managers might be overconfident. Englmaier (2006) shows that it can be profitable for the firms to delegate cost-reducing investment decision to the overconfident managers. Rozanova (2010) further considers that the cost-reducing R&D levels are endogenously determined by managers. Khachatryan (2011) assumes that managers who own and operate the firms might have asymmetric beliefs about the extent of product differentiation. Differently, we assume that managers in have asymmetric beliefs about the market demand instead of the degree of product differentiation. With this setup, we are able to decompose the general effect to two parts: the positive strategic impact and the positive or negative impact from demand shock. The negative impact of cognitive biases will be internalized in the equilibrium.
The remainder of the paper is organized as follows. Section 2 presents a simple Cournot model where one of the two managers overestimates the market demand. We demonstrate that the firm run by overconfident manager can pre-dominate the market by producing a large amount of output. When there is a demand shock (positive or negative), the positive or negative impact will be higher with the firm operated by an overconfident manager. In Section 3, we analyses the firm-level data of U.S.A. during the 2008-2012 global financial cri-sis. According to the "options exercise measure" for managerial overconfidence, 2634 CEOs, 53.05% of the effective samples, are classified as "overconfident". Our research further con-siders two subgroups: Old overconfident CEOs who were already classified as overconfident during 1993-2003, and New overconfident CEOs who only emerge as overconfident CEOs during 2008-2012. The Old overconfident CEOs are defined so that we can investigate the fame effect of overconfidence, and make a comparison to Hirshleifer et al. (2012) who con-clude that stock return volatility is positively related to managerial overconfidence during
1993-2003, while our results suggests that stock return volatility is negatively related to man-agerial overconfidence during the global financial crisis. Overall, our results identify positive strategic impacts of managerial overconfidence on three aspects of performance: profitabil-ity (static), stock return volatilprofitabil-ity (stabilprofitabil-ity) and sales growth (dynamic). Section 4 is the concluding remarks.
2
The Model
We now examine the impacts of managers’ cognitive bias in a Bertrand duopoly model with differentiated products. We assume the following linear demand functions for tractability.
= − + for 6= .
The demand of each product is affected by its own price and the opponent’s price . The own price effect is normalized to be one, and the cross price effect is measures the correlation of the two products. If 0 then the two products are substitutes. As increases, the demand for product decreases, and consumers replace product with product , hence increases. Similarly, if 0 then the two products are complements.
To examine managers’ cognitive bias, we assume that when each manager is making his production decision, the market demand is uncertain. Let denote manager ’s belief about and let denote the respective expected value. To simplify, we assume that is known by the rival firm and that manager 1 is more optimistic than manager 2. That is, 1 2
An alternative explanation for this assumption is that manager 1 is more confident than manager 2, in the sense that manger 1 is certain that the expected demand is 1 while manager 2 thinks that the expected demand lies in the range [1 − 1 + ] To avoid excess capacity, manager 2 chooses his output and capacity level according to the minimum expectation 2 ≡ 1− , where 1 2
The timing of the game is given as follows. At first, the two managers simultaneously choose their capacity (and hence outputs) based on their own beliefs about demand. The demand uncertainty is released later, and each firm’s profit is determined by the realized demand and the two firms’ outputs determined before the realization of demand uncertainty.
(a) Price Decisions Manager chooses the price to maximize firm i’s expected profit
:
= (− + )(− ) = 1 2.
where is firm ’s marginal cost for production. The actual sale will depend on the real demand , rather than manager ’s expectation demand .
The first order condition4 of maximization is:
= − 2+ + = 0 = 1 2. The equilibrium prices are
1 = 2(1+ 1) + (2+ 2) 4− 2 2 = 2(2+ 2) + (1+ 1) 4− 2 Since 1 2 we have 1 2
Proposition 1 Under price competition, more confidence charges a higher price irrespective of whether the products are imperfect substitutes or imperfect complements.
More confidence entails more aggressive play irrespective of whether the products are imperfect substitutes or imperfect complements.
(b) Sales and Profits Given the realized demand firm ’s realized sale is given by: = (− + )( ) = 1 2
Since the overconfident manager charges a higher price, his output is lower. However, the two firms’ relative sales depend on the actual demand :
1− 2 = ( 1− 2)[− 1− 2]≶ 0 When is sufficiently low during the financial crisis, i.e.,
1+2then the realized sale for overconfident manager could be lower. As demonstrated in Table 4 in Appendix, the average sale for managers who emerge as overconfident CEOs during 2008-2012 is significantly lower than that for non-overconfident managers.
Next, the two firms’ relative profits will depend on the degree of substitution between the two outputs. Given the realized demand firm ’s realized profit is given by:
= (− + )( − ) = 1 2 From the first order condition,
− = − + We can rewrite the realized profit as = (− + )2 = 1 2
First of all, it is easy to demonstrate that (1− 2)is decreasing in : ( 1− 2) = 2(− 1+ 2) 2− 2( − 2+ 1) 1 = 2( 2− 1) 0
Second, when the two products are perfect substitutes ( = 1)
1 2. To see this, let = 1 and ≡
1 − 2 0 Then 1 = (− )(1 − ) and 2 = ( + )(2 + ) Since (2 − 1) + (2 + 1 + 2) 0, we have 2 1 Third, when when the two products are perfect complements ( = −1)
1 2. To see this, let = −1 and ≡ 1 + 2 0 Then
1 = (− )(1 − ) and 2 = (− )(2 − ) It is easy to see that 1 2. Hence there exists a critical degree of substitution ∗ such that for ∗ 2 1 and for
∗
1 2. As demonstrated in Table 4 in Appendix, the average profit for managers who emerge as overconfident CEOs during 2008-2012 is significantly higher than that for non-overconfident managers.
Moreover, Bartram and Bodnar (2009) suggest that all indices fall about 30—40 % in the period of mid-September to the end of October 2008. Johansson (2011) finds that the spread of the subprime mortgage crisis affects European markets more than the Asian markets. We want to know how this sudden drop in demand affects the strategic impacts of managerial overconfidence. From
=
−we know that the marginal impact of demand uncertainty depends on the size of price margin. With symmetric costs (i.e., 1 = 2), we have a result similar to Proposition 3. That is, let 4 indicate the demand change.
Proposition 2 If 4 0 the positive impact is higher with firm operated by overconfident manager. If 4 0 the negative impact is also higher with firm operated by overconfident manager.
Although the overconfident manager will be more affected by the negative demand shock, the overall impact of overconfidence should combine both the positive strategic impact and the negative impact from demand shock.
Finally, firm activities such as investment can also be affected by managerial overconfi-dence. For simplicity, denote as firm ’s investment on capacity. The level of capacity is to accomondate firm’s production level, which is determined in the duopoly market. The expected demand is given by
= − − for 6= .
Here, the own price effect is normalized to be 1, and the cross price effect is which measures the correlation of the two products. To simplify, we assume that is known by the rival firm and that manager 1 is more optimistic than manager 2 with 1 2
Manager chooses the capacity to maximize firm i’s expected profit:
= (− − )− = 1 2.
where is firm ’s marginal capital cost. Then, by the first order condition of maximization, we have
= − 2− − = 0 = 1 2. The equilibrium output capacities are
1= 2(1− 1)− (2− 2) (4− 2) and 2 = 2(2− 2)− (1− ) (4− 2)
Since 1 2 we have 1 2 As demonstrated in Table 4 in Appendix, the average investment for managers who emerge as overconfident CEOs during 2008-2012 is significantly higher than that for non-overconfident managers.
3
Data and Descriptive Statistics
We test the relation between managerial overconfidence and firm performance, using the firm-level data of U.S.A. during the 2008-2012 global financial crisis. Figure 1 shows the pattern of real GDP (i.e., gross domestic product (GDP) divided by inflation rate) during this period.5 Real GDP starts to decline during the subprime mortgage crisis and rises back to the 2007 level only from 2012. The sample consists of all non-financial and non-utility firms in Execucomp from 2008 to 2012, and the procedure for data collection is provided in Appendix.
5http://www.bea.gov/National/index.htm
69.83775598 68.37015741 67.20472459 68.5987480269.05783346 70.75359112 65 66 67 68 69 70 71 72 2007 2008 2009 2010 2011 2012 Figure 1. GDP/inflation rate of USA
We measure firm performance from three aspects: static (profitability), stability (stock return volatility) and dynamic (sales growth), and we will adopt the "options exercise measure" for managerial overconfidence. We retrieve the accounting data from Compustat, stock return data from CRSP, and managerial compensation data from Execucomp.
3.1
Firm Performance
Following the literature, we measure firm performance from three aspects: static (profitabil-ity), stability (stock return volatil(profitabil-ity), and dynamic (sales growth). The detailed descriptions and the related literature are provided in Table 1.
These three variables will be the dependent variables in the regressions between firm performance and managerial overconfidence and other firm characteristics. The stock return volatility is the standard deviation of daily stock returns during the fiscal year, and we use this term to measure firm’s stability in performance.
For consistency, all dependent and explanatory variables are measured in percentages, hence profitability is divided by the lagged total assets. We use a "lagged" term to mitigate the endogeneity problem in the production process.
TABLE 1 FIRM PERFORMANCE FROM 3 ASPECTS. FIRM PERFORMANCE DESCRIPTION DATA SOURCE PROFITABILITY Earnings before interest, taxes, and depreciation divided by lagged total assets. 1. Huang and Kisgen (2012): “earnings before interest, taxes, and depreciation divided by lagged total assets” (item 13). 2. Malmendier et al. (2007): ”operating income before depreciation” (item 13). 3. Malmendier and Zheng (2012): ”operating profit (item 13) / lagged assets” (item 6). Compustat STOCK RETURN VOLATILITY Standard deviation of daily stock returns over the year 1. Hirshleifer et al. (2012): ”Standard deviation of daily stock returns over the year”. CRSP SALES GROWTH The 3‐year least squares annual growth rate of Sales. 1. Ahmed and Duellman (2013): ”Percentage of annual growth in total sales for the fiscal year.” 2. Hirshleifer et al. ( 2012): ”Log transformation of sales divided by prior year sales” Execucomp
3.2
Dummy Variables for Overconfidence
The literature has proposed three measurements for overconfidence: the first and second by Malmendier and Tate (2005) and Jin and Kothari (2008), and the third by Ben-David, Graham, and Harvey (2007). First, Malmendier and Tate (2005) classifies managers as overconfident if they overexpose themselves to the idiosyncratic risk of their firms. They classify CEOs as overconfident if they exercise options later than the optimal date, hold their options until expiration, or increase their holdings of company stock. Second, Malmendier and Tate (2005) and Jin and Kothari (2008) propose a press-based measure, as it does not suffer from the same endogeneity and omitted variable explanations as the equity-based measure of overconfidence. Third, Ben-David, Graham, and Harvey (2007) measure the confidence bounds that executives provide when asked to estimate the future performance of a stock index. Overconfidence can then be defined as having too narrow of confidence intervals relative to the historical distribution (i.e. variance) of the stock index.
It is important to recognize the difference in the notion of overconfidence examined in Malmedier and Tate (2005) and Jin and Kothari (2008) versus Ben-David et al. (2007).
Malmedier and Tate (2005, 2008) are motivated from the “better than average” effect, where individuals over-estimate their acumen relative to others. This upward bias in the assessment of future events is also referred to as over-optimism, although we retain the term overconfidence for consistency with the finance literature. In contrast, Ben-David et al. (2007) define overconfidence as too narrow confidence intervals when predicting probabilistic events, regardless of whether the expectation is biased or not.
TAB LE 2 D U M M Y VA RIA LB ES FO R M A N A G ERIA L OV ERCO N FID EN CE
OV ERCO N FID EN T CEO s DESCRIPTIO N DATA SO U RC E CO N FIDEN T =1, if a CEO holds options that are at least 67 % in the‐m on ey
in any year during 2008‐201 2.
=0, if otherw ise.
Execucom p
O LD CO N FID EN T =1, if a CEO w ho is overconfident (during 2008‐2 012), also
holds options that are at lea st 67% in the‐m oney in any year during 1993‐2003. =0, if a CEO is not confident. Execucom p N EW CO N FIDEN T
=1, if a CEO w ho is overconfident (during 2008‐2012), but
does not hold options that are at least 67% in the‐
m oney in any year during 1993‐200 3.
=0, if a CEO is not confident.
Execucom p
SU RVIVO R CO N FIDEN T =1, if a CEO w ho is overconfident (during 2008‐2 012), also
holds options that are at lea st 67% in the‐m oney in any year during 1993‐2003.
=0, if a CEO w ho is overconfident (during 2008‐2012), but
does not hold options that are at least 67% in the‐
m oney in any year during 1993‐200 3.
Execucom p
Hence, for our purpose we will use the first measurement. Following Malmendier and Tate (2005) and Hirshleifer et al (2012), we calculate an average moneyness of the man-ager‘s option portfolio for each year. Table 2 gives the detailed description for four dummy variables of managerial overconfidence. First, a manager is classified as overconfident if the average moneyness is at least 67% in any year during 2008-2012. According to the "op-tions exercise measure" for managerial overconfidence, 2634 CEOs, 53.05% of the effective samples, are classified as "overconfident". Our research further considers two subgroups: Old overconfident CEOs who were already classified as overconfident during 1993-2003, and
Old overconfident CEOs are defined so that we can investigate the fame effect of overconfi-dence, and make a comparison to Hirshleifer et al. (2012) who conclude that stock return volatility is positively related to managerial overconfidence during 1993-2003, while our re-sults suggests that stock return volatility is negatively related to managerial overconfidence during the global financial crisis. Finally, the dummy variable "Survivor Overconfident" is defined so we can compare these two groups. The value for this dummy is one if he is an Old CEO, and 0 if he is a new CEO. Tables 2-A~2-D give the yearly breakdown of the number of CEOs, old CEOs, new CEOs and the number of old CEOs vs new CEOs.
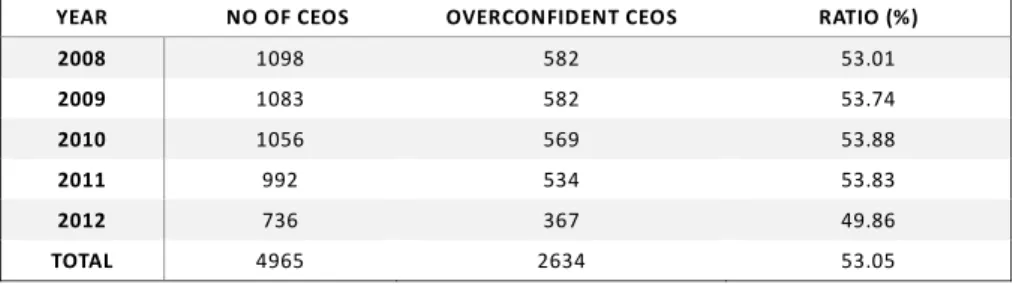
Table 2‐A Overconfident CEOs during 2008‐2012
Table 2‐A gives the yearly breakdown of the number of CEOs, number of overconfident CEOs, and percentage of overconfident CEOs in our sample.
YEAR NO OF CEOS OVERCONFIDENT CEOS RATIO (%)
2008 1098 582 53.01 2009 1083 582 53.74 2010 1056 569 53.88 2011 992 534 53.83 2012 736 367 49.86 TOTAL 4965 2634 53.05 Table 2‐B Old Overconfident CEOs during 2008‐2012. Table 2‐B gives the number of old overconfident CEOs and non‐overconfident CEOs, and percentage of old overconfident CEOs and non‐overconfident CEOs in our sample.
YEAR NO OF CEOS OLD OVER‐ CONFIDENT CEOS RATIO (%) NON‐ OVERCONFIDENT CEOS RATIO (%) 2008 822 306 37.22 516 62.77 2009 775 274 35.35 501 64.64 2010 734 247 33.65 487 66.34 2011 668 210 31.43 458 68.56 2012 508 139 27.36 369 72.63 TOTAL 3507 1176 33.53 2331 66.46
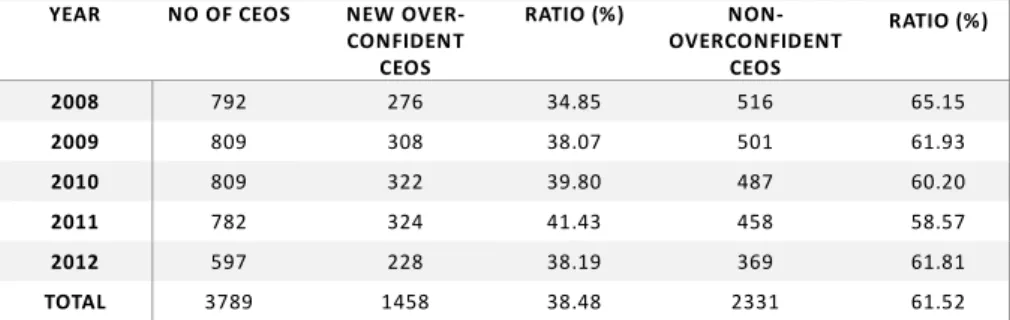
Table 2‐C New Overconfident CEOs during 2008‐2012.
Table 2‐C gives the number of new CEOs and non‐overconfident CEOs, and percentage of new overconfident CEOs and non‐overconfident CEOs in our sample.
YEAR NO OF CEOS NEW OVER‐
CONFIDENT CEOS RATIO (%) NON‐ OVERCONFIDENT CEOS RATIO (%) 2008 792 276 34.85 516 65.15 2009 809 308 38.07 501 61.93 2010 809 322 39.80 487 60.20 2011 782 324 41.43 458 58.57 2012 597 228 38.19 369 61.81 TOTAL 3789 1458 38.48 2331 61.52 Table 2‐D Survivor Overconfident CEOs Table 2‐D gives the number of old CEOs and new CEOs, and percentage of overconfident survival and new CEOs in our sample.
YEAR NO OF CEOS SURVIVOR OVERCONFIDENT CEOS RATIO (%) NEW OVER‐ CONFIDENT CEOS RATIO (%) 2008 582 306 52.58 276 47.42 2009 582 274 47.08 308 52.92 2010 569 247 43.41 322 56.59 2011 534 210 39.33 324 60.67 2012 367 139 37.87 228 62.13 TOTAL 2634 1176 44.65 1458 55.35
3.3
Firm Characteristics
When explaining firms’ performance, we include control variables describing firms’ charac-teristics from supply side (firm size and capital intensity), financial condition (book leverage and cash holding), market valuation (stock return and Tobin’s Q). The detailed definition and related literature for each variable are given in Table 3. Capital intensity is approxi-mated by the natural logarithm of the ratio of net property, plant, and equipment in 2006 dollars to the number of employees (i.e., PPE / EMP). All the regressions include year and industry fixed effects, where the industry is defined at the two-digit SIC level.
TABLE 3 FIRM CHARACETERISTICS VARIABLES DESCRIPTION DATA SOURCE STOCK RETURN Buy‐and‐hold return over the fiscal year 1. Hirshleifer et al. (2012): “Buy‐and‐hold return over the fiscal year” CRSP SIZE Natural logarithm of Total assets 1. Ahmed and Duellman (2013): “Natural log of average total assets at the end of the fiscal year“. 2. Huang and kisgen (2012): “The sum of market capitalization (item 199 * item 25) and book value of total debt (item 9 +item 34)“. 3. Malmendier and Tate (2005). 4. Brown and Sarma (2007): “Natural logarithm of book value of assets“. 5. Deshmukh et al. (2013): “Natural logarithm of sales“. Compustat SALES Firm sales in millions 1. Hirshleifer et al. (2012): “Firm sales in millions“. 2. Galasso and Simcoe (2011), Malmendier and Zheng (2012) : “Sales“. Execucomp PPE/EMP Net property, plant, and equipment per employee 1. Hirshleifer et al. (2012). Execucomp LEVERAGE Long‐term debt plus debt in current liabilities over long‐term debt plus debt in current liabilities plus the book value of common equity 1. Hirshleifer et al. (2012): “Ratio of sum of long‐term debt and short‐term debt to book asset“. 2. Ahmed and Duellman (2013): “Total liabilities divided by total assets at the end of the fiscal year“. 3. Huang and Kisgen (2012): “Long term debt (item 9) plus debt in current liabilities (item 34) over long term debt plus debt in current liabilities plus the book value of common equity (item 60) plus preferred stock liquidating value (item 10) minus deferred taxes and investment tax credits (item 35)“. 4. Kolasinski and Li (2013): “The ratio of the firm’s total debt plus minimum non‐ capitalized lease commitments over the next five years to total assets, as of the beginning of the year, based on Compustat“. 5. Bertrand and Schoar (2003): “Long‐term debt (COMPUSTAT item 9) plus debt in current liabilities (COMPUSTAT item 34) over long‐term debt plus debt in current liabilities plus the book value of common equity (COMPUSTAT item 60)“. 6. Deshmukh et al. (2013):“The ratio of long‐term debt to book value of assets “. 7. Malmendier et al. (2007): “The quantity debt in current liabilities (data 34) plus long term debt (item 9) divided by the quantity debt in current liabilities (data 34) plus long term debt (item 9) plus common equity (item 60)“. 8. Malmendier and Zheng (2012) Compustat CASH HOLDING Cash and short‐term investments over net property, plant, and equipment at the beginning of the fiscal year 1. Huang and Kisgen (2012): “Cash and short‐term investments (item 1) over assets at the beginning of the fiscal year”. 2. Hirshleifer et al. (2012): “Ratio of cash to book assets”. 3. Bertrand and Schoar (2003): “Cash and short‐term investments (COMPUSTAT item 1) over net property, plant, and equipment at the beginning of the fiscal year (COMPUSTAT item 8)” . Compustat TOBIN Q Ratio of market value to book value of assets 1. Malmendier and Tate (2005), Malmendier et al. (2007), Brown and Sarma (2007), Hirshleifer et al. (2012), Huang and Kisgen (2012: “Ratio of market value to book value of assets“. 2. Kolasinski and Li (2013): “The beginning of year ratio of market capitalization plus book liabilities to book assets, based on Compustat“. 3. Malmendier and Zheng (2012): “(assets (item 6) + price (item 199) * common shares outstanding (item 25) – common equity (item 60) ‐ balance sheet deferred taxes and investment tax credit (item 35)) / assets (item 6)“. Compustat
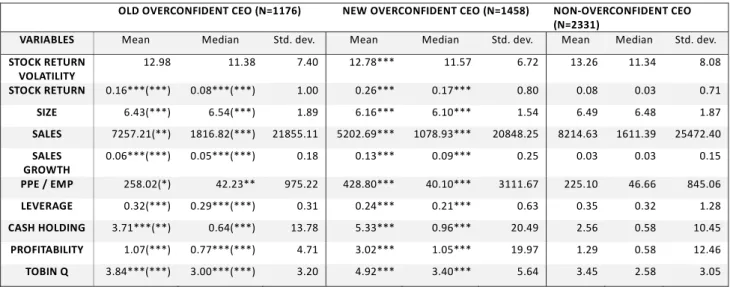
Table 4 in Appendix gives the means and medians of the control variables used in this study. CEOs are classified into three groups: old overconfident, new overconfident and non-confident. In order to test the differences between the two sides of each dummy variable, we present the Wilcoxon rank sum tests (T-tests) where *, **, and *** measure significance at the 10%, 5%, and 1% level, respectively. In the first column, old overconfident CEOs are compared to both non-confident CEOs and new overconfident CEOs, and the notions in (. ) indicate the significance for the difference between old overconfident CEOs and new overconfident CEOs (i.e., the dummy Survivor Overconfident). In the second column, new overconfident CEOs are tested against non-confident CEOs.
4
Results
We examine the impacts of managerial overconfidence on firm performance from three di-mensions: static, stability and dynamic. Profitability is the earnings before interest, taxes, and depreciation divided by lagged total assets over the fiscal year. Stock return volatility is the standard deviation of daily stock returns over the fiscal year, in percentage. Sales growth is the 3-year least squares annual growth rate of sales over the fiscal year.
Tables 5~7 present the regression results for the whole sample (group (1)) and three subgroups (groups (2)~(4)). Group (1) consists of the whole sample, and we use the dummy variable CONFIDENT to distinguish CEOs who hold options that are at least 67% in the-money in any year during 2008-2012 from those who are non-overconfident during 2008-2012. Group (2) consists those who are overconfident during both 2008-2012 and 1993-2003 periods, and those who are non-overconfident. We use the dummy variable OLD CONFIDENT to distinguish the CEOs that are overconfident for both periods from those who are non-overconfident during 2008-2012. Group (3) consists of those CEOs who are non-overconfident only during 2008-2012 and those who are non-overconfident. The dummy variable NEW
who are non-overconfident during 2008-2012. Finally, group (4) consists of all overconfident CEOs, and the dummy variable SURVIVOR CONFIDENT distinguishes the CEOs who are overconfident for both periods from those who are overconfident only during 2008-2012. The difference between groups (2) and (4) is that: OLD CONFIDENT=0 indicates those who are non-overconfident during 2008-2012, while SURVIVOR CONFIDENT=0 indicates those who are overconfident only during 2008-2012.
The regression equations are defined as follows: performance = + +
P
+
We consider static, stability and dynamic performances as dependent variables: profitability, stock return volatility and sales growth. The independent variables are the overconfident dummies for groups (1)~(4) are CONFIDENT, OLD CONFIDENT and NEW CONFIDENT and SURVIVOR CONFIDENT, respectively, and firm characteristics variables described in Table 3. All independent variables are lagged by one year to indicate that the current equilibrium is determined by the supply side conditions (firm size and capital intensity), financial conditions (book leverage and cash holding) and market valuation conditions (stock return and Tobin’s Q) from the previous time. To be consistent, all independent variables are scaled to have zero mean and standard deviation of one. All regressions include year and industry fixed effects, defined based on 2-digit SIC codes.
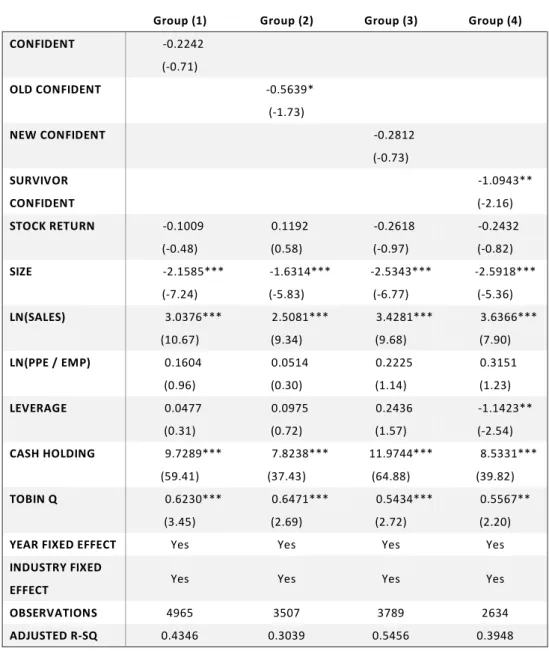
The results show that overconfident CEOs have significantly better stability and dy-namic performances, but not in static performance. Table 5 shows that the overconfident dummy coefficients are significantly negative in groups (2) and (4). That is, compared to non-overconfident and new overconfident CEOs, old overconfident CEOs are actually neg-atively related to firm’s profitability. One possible reason for this (from our model) that younger overconfident CEOs are more optimistic than those CEOs who have been classified as overconfident during 1993-2003, and hence produce less than the old overconfident CEOs would do. Researches in the management and psychology often report that younger people
are more overconfident (Taylor, 1975; Kovalchik, Camerer, Grether, Plott, and Allman,2005; Forbes, 2005). Although our model shows that the firms run by younger overconfident CEOs should suffer more in a negative demand shock, when the product substitution is sufficiently low, there can be a positive strategic impact from charging a higher price. The old over-confident CEOs, by producing intermediate levels (more than nonover-confident CEOs, but less than new CEOs), does not enjoy the benefit from higher price but suffer a stronger negative impact than the nonconfident CEOs.
Table 6 shows that the overconfident dummy coefficients are significantly negative on stock return volatility in all but group (4). Stock return volatility is often used to measure firm’s risk taking behavior, and many researches report that overconfident CEOs tend to be more risk taking (e.g. Hirshleifer et al. (2012)). Chatterjee and Hambrick (2007) investi-gate the effect of CEO narcissism on firm performance, but only in terms of performance “extremeness.” The authors were able to show that narcissistic CEOs exhibit greater per-formance volatility, but not better or worse perper-formance. Our results suggest the opposite for firms in bad times. Moreover, results in groups (2) and (3) show that new overconfident CEOs are actually less risk taking than old overconfident CEOs (−00082 vs −00068).
There can be different explanations for this. First, due to over-investment, the optimistic CEOs can create an economy of scale effect on financial funding and production cost, which balances the negative impacts from demand shock during the financial crisis. Compared to small scaled firms, the firms run by overconfident CEOs have better chance to survive in bad times. Second, since stock price is most affected by investors’ beliefs about future returns, over-investment can become a signal for future revenue growth, and hence compared to smaller scaled firms, investors have more faith on firms run by overconfident CEOs.
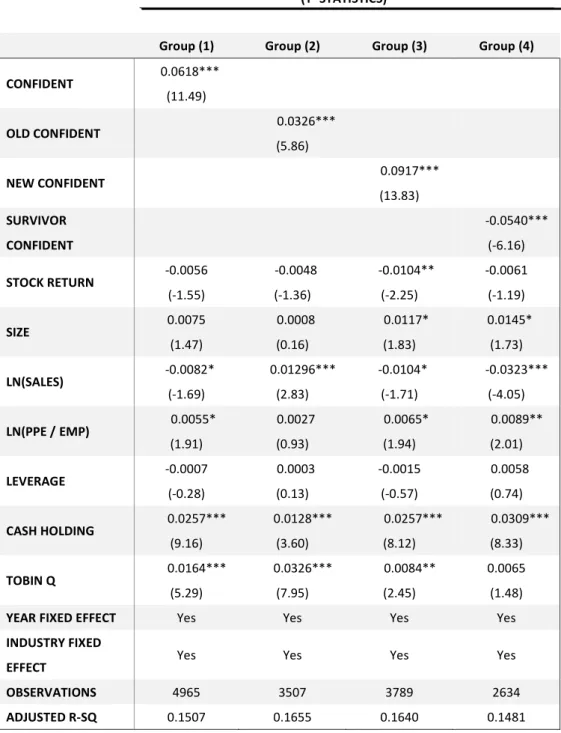
Moreover, Table 7 shows that the overconfident dummy coefficients are significantly pos-itive on sales growth in all but group (4). Although the static strategic impacts are not significant, the preemption effect and market scale effect from over production give the firms
run by overconfident CEOs better chances to survive and grow during the crisis. Compared to new overconfident CEOs, old overconfident CEOs actually do worse in dynamic perfor-mance (by −00540).
Table 5. Overconfident CEOs and Profitability
The table presents results of regressions of profitability on CEO overconfidence. Profitability is the earnings before interest, taxes, and depreciation divided by lagged total assets over the fiscal year. The overconfident dummies are CONFIDENT, OLD CONFIDENT, NEW CONFIDENT and SURVIVOR CONFIDENT, and independent variables are described in Table 3. All independent variables are lagged by one year. All continuous independent variables are scaled to have zero mean and standard deviation of one. All regressions include year and industry fixed effects, defined based on 2‐digit SIC codes. Standard errors are corrected for clustering of observations at the firm level (t‐ statistics are in parentheses). *, **, and *** measure significance at the 10%, 5%, and 1% level, respectively. PROFITABILITY (T‐ STATISTICS)
Group (1) Group (2) Group (3) Group (4) CONFIDENT ‐0.2242 (‐0.71) OLD CONFIDENT ‐0.5639* (‐1.73) NEW CONFIDENT ‐0.2812 (‐0.73) SURVIVOR CONFIDENT ‐1.0943** (‐2.16) STOCK RETURN ‐0.1009 (‐0.48) 0.1192 (0.58) ‐0.2618 (‐0.97) ‐0.2432 (‐0.82) SIZE ‐2.1585*** (‐7.24) ‐1.6314*** (‐5.83) ‐2.5343*** (‐6.77) ‐2.5918*** (‐5.36) LN(SALES) 3.0376*** (10.67) 2.5081*** (9.34) 3.4281*** (9.68) 3.6366*** (7.90) LN(PPE / EMP) 0.1604 (0.96) 0.0514 (0.30) 0.2225 (1.14) 0.3151 (1.23) LEVERAGE 0.0477 (0.31) 0.0975 (0.72) 0.2436 (1.57) ‐1.1423** (‐2.54) CASH HOLDING 9.7289*** (59.41) 7.8238*** (37.43) 11.9744*** (64.88) 8.5331*** (39.82) TOBIN Q 0.6230*** (3.45) 0.6471*** (2.69) 0.5434*** (2.72) 0.5567** (2.20)
YEAR FIXED EFFECT Yes Yes Yes Yes
INDUSTRY FIXED
EFFECT Yes Yes Yes Yes OBSERVATIONS 4965 3507 3789 2634
Table 6. Overconfident CEOs and stock return volatility
The table presents results of regressions of stock return volatility on CEO overconfidence. Stock return volatility is the standard deviation of daily stock returns over the fiscal year, in percentage. The overconfident dummies are CONFIDENT, OLD CONFIDENT, NEW CONFIDENT and SURVIVOR CONFIDENT, and independent variables are described in Table 3. All independent variables are lagged by one year. All continuous independent variables are scaled to have zero mean and standard deviation of one. All regressions include year and industry fixed effects, defined based on 2‐digit SIC codes. Standard errors are corrected for clustering of observations at the firm level (t‐statistics are in parentheses). *, **, and *** measure significance at the 10%, 5%, and 1% level, respectively. STOCK RETURN VOLATILITY (T‐ STATISTICS)
Group (1) Group (2) Group (3) Group (4) CONFIDENT ‐0.0075*** (‐4.11) OLD CONFIDENT ‐0.0068*** (‐2.89) NEW CONFIDENT ‐0.0082*** (‐3.67) SURVIVOR CONFIDENT 0.0036 (1.54) STOCK RETURN 0.0246*** (20.15) 0.0238*** (15.99) 0.0245*** (15.60) 0.0250*** (18.17) SIZE ‐0.0076*** (‐4.41) ‐0.0056*** (‐2.76) ‐0.0076*** (‐3.48) ‐0.0114*** (‐5.05) LN(SALES) ‐0.0147*** (‐8.90) ‐0.0171*** (‐8.84) ‐0.0158*** (‐7.66) ‐0.0089*** (‐4.17) LN(PPE / EMP) 0.0004 (0.42) ‐0.0017 (‐1.33) 0.0020* (1.80) 0.0000 (0.06) LEVERAGE 0.0036*** (4.04) 0.0040*** (4.16) 0.0023** (2.52) 0.0081*** (3.88) CASH HOLDING 0.0008 (0.86) ‐0.0023 (‐1.58) 0.0012 (1.15) 0.0022** (2.23) TOBIN Q ‐0.0114*** (‐10.85) ‐0.0174*** (‐10.05) ‐0.0111*** (‐9.55) ‐0.0084*** (‐7.17)
YEAR FIXED EFFECT Yes Yes Yes Yes
INDUSTRY FIXED
EFFECT Yes Yes Yes Yes OBSERVATIONS 4965 3507 3789 2634
Table 7. Overconfident CEOs and sales growth
The table presents results of regressions of sales growth on CEO overconfidence. Sales growth is the 3‐year least squares annual growth rate of sales over the fiscal year. The overconfident dummies are CONFIDENT, OLD CONFIDENT, NEW CONFIDENT and SURVIVOR CONFIDENT, and independent variables are described in Table 3. All independent variables are lagged by one year. All continuous independent variables are scaled to have zero mean and standard deviation of one. All regressions include year and industry fixed effects, defined based on 2‐digit SIC codes. Standard errors are corrected for clustering of observations at the firm level (t‐statistics are in parentheses). *, **, and *** measure significance at the 10%, 5%, and 1% level, respectively. SALES GROWTH (T‐ STATISTICS)
Group (1) Group (2) Group (3) Group (4)
CONFIDENT 0.0618*** (11.49) OLD CONFIDENT 0.0326*** (5.86) NEW CONFIDENT 0.0917*** (13.83) SURVIVOR CONFIDENT ‐0.0540*** (‐6.16) STOCK RETURN ‐0.0056 (‐1.55) ‐0.0048 (‐1.36) ‐0.0104** (‐2.25) ‐0.0061 (‐1.19) SIZE 0.0075 (1.47) 0.0008 (0.16) 0.0117* (1.83) 0.0145* (1.73) LN(SALES) ‐0.0082* (‐1.69) 0.01296*** (2.83) ‐0.0104* (‐1.71) ‐0.0323*** (‐4.05) LN(PPE / EMP) 0.0055* (1.91) 0.0027 (0.93) 0.0065* (1.94) 0.0089** (2.01) LEVERAGE ‐0.0007 (‐0.28) 0.0003 (0.13) ‐0.0015 (‐0.57) 0.0058 (0.74) CASH HOLDING 0.0257*** (9.16) 0.0128*** (3.60) 0.0257*** (8.12) 0.0309*** (8.33) TOBIN Q 0.0164*** (5.29) 0.0326*** (7.95) 0.0084** (2.45) 0.0065 (1.48)
YEAR FIXED EFFECT Yes Yes Yes Yes
INDUSTRY FIXED
EFFECT Yes Yes Yes Yes
OBSERVATIONS 4965 3507 3789 2634
It is then interesting to understand which firm activities overconfident CEOs engage more to result in better dynamic performance. In particular, we want to know whether overconfident CEOs still engage in innovation activities more during the financial crisis. We run the following regressions:
=b + b + P
b
+b
We consider three kinds of firm activities: investment, R&D and advertising. The inde-pendent variables are the overconfident dummies for groups (1)~(4) are CONFIDENT, OLD CONFIDENT and NEW CONFIDENT and SURVIVOR CONFIDENT, respectively, and firm characteristics variables described in Table 3. All independent variables are lagged by one year to indicate that the current equilibrium is determined by the supply side conditions (firm size and capital intensity), financial conditions (book leverage and cash holding) and market valuation conditions (stock return and Tobin’s Q) from the previous time. To be consistent, all independent variables are scaled to have zero mean and standard deviation of one. All regressions include year and industry fixed effects, defined based on 2-digit SIC codes.
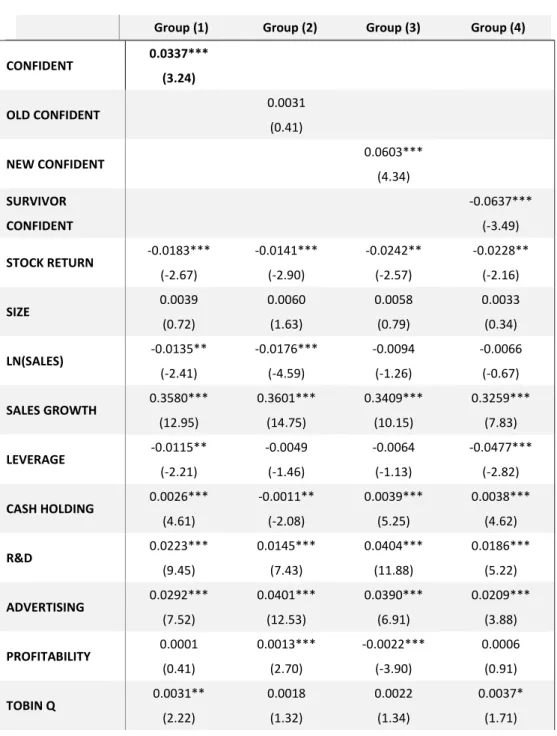
The results show that overconfident CEOs engage significantly more in investment, but not in R&D or advertising. During the financial crisis, overconfident CEOs spend more on capacity expansion to preempt the market, rather than the more uncertain "demand pulling" activities. Interestingly, the dummy variable in group (4) is significantly negative in Table 8 and significantly positive in Tables 9 and 10. Compared to the newly emerged overconfident CEOs, those old overconfident CEOs tend to engage more on R&D or advertising, but less on capacity expansion. The consequence of this difference in strategy choice can be seen from their performances. The dummy variable in group (4) is significantly negative in static and dynamic performance (Tables 5 and 7).
Table 8. Overconfident CEOs and INVESTMENT
The table presents results of regressions of investment on CEO overconfidence. Investment is capital expenditures over net property, plant, and equipment at the beginning of the fiscal year over the fiscal year. The overconfident dummies are CONFIDENT, OLD CONFIDENT, NEW CONFIDENT and SURVIVOR CONFIDENT, and independent variables are described in Table 3. All independent variables are lagged by one year. All continuous independent variables are scaled to have zero mean and standard deviation of one. All regressions include year and industry fixed effects, defined based on 2‐digit SIC codes. Standard errors are corrected for clustering of observations at the firm level (t‐statistics are in parentheses). *, **, and *** measure significance at the 10%, 5%, and 1% level, respectively. INVESTMENT (T‐ STATISTICS)
Group (1) Group (2) Group (3) Group (4)
CONFIDENT 0.0337*** (3.24) OLD CONFIDENT 0.0031 (0.41) NEW CONFIDENT 0.0603*** (4.34) SURVIVOR CONFIDENT ‐0.0637*** (‐3.49) STOCK RETURN ‐0.0183*** (‐2.67) ‐0.0141*** (‐2.90) ‐0.0242** (‐2.57) ‐0.0228** (‐2.16) SIZE 0.0039 (0.72) 0.0060 (1.63) 0.0058 (0.79) 0.0033 (0.34) LN(SALES) ‐0.0135** (‐2.41) ‐0.0176*** (‐4.59) ‐0.0094 (‐1.26) ‐0.0066 (‐0.67) SALES GROWTH 0.3580*** (12.95) 0.3601*** (14.75) 0.3409*** (10.15) 0.3259*** (7.83) LEVERAGE ‐0.0115** (‐2.21) ‐0.0049 (‐1.46) ‐0.0064 (‐1.13) ‐0.0477*** (‐2.82) CASH HOLDING 0.0026*** (4.61) ‐0.0011** (‐2.08) 0.0039*** (5.25) 0.0038*** (4.62) R&D 0.0223*** (9.45) 0.0145*** (7.43) 0.0404*** (11.88) 0.0186*** (5.22) ADVERTISING 0.0292*** (7.52) 0.0401*** (12.53) 0.0390*** (6.91) 0.0209*** (3.88) PROFITABILITY 0.0001 (0.41) 0.0013*** (2.70) ‐0.0022*** (‐3.90) 0.0006 (0.91) TOBIN Q 0.0031** (2.22) 0.0018 (1.32) 0.0022 (1.34) 0.0037* (1.71)
Table 4. Summary statistics This table gives the means and medians of the variables used in this study. CEOs are classified into three groups: old overconfident, new overconfident and non‐confident, and In order to test the differences between the two sides of each dummy variable, we present the Wilcoxon rank sum tests (T‐ tests) where *, **, and *** measure significance at the 10%, 5%, and 1% level, respectively. In the first column, old overconfident CEOs are compared to both non‐confident CEOs and new overconfident CEOs, and the notions in (. ) indicate the significance for the difference between old overconfident CEOs and new overconfident CEOs (i.e., the dummy Survivor Overconfident). In the second column, new overconfident CEOs are tested against non‐ confident CEOs.
OLD OVERCONFIDENT CEO (N=1176) NEW OVERCONFIDENT CEO (N=1458) NON‐OVERCONFIDENT CEO (N=2331)
VARIABLES Mean Median Std. dev. Mean Median Std. dev. Mean Median Std. dev.
STOCK RETURN VOLATILITY 12.98 11.38 7.40 12.78*** 11.57 6.72 13.26 11.34 8.08 STOCK RETURN 0.16***(***) 0.08***(***) 1.00 0.26*** 0.17*** 0.80 0.08 0.03 0.71 SIZE 6.43(***) 6.54(***) 1.89 6.16*** 6.10*** 1.54 6.49 6.48 1.87 SALES 7257.21(**) 1816.82(***) 21855.11 5202.69*** 1078.93*** 20848.25 8214.63 1611.39 25472.40 SALES GROWTH 0.06***(***) 0.05***(***) 0.18 0.13*** 0.09*** 0.25 0.03 0.03 0.15 PPE / EMP 258.02(*) 42.23** 975.22 428.80*** 40.10*** 3111.67 225.10 46.66 845.06 LEVERAGE 0.32(***) 0.29***(***) 0.31 0.24*** 0.21*** 0.63 0.35 0.32 1.28 CASH HOLDING 3.71***(**) 0.64(***) 13.78 5.33*** 0.96*** 20.49 2.56 0.58 10.45 PROFITABILITY 1.07(***) 0.77***(***) 4.71 3.02*** 1.05*** 19.97 1.29 0.58 12.46 TOBIN Q 3.84***(***) 3.00***(***) 3.20 4.92*** 3.40*** 5.64 3.45 2.58 3.05
References
Admati, A. R., and Pfleiderer, P. (2004). Broadcasting opinions with an overconfident sender. International Economic Review, 45(2), 467-498.
Ahmed, A. S., and Duellman, S. (2013). Managerial overconfidence and accounting conservatism. Journal of Accounting Research, 51(1), 1-30.
Alaoui, L., and Penta, A. (2012). Level-k reasoning and incentives , miemo.
Alicke, M. D., and Govorun, O. (2005). The better-than-average effect. In M. D. Alicke, D. Dunning and J. Krueger (Eds.), The self in social judgment (pp. 85-106). New York:
Arabsheibani, G., de Meza, D., Maloney, J., and Pearson, B. (2000). And a vision appeared unto them of a great profit: evidence of self-deception among the self-employed. Economics Letters, 67(1), 35-41.
Astebro, T. (2003). The Return to Independent Invention: Evidence of Unrealistic Op-timism, Risk Seeking or Skewness Loving?. The Economic Journal, 113(484), 226-239.
Babcock, L., and Olson, C. (1992). The causes of impasses in labor disputes. Industrial Relations, 31, 348-360.
Baker, M., Ruback, R., and Wurgler, J. (2007). Behavioral corporate finance: A survey." In The Handbook of Corporate Finance: Empirical Corporate Finance, edited by Espen Eckbo. New York: Elsevier/North Holland.
Bamber, L. S., Jiang, J., and Wang, I. Y. (2010). What’s my style? The influence of top managers on voluntary corporate financial disclosure. The Accounting Review, 85(4), 1131-1162.
Bartram, S. M., and Bodnar, G. M. (2009). No place to hide: The global crisis in equity markets in 2008/2009. Journal of International Money and Finance, 28(8), 1246-1292.
Ben-David, I., Graham, J. R., and Harvey, C. R. (2007). Managerial overconfidence and corporate policies (No. w13711). NBER working paper.
Borokhovich, K. A., Hegab, B., and Marciukaityte, D. (2010). Managerial Overoptimism, Excess Leverage, and Post- Financing Performance. Paper presented at the FMA Annual Meeting
Brown, J. (2011), Quitters Never Win: The (Adverse) Incentive Effects of Competing with Superstars, Journal of Political Economy, Vol. 119, No. 5, 982-1013
Brown, R., and Sarma, N. (2007). CEO overconfidence, CEO dominance and corporate acquisitions. Journal of Economics and Business, 59(5), 358-379.
Chambers, J. R., and Windschitl, P. D. (2004). Biases in social comparative judgments: The role of nonmotivational factors in above-average and comparative-optimism effects.
Psy-chological Bulletin, 130(5).
Chambers, J. R., Windschitl, P. D., and Suls, J. (2003). Egocentrism, event frequency, and comparative optimism: When what happens frequently is "more likely to happen to me". Personality and Social Psychology Bulletin, 29(11), 1343-1356.
De la Rosa, L. E. (2008). Overconfidence in a Career-concerns Setting, mimeo.
De la Rosa, L. E. (2011). Overconfidence and moral hazard. Games and Economic Behavior, 73(2), 429-451.
Dechow, P., Ge, W., and Schrand, C. (2009). Earnings quality and earnings management. Journal of Accounting and Economics. this issue.
Deshmukh, S., Goel, A., and Howe, K. (2010). CEO overconfidence and dividend policy. Available at SSRN 1496404.
Dixit, Avinash, 1979, A model of duopoly suggesting a theory of entry barriers, Bell Journal of Economics 10, 20-32.
Englmaier, F. (2004, October). A strategic rationale for having overconfident managers. In 32nd Conference of the European Association for Research in Industrial Economics.
Fairchild, R. (2005). The effect of Managerial Overconfidence, asymmetric information, and moral hazard on capital structure decisions. Available at SSRN 711845.
Fang, H., and Moscarini, G. (2005). Morale hazard. Journal of Monetary Economics, 52(4), 749-777.
Fu, Q., Ke, C. and Tan, F. (2013), Success breeds success or Pride goes before a fall?, miemo.
Fudenberg, D. and Levine, D. (1998), The Theory of Learning in Games. MIT Press, Cambridge.
Gervais, S., Heaton, J. B., and Odean, T. (2003). Overconfidence, investment policy, and executive stock options. Rodney L. White Center for Financial Research Working Paper, (15-02).
Goel, A. M., and Thakor, A. V. (2008). Overconfidence, CEO selection, and corporate governance. The Journal of Finance, 63(6), 2737-2784.
Galasso, A., and Simcoe, T. S. (2011). CEO overconfidence and innovation. Management Science, 57(8), 1469-1484.
Grubb, M. D. (2009). Selling to overconfident consumers. The American Economic Review, 1770-1807.
Hackbarth, D. (2008). Managerial Traits and Capital Structure Decisions. Journal of Financial and Quantitative Analysis, 43(04), 843-881.
Hackbarth, D. (2009). Determinants of corporate borrowing: A behavioral perspective. Journal of Corporate Finance, 15(4), 389-411.
Harris, C., and Vickers, J. (1987). Racing with uncertainty. The Review of Economic Studies, 54(1), 1-21.
Harvey, N. (1997). Confidence in judgment. Trends in Cognitive Sciences, 1(2), 78-82. Heaton, J. B. (2002). Managerial Optimism and Corporate Finance. Financial Manage-ment, 31(2).
Hirshleifer, D., Low, A., and Teoh, S. H. (2012). Are overconfident CEOs better innova-tors?. The Journal of Finance, 67(4), 1457-1498.
Ho, C. R., and Chang, Y. (2012). CEO Overconfidence and Corporate Financial Distress. Available at SSRN 2128161.
Hoffrage, Ulrich (2004). "Overconfidence". In Riger Pohl. Cognitive Illusions: a hand-book on fallacies and biases in thinking, judgement and memory. Psychology Press.
Hovakimian, A., and Hovakimian, G. (2009). Cash Flow Sensitivity of Investment. Eu-ropean Financial Management, 15(1).
Hribar, P., and Yang, H. (2010). Does CEO overconfidence affect management forecasting and subsequent earnings management. mimeo.
304-329.
Jin, L., and Kothari, S. P. (2008). Effect of personal taxes on managers’ decisions to sell their stock. Journal of Accounting and Economics, 46(1), 23-46.
Johnson, D. D., and Fowler, J. H. (2011). The evolution of overconfidence. Nature, 477(7364), 317-320.
Kets, W., and Voorneveld, M. (2008). Learning to be prepared. International Journal of Game Theory, 37(3), 333-352.
Khachatryan, K., and Weibull, J. W. (2011). Entrepreneurial Overconfidence and Market Selection. Biased Beliefs and Heterogeneous Preferences, 51.
Kolasinski, A. C., and Li, X. (2013). Do strong boards and trading in their own firm’s stock help CEOs make better decisions? evidence from corporate acquisitions by overconfi-dent CEOS. Journal of Financial and Quantitative Analysis.
Klepper, S., and Thompson, P. (2005). Spinoff entry in high-tech industries: motives and consequences. Economic Perspectives on Innovation, Cambridge University Press, 6, 187-218.
Klepper, S., and Thompson, P. (2010). Disagreements and intra-industry spinoffs. Inter-national Journal of Industrial Organization, 28(5), 526-538.
Klumpp, T., and Polborn, M. K. (2006). Primaries and the New Hampshire effect. Journal of Public Economics, 90(6), 1073-1114.
Konrad, K. A., and Kovenock, D. (2009). Multi-battle contests. Games and Economic Behavior, 66(1), 256-274.
Kovenock, D., & Roberson, B. (2010). Conflicts with multiple battlefields (No. 3165). CESifo working paper: Empirical and Theoretical Methods.
Krahmer, D. (2003). Learning and self-confidence in contests. Available at SSRN 395702. Kruger, J., and Burrus, J. (2004). Egocentrism and focalism in unrealistic optimism (and pessimism). Journal of Experimental Social Psychology, 40(3), 332-340.
Lowe, R. A., and Ziedonis, A. A. (2006). Overoptimism and the performance of entre-preneurial firms. Management Science, 52(2), 173-186.
Malmendier, U., and Tate, G. (2005a). CEO Overconfidence and Corporate Investment. The Journal of Finance, 60(6), 2661-2700.
Odean, T. (1998). Volume, volatility, price, and profit when all traders are above average. The Journal of Finance, 53(6), 1887-1934.
Oliver, B. (2005). The impact of management confidence on capital structure. Available at SSRN 791924.
Plous, S. (1993). The psychology of judgment and decision making. New York: McGraw-Hill.
Puri, M., and Robinson, D. T. (2007). Optimism and economic choice. Journal of Financial Economics, 86(1), 71-99.
Roll, R. (1986). The Hubris Hypothesis of Corporate Takeovers. Journal of Business, 59(2), 197-216.
Rozanova, O. V. (2010). Strategic Rationale For Having Overconfident Managers. Gen-eral Case. In International Conference On Applied Economics—Icoae (p. 657).
Schrand, C. M., and Zechman, S. L. (2012). Executive overconfidence and the slippery slope to financial misreporting. Journal of Accounting and Economics, 53(1), 311-329.
Shapira-Ettinger, K., and Shapira, R. (2008). The Constructive Value of Overconfidence. Review of Law and Economics, 4(3), 751-778.
Shefrin, H. M. (2001). Behavioral Corporate Finance. Journal of Applied Corporate Finance, 14(3).
Simon, M., and Houghton, S. M. (2003). The relationship between overconfidence and the introduction of risky products: Evidence from a field study. Academy of Management Journal, 46(2), 139-149.
differenti-ated duopoly, Rand Journal of Economics 15, 546-554.
Slothouber, E. I. J. S. (2010). The influence of CEO overconfidence on firm value. mimeo. Spiegler, R. (2011). Bounded rationality and industrial organization. Oxford University Press.
Stechyshyna, N. (2012). Manager’S Overconfidence and Risk Taking Aptitudes and The Cross Industry Acquisitions. mimeo.
Sudarsanam, S., and Huang, J. (2006). Managerial incentives, overconfidence, risk-taking, and acquirer shareholder value creation in mergers and acquisitions. In European Financial Management Association Annual Meeting, Madrid.
Thompson, L., and Loewenstein, G. (1992). Egocentric interpretations of fairness and interpersonal conflict. Organizational Behavior and Human Decision Processes, 51(2), 176-197.
Van den Steen, E. (2004). Rational overoptimism (and other biases). The American Economic Review, 94(4), 1141-1151.
Van den Steen, E. (2005). Organizational beliefs and managerial vision. Journal of Law, Economics, and Organization, 21(1), 256-283.
Weinberg, B. A. (2009). A model of overconfidence. Pacific Economic Review, 14(4), 502-515.
Wengstrom, E. (2008). Price competition, level-k theory and communication. Economics Bullentin, 3(66), 1-15.
科技部補助計畫衍生研發成果推廣資料表
日期:2015/11/23科技部補助計畫
計畫名稱: 管理者過度自信之策略影響 計畫主持人: 何靜嫺 計畫編號: 103-2410-H-004-100- 學門領域: 財務無研發成果推廣資料
103年度專題研究計畫研究成果彙整表
計畫主持人:何靜嫺 計畫編號: 103-2410-H-004-100-計畫名稱:管理者過度自信之策略影響 成果項目 量化 單位 備註(質化說明 :如數個計畫共 同成果、成果列 為該期刊之封面 故事...等) 實際已達成 數(被接受 或已發表) 預期總達成 數(含實際 已達成數) 本計畫實 際貢獻百 分比 國內 論文著作 期刊論文 0 0 100% 篇 研究報告/技術報告 0 0 100% 研討會論文 0 0 100% 專書 0 0 100% 章/本 專利 申請中件數 0 0 100% 件 已獲得件數 0 0 100% 技術移轉 件數 0 0 100% 件 權利金 0 0 100% 千元 參與計畫人力 (本國籍) 碩士生 0 0 100% 人次 博士生 1 1 100% 博士後研究員 0 0 100% 專任助理 0 0 100% 國外 論文著作 期刊論文 0 0 100% 篇 研究報告/技術報告 0 0 100% 研討會論文 1 1 100% 專書 0 0 100% 章/本 專利 申請中件數 0 0 100% 件 已獲得件數 0 0 100% 技術移轉 件數 0 0 100% 件 權利金 0 0 100% 千元 參與計畫人力 (外國籍) 碩士生 0 0 100% 人次 博士生 0 0 100% 博士後研究員 0 0 100% 專任助理 0 0 100% 其他成果 (無法以量化表達之 成果如辦理學術活動 、獲得獎項、重要國 際合作、研究成果國 際影響力及其他協助 無成果項目 量化 名稱或內容性質簡述 科 教 處 計 畫 加 填 項 目 測驗工具(含質性與量性) 0 課程/模組 0 電腦及網路系統或工具 0 教材 0 舉辦之活動/競賽 0 研討會/工作坊 0 電子報、網站 0 計畫成果推廣之參與(閱聽)人數 0