Abstract—Monitoring the wafer defects in integrated circuit (IC) fabrication is essential for enhancing wafer yield. However, signif-icant defect clustering occurs when the wafer is large, so the con-ventional defect control chart, based on the Poisson distribution, is inappropriate. Defect clustering must also be analyzed to monitor effectively defects in IC fabrication process control. This study de-veloped a novel procedure using the multivariate Hotelling 2 con-trol chart, based on the number of defects and the defect clustering index (CI) to monitor simultaneously the number of defects and the defect clusters. The CI does not require any statistical assumptions concerning the distribution of defects and can accurately evaluate the clustering phenomena. A case study of a Taiwanese IC manu-facturer demonstrates the effectiveness of the proposed procedure. Index Terms—C chart, defect, defect clustering, integrated cir-cuits (IC), Hotelling 2control chart, wafer.
I. INTRODUCTION
P
RODUCT yield plays a critical role in determining the market competitiveness of integrated circuit (IC) manu-facturers. All IC manufacturers try to increase their product yield. The wafer yield is defined as the ratio of the number of dies that pass the final specification test to the total number of tested dies on a wafer. Wafer defects significantly impact the wafer yield. Normally, more defects produce a lower wafer yield. However, if defects on a wafer exhibit clustering, the number of defects may not reflect the actual yield. Hence, the defect-clustering phenomenon must be included when defects formed in the process are monitored.Control charts are extensively adopted in relation to industrial applications. A control chart can clearly describe all the parts in a process. The conventional defect control chart employed in support of the IC manufacturing process assumes that wafer de-fects follow a Poisson distribution. This assumption implies that the probability of a defect being present on a wafer is the same at all locations. All defects are independent of each other. That is, the defects are randomly distributed. However, wafer manufac-turing is becoming increasingly complex as the size of wafers increases, resulting in the clustering of defects on the wafers. Under such conditions, the conventional defect control chart re-sults in many false alarms. Albin and Friedman [1] developed
Manuscript received December 17, 2002; revised July 12, 2004.
L.-I. Tong is with the Department of Industrial Engineering and Manage-ment, National Chiao Tung University, HsinChu, Taiwan, R.O.C. (e-mail: litong@cc.nctu.edu.tw).
C.-H. Wang is with the Department of Computer Science, Chung Cheng In-stitute of Technology, National Defense University, Taoyuan, Taiwan, R.O.C. (e-mail: wch@ccit.edu.tw).
C.-L. Huang is with the Process Engineering Department, Advanced Semi-conductor Manufacturing Group, Kaohsiung, Taiwan, R.O.C. (e-mail: charlie-huang@aseglobal.com).
Digital Object Identifier 10.1109/TSM.2004.836659
a revised defect control chart based on the Neyman Type-A distribution of the compound Poisson distribution family to re-duce the number of false alarms obtained using conventional control charts. The control limits of this revised defect con-trol chart exceed those of conventional defect concon-trol charts. Accordingly, Albin and Friedman’s control chart reduces the number of false alarms obtained using the conventional defect control chart. However, this approach does not account for the defect clustering effects, so it cannot actually reflect the defects’ circumstances formed in IC fabrication to trace the causes of a defect, as engineers would require.
Some studies of defect clustering have been developed, such as those of Stapper [8], [9], Cunningham [2], and Jun et al. [4]. Among these studies, Jun et al. [4] developed a clustering index (CI) that could more accurately depict the clustering phenom-enon than other studies. The CI value is independent of the chip area and does not require any assumptions about the defect dis-tribution. This study therefore develops a multivariate Hotelling control chart based on the number of defects and CI values to monitor efficiently the defects in IC fabrication. The CI is utilized to quantify clustering. The simultaneous monitoring or control of several related quality characteristics is necessary in many situations. Even when these quality characteristics are in-dependent, monitoring these variables independently could be very misleading [7]. Since the multivariate control chart is more effective for monitoring two or more related quality character-istics than employing the control chart for each variable, this study proposes a novel procedure for constructing a multivariate Hotelling control chart using defect number and CI as two quality characteristics to monitor or control defect number and defect clustering on wafers. Meanwhile, the statistics are de-composed based on Mason et al. [6] to trace the source of the out-of-control points on the multivariate Hotelling control chart. The decomposition of statistics helps to identify the determinant of the out-of-control points, whether too many de-fects, the clustering of dede-fects, or both. A case study of a Tai-wanese IC manufacturer demonstrates the effectiveness of the proposed procedure.
II. LITERATUREREVIEW
The conventional defect control chart employed in the IC manufacturing process assumes that wafer defects follow a Poisson distribution. The probability of a sample point being outside the above limits approximates 0.0027 when the process is under control. For details on defect control charts, refer to Montgomery [7].
Fig. 1. Defect maps and projectedx and y coordinates [4].
Stapper [8] indicated that the defect distribution exhibits clus-tering along with increased wafer size, making the defect distri-bution no longer random. In this case, the conventional defect control chart is inappropriate for monitoring defects on wafers since it produces many false alarms. Some revised defect con-trol charts have been developed to solve this problem. For ex-ample, Albin and Friedman [1] developed a revised defect con-trol chart based on the Neyman Type-A distribution of the com-pound Poisson distribution family. They assumed that the clus-ters follow a Poisson distribution and that defects within clusclus-ters also follow a Poisson distribution. The control limits based on the Neyman assumption are times those obtained on the Poisson assumption. The approach of Albin and Friedman [1] reduces the number of false alarms by widening these control limits. However, Stapper [8] stated that this revised control chart does not account for defect clustering. Defect clustering on a wafer may produce a yield inconsistent with that obtained when defects are randomly distributed, given a particular number of defects, because the relationship between the number of defects and the degree of defect clustering was not considered in deter-mining the yield. Consequently, defect clustering must be con-sidered when determining the effects of defects on wafer yield. Jun et al. [4] proposed a new cluster index (CI) to evaluate the effect of the clustering of defects in a wafer. The CI value is independent of the chip area and does not depend on assump-tions concerning the distribution of defects. Restated, suppose a wafer has defects. In and coordinates, the th defect can be represented as , where . Accordingly, all of the defects can be projected into and coordinates. Fig. 1 [4] presents examples of defect maps and the corresponding pro-jected and coordinates.
The defect intervals on the and coordinates are defined as follows [4]:
(1) (2) where . According to Fig. 1(d), defect clustering tends to present burstiness or clumps in and coordinates. This type of defect clustering results in a large variance of defect intervals. However, Fig. 1(b) and (c) shows that burstiness on either the or the axis does not necessarily reveal clustered defects. Based on the relationship between defect clustering and cluster burstiness or clumps in and coordinates, Jun et al. [4] proposed the following CI:
(3)
TABLE I COMPARISONS OF ANDCI
where
, and . If defect locations are assumed to be uniformly and randomly distributed, the index CI is close to one. A larger CI value is associated with highly clustered defects. Jun et al. [4] also compared the perfor-mance of CI with the clustering parameter obtained from the well-known negative binomial model [9]. Table I [4] presents the comparisons and reveals that the CI can more accurately quantify clustering than can , because the distribution of is quite scattered, making evaluation of the clustering of defects inconvenient. Therefore, this study uses CI and the number of defects on a wafer to establish a multivariate Hotelling control chart for monitoring the characteristics of defects. A case study of a Taiwanese IC manufacturer demonstrates the effectiveness of the proposed procedure.
III. PROPOSEDPROCEDURE
The proposed multivariate Hotelling control chart, based on the CI index and the number of defects, is generated in the following six steps.
Step 1) Obtain a wafer map using the KLA 2110 wafer in-spection system.
The KLA 2110 wafer inspection system is ex-tensively used wafer inspection equipment in the semiconductor industry. This equipment performs in-line inspection during a manufacturing process. After wafers are inspected using KLA, a wafer map that includes the number of defects, their sizes, and their locations on the inspected wafer, is produced. These collected data are then utilized to monitor the wafer defects produced in IC fabrication.
Step 2) Calculate the total number of defects and the CI values.
The total number of defects and the CI values of the wafer can be calculated from the locations, sizes, and types of defects, obtained from the wafer map using (1)–(3).
practitioner simply tries one or more transforma-tions is a widely used method for selecting the transformation for achieving normality [10]. More-over, the analytical procedure is also an effective means to identify the type of power transformation to achieve normality [6].
Step 4) Perform outlier analysis.
Outliers must be detected and the corresponding causes traced to determine whether the outlier should be deleted or corrected, since outliers can severely influence the results of the analysis. This study uses the Forth Spread method [3] to detect outliers. Let and be the first and third quar-tiles, and ; then, the lower and upper limits of the nonoutlier data and are expressed as
(4) (5) The data beyond the limits are referred to as out-liers. The outliers must be deleted or corrected be-fore the multivariate Hotelling control chart is established, if assignable causes exist.
Step 5) Establish the multivariate Hotelling control chart.
After outlier analysis is performed, a multivariate Hotelling control chart is established based on the number of transformed defects and the CI values considered as two quality characteristics. A multi-variate Hotelling control chart can effectively monitor multiple responses, especially when a mod-erate or strong correlation exists among them. Sup-pose pieces of wafers ( subgroups), quality characteristics, and one observation are collected for each subgroup. The Hotelling statistics are determined as [11]
(6) where represents the -di-mensional quality characteristics and and are the common estimators for the mean vector and covariance matrix obtained from these values of quality characteristics. The upper control limit of the multivariate Hotelling control chart can be expressed as follows [11]:
(7) where represents a significance level.
Step 6) Trace the sources of the out-of-control points.
The statistics are decomposed following the method of Mason et al. [6] for exploring the sources of out of control points on a multivariate Hotelling control chart. The interactions among the re-sponses are determined by statistical decomposi-tion. In this study, the number of defects and CI values were the two correlated quality characteris-tics. Suppose that represents an out-of-control point; can be decomposed as
, where and represent the effects of the number of defects and defect clustering, respec-tively. represents the interactions between the number of defects and the defect clustering under the condition of defect clustering and repre-sents the interactions between the number of de-fects and the defect clustering under the condition of the number of defects. The individual decomposed statistic can be used to trace the source of the out-of-control point, if its statistical value exceeds the corresponding UCL as follows [6]:
(8)
IV. ILLUSTRATION
The effectiveness of the proposed procedure was demon-strated using a metal 2 etch process performed by a Taiwanese IC manufacturer. The collected data were analyzed as follows.
Step 1) Obtain the wafer map using the KLA 2110 wafer inspection system.
After metal 2 etching, 110 pieces of six-in wafer maps were obtained using KLA 2100. Each wafer included 396 chips. Table II lists the absolute coor-dinates of nine defects on the first wafer. The origin of the coordinate system is the bottom left of the wafer.
Step 2) Calculate the total number of defects and CI values. The CI values can be obtained by substituting the coordinates of 110 wafers into (1)–(3). Table III summarizes the number of defects and CI values of the 110 wafers.
Step 3) Perform the normality test on the number of defects and CI values.
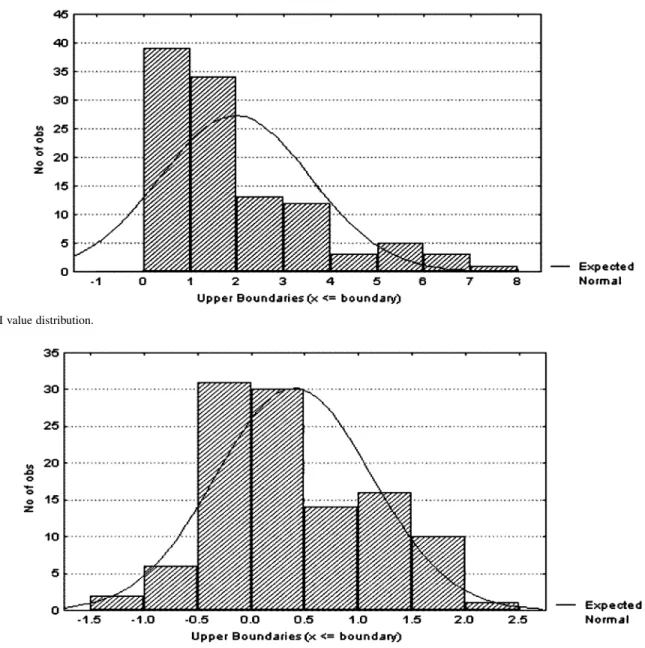
Fig. 2 displays the distribution of CI values. In this figure, the CI value distribution is nonnormal. Since the distribution of CI values is skewed to high
Fig. 2. CI value distribution.
Fig. 3. Distribution of ln (CI).
TABLE III
NUMBER OFDEFECTS ANDCI VALUES
values, the natural log transformation of CI values produces a distribution that is closed to normal. Fig. 3 displays the corresponding distribution.
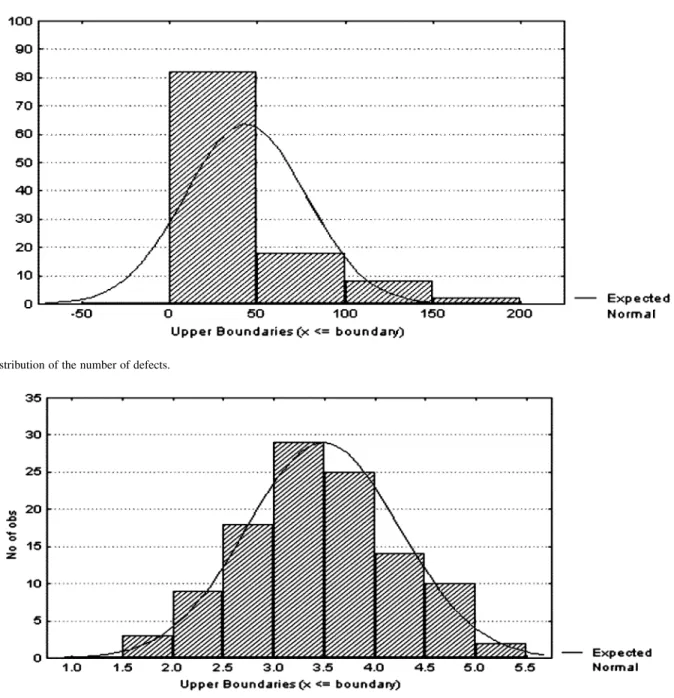
Similarly, the distributions of the number of de-fects and the transformed number of dede-fects are also plotted. Figs. 4 and 5 display the corresponding plots.
Step 4) Conduct outlier analysis.
The lower and upper limits of the nonoutlier for the transformed number of defects,
and can be obtained by substituting the transformed numbers of defects on the 110 wafers into (4) and (5). Similarly, and on the trans-formed CI values, 1.54 and 2.67 can be obtained by substituting the transformed CI values into (4) and (5). No outliers were present because all the transformed number of defects and CI values as-sociated with the 110 wafers were located between
and .
Step 5) Establish multivariate Hotelling control chart. Hotelling statistics for the 110 wafers were calculated by substituting the transformed number of defects and CI values into (6). Table IV lists the corresponding calculations at a significance level of
.
The UCL of the multivariate Hotelling control chart was obtained from (7) with
and a specified significance level . Figs. 6 and 7 present the multivariate Hotelling control charts with and and include three
Fig. 4. Distribution of the number of defects.
Fig. 5. Distribution of ln (number of defects).
TABLE IV
HOTELLINGT STATISTICS FOR = 0:05
and nine out-of-control points, respectively. Table V lists the corresponding statistics.
Step 6) Trace the sources of out-of-control points. The decomposed statistics for
and were calculated using the method of Mason et al. [6] to identify the sources of the
TABLE V
T STATISTICS FOROUT-OF-CONTROLPOINTS FOR = 0:05AND = 0:10
out-of-control points. The corresponding critical points (that is, UCL) were calculated using (8) to test whether the individual decomposed sta-tistics yielded points outside the control limits. Tables VI and VII present the results of the calcu-lations.
Fig. 6. HotellingT control chart for = 0:05.
Fig. 7. HotellingT control chart for = 0:10. TABLE VI
DECOMPOSITION OFT STATISTIC FOR = 0:05
According to Tables VI and VII, if the interac-tions are the sources of the out-of-control points, then a low correlation exists between these two quality characteristics. That is, one of two possible situations pertains. The first involves many defects that are not clustered on a wafer, as for wafers 9 and 80. The second involves a few defects with severe clustering, as for wafer 102.
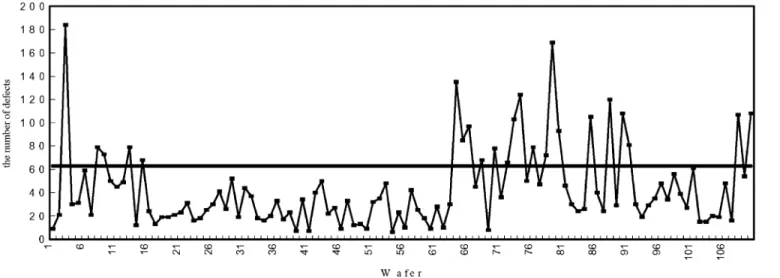
The results of the proposed procedure were compared with those obtained using a conventional defect control chart and the modified defect control chart of Albin and Friedman [1]. Fig. 8 presents the conventional defect control chart based
TABLE VII
DECOMPOSITION OFT STATISTIC FOR = 0:10
on 110 wafers and shows 23 out-of-control points. The mean number of defects is 43.1091, indicating that the process is significantly out of control. However, these 110 wafers do not exhibit the expected low yield because the defects cluster on
Fig. 8. Conventional defect control chart based on 110 wafers.
Fig. 9. Revised defect control chart.
wafers, causing the conventional defect control chart to produce many false alarms.
Following the approach of Albin and Friedman [1], the pa-rameters of the Neyman Type-A distribution, and are 1.4907 and 30.054 61, respectively, based on the mean and standard de-viation of the number of defects on 110 wafers. The probability density function of the Neyman Type-A distribution is there-fore obtained and the corresponding UCL is 180. Fig. 9 displays this control chart and reveals only one out-of-control point be-cause Albin and Friedman [1] tried to resolve the false alarm problem in conventional defect control charts. Although Albin and Friedman’s approach overcomes the shortcoming of con-ventional defect control charts, their study did not consider the clustering of defects effect. Therefore, Albin and Friedman’s approach cannot accurately elucidate the true circumstances of defect formation or provide efficient process information to en-gineers.
V. CONCLUSION
The number and distribution of defects significantly affects wafer yield. As wafer size increases in IC design, the clustering
of defects in IC fabrication is becoming more pronounced. In such circumstances, the conventional defect control chart is un-suitable because it produces many false alarms. Therefore, in addition to the number of defects, the clustering of defects must also be involved in inline process control to elucidate accu-rately the circumstances of the defects. This study proposed an efficient multivariate Hotelling control chart based on the number of defects and clustering index (CI). Through statistical decomposition, the source of out-of-control points can be inves-tigated. Engineers can obtain efficient process information from the proposed multivariate control chart to solve the problem of defects.
In summary, this study has the following merits.
1) The proposed multivariate control chart, which includes information on the number and clustering of defects, can efficiently monitor the wafer manufacturing process cir-cumstances and reduce the complexity of process control. 2) This study further analyzes the interaction between the defect clustering and the number of defects using sta-tistical decomposition. Clustering phenomena are explic-itly described and the sources of out-of-control points
are accurately determined. The information on out-of-control points helps engineers to trace technically corre-sponding causes (such as human, machine-related, mate-rial, methodological, and others.).
3) The proposed multivariate control chart can be general-ized to any size of a wafer.
REFERENCES
[1] S. L. Albin and D. J. Friedman, “The impact of clustered defect distri-butions in IC fabrication,” Manage. Sci., vol. 35, no. 9, pp. 1066–1078, 1989.
[2] J. A. Cunningham, “The use and evaluation of yield models in integrated circuit manufacturing,” IEEE Trans. Semiconduct. Manufact., vol. 3, pp. 60–71, May 1990.
[3] D. C. Hoaglin, B. Iglewicz, and J. W. Tukey, “Performance of some resistant rules for outlier labeling,” J. Amer. Statistical Assoc., vol. 81, pp. 991–999, 1986.
[4] C. H. Jun, Y. Hong, S. Y. Kim, K. S. Park, and H. Park, “A simulation-based semiconductor chip yield model incorporating a new defect cluster index,” Microelectronics Reliability, vol. 39, pp. 451–456, 1999. [5] N. Johnson and D. Wichern, Applied Multivariate Statistical
Anal-ysis. Englewood Cliffs, NJ: Prentice-Hall, 1988.
[6] R. L. Mason, N. D. Tracy, and J. C. Young, “A practical approach for interpreting multivariateT control chart signal,” J. Quality Technol., vol. 29, pp. 396–406, 1997.
[7] D. C. Montgomery, Introduction to Statistical Quality Control. New York: Wiley, 2001.
[8] C. H. Stapper, “The effects of wafer to wafer density variations on inte-grated circuit defect and fault density,” IBM J. Res. Devel., vol. 29, pp. 87–97, 1985.
[9] , “Defect density distribution for LSI yield calculations,” IEEE
Trans. Electron Devices, vol. ED-20, pp. 655–657, 1973.
[10] S. Sharma, Applied Multivariate Techniques. New York: Wiley, 1996, pp. 382–383.
[11] N. D. Tracy, J. C. Young, and R. L. Mason, “Multivariate control chart for individual observations,” J. Quality Technol., vol. 24, pp. 88–95, 1992.
Lee-Ing Tong is a Professor in the Department of Industrial Engineering and Management, National Chiao-Tung University, Taiwan, R.O.C. She has published several journal articles in the areas of quality engineering and statistical process control.
Chung-Ho Wang is an Associate Professor in the Department of Computer Science, Chung Cheng In-stitute of Technology, National Defense University, Taiwan, R.O.C. He has published several journal arti-cles in the areas of quality engineering and statistical process control.
Chih-Li Huang is an Engineer in the Process neering Department, Advanced Semiconductor Engi-neering Group, Taiwan, R.O.C. His research interests include the area of statistical process control.
![Fig. 1. Defect maps and projected x and y coordinates [4].](https://thumb-ap.123doks.com/thumbv2/9libinfo/7681387.142271/2.891.246.642.96.249/fig-defect-maps-projected-x-y-coordinates.webp)