中國醫藥大學機構典藏 China Medical University Repository, Taiwan:Item 310903500/3538
6
0
0
全文
(2) 44. Gene-expression Profile in an Esophageal Cancer Patient. Table 1. Gene-expression profiling (fluorescence intensity) in esophageal carcinoma compared with the normal esophageal epithelium. Gene name Up regulation Metabolism/Redox enzymes Ornithine decarboxylase 1 Aldehyde dehydrogenase Glutathione peroxidase Argininosuccinate synthetase Oligoadenylate synthetase Arylsulfatase B ESTs Parathyroid hormone-like hormone Lactotransferrin Cell Proliferation/Inflammation Gamma-aminobutyric acid A receptor-epsilone Tryptophanyl-tRNA synthetase Replication factor C Chromosome 10 open reading frame 3 Cell adhesion protein Integrin-alpha 6 Pleckstrin homology-Sec7 Cell Cycle regulator Insulin-like growth factor binding protein 3 Retinol binding protein 1-cellular Fas-associated via death domain Jun D proto-oncogene 2`-5`-oligoadenylate synthetase 2-69/71kDa Intracellular signalling Myelin basic protein Interferon-alpha-inducible protein Cell membrane receptor Hypothetical protein FLJ10261 Others Collagen-type I-alpha 1 Cytoskeleton-associated protein 1 Hypothetical protein LOC90850 Down regulation Metabolism/Redox enzymes Hydroxyprostaglandin dehydrogenase 15-(NAD) Transglutaminase Myosin, light polypeptide 9, regulatory DKFZP566F084 protein Deiodinase-iodothyronine-type II Arachidonate 15-lipoxygenase Cell Proliferation Eukaryotic translation initiation factor 4 gamma-1 Hypothetical protein LOC253827 Hypothetical protein MGC2668 Cell Cycle regulator Synaptopodin 2 Retinoic acid binding protein 2 Mitogen-activated protein kinase Four and a half LIM domains 1 Intracellular signaling Mal-T-cell differentiation protein p55-GAMMA BMP-2 inducible kinase. Accession*. Ratio of mean. Genetic locus. AA460115 AA664101 AA135152 AA676466 AA146772 AA128825 AA143342 AA845432 AA677706. 13.420 7.680 5.721 5.707 5.675 5.140 12.037 5.166 5.132. 2p25 9q21.13 14q24.1 9q34 12q24.1 5p11 21q22.1 12p12.1 3q21. H63934 AA664040 H54751 AA131908. 6.250 8.003 6.414 5.979. Xq28 14q32.31 7q11.23 10q23.33. R17993 AA480859. 5.469 5.054. 2q31 17q25. AA598601 AA700832 AA430751 AA131585 AF074990. 5.347 5.225 13.114 5.688 5.227. 7p13 3q23 11q13.3 19p13.2 12q24.2. N62730 AA406019. 18.838 8.548. 18q23 11p13. AA400086. 18.097. 11q13.2. R48843 AA504477 AA620404. 6.645 5.244 18.996. 17q21.3 19q13.11 16p13.3. AA775223 N90882 AA877166 AA773458 AA864322 AI474406. 0.175 0.186 0.137 0.139 0.174 0.198. 4q34 20q11.2 20q11.23 10q24.32 14q24.2 17p13. R12349 N91811 AA424545. 0.161 0.138 0.174. 3q27 12q14.1 9q34.13. W52186 AA598508 H01340 AA456394. 0.034 0.197 0.148 0.149. 4q27 1q21.3 19q13.2 Xq26. AA227594 AI394701 R98008. 0.172 0.181 0.184. 2cen-q13 1p34.1 4q21.23. *Genbank ID. Wavelength intensity of tumor (635 nm) and normal tissue (532 nm)..
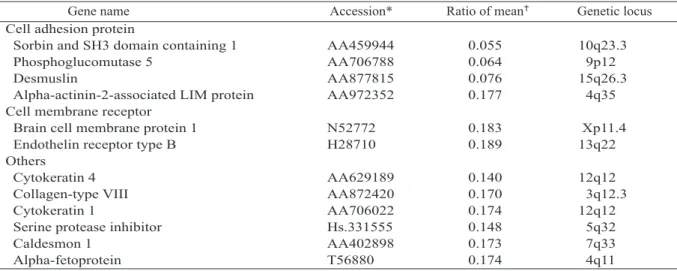
(3) Nan-Yung Hsu, et al.. Table 1. Continued Gene name Cell adhesion protein Sorbin and SH3 domain containing 1 Phosphoglucomutase 5 Desmuslin Alpha-actinin-2-associated LIM protein Cell membrane receptor Brain cell membrane protein 1 Endothelin receptor type B Others Cytokeratin 4 Collagen-type VIII Cytokeratin 1 Serine protease inhibitor Caldesmon 1 Alpha-fetoprotein. 45. Accession*. Ratio of mean. Genetic locus. AA459944 AA706788 AA877815 AA972352. 0.055 0.064 0.076 0.177. 10q23.3 9p12 15q26.3 4q35. N52772 H28710. 0.183 0.189. Xp11.4 13q22. AA629189 AA872420 AA706022 Hs.331555 AA402898 T56880. 0.140 0.170 0.174 0.148 0.173 0.174. 12q12 3q12.3 12q12 5q32 7q33 4q11. Table 2. A search of MEDLINE for papers published from 1965 to the present revealed that 7 of the 26 upregulated genes and 8 of the 28 down-regulated genes had been reported Down-regulated genes Up-regulated genes Number 1 Ornithine decarboxylase Transglutaminase 2 Aldehyde dehydrogenase Serine protease inhibitor 3 Glutathione peroxidase Retinoic acid binding protein 4 Parathyroid hormone-like hormone Cytokeratin 4 5 Lactotransferrin Mitogen-activated protein kinase 6 Integrin-alpha 6 Arachidonate 15-lipoxygenase 7 Fas-associated via death domain Cytokeratin 1 8 Alpha-fetoprotein. infiltrated the superficial muscle layer. The pathological stage was T2N0M0 (IIA). The patient has been well for one year after the surgery without any sign of recurrence. Gene expression in the ESCC tissue was profiled by the cDNA microarray method. In brief, total RNA was extracted from the normal and tumor tissues by TRIzol reagent. The isolated RNA was qualified by gel analysis and the ratio of absorbance was determined at 260 nm and 280 nm (> 1.7). Thirty micrograms of total RNA from normal and tumor tissues were Cy3- and Cy5labeled, respectively. PCR products were arrayed by a Microgrid II pro arrayer (Biorobotics Ltd., Cambridgeshire, United Kingdom). The labeled RNA was then hybridized at 62 C for 15.5 h. Arrays were scanned and each spot was defined by automatic positioning of a grid using imageanalysis spot-tracking software (patent US 10/173,672 June 19, 2002; CA 2,389,901 June 20, 2002). We focused first on a set of 1416 genes. (about 17.0% of the 8354 genes analyzed, which comprised 922 up-regulated genes and 494 downregulated genes), whose transcripts varied in abundance by at least twofold expression levels (fluorescence intensity) from their mean abundance in esophageal carcinoma compared with the normal esophageal epithelium. Among the 922 up-regulated genes, 26 (2.8%) genes whose expression levels in esophageal carcinoma were more than 5 times the levels expressed in normal esophageal epithelium were selected. In addition, 28 (5.7%) of the 494 down-regulated genes whose expression levels in esophageal carcinoma were less than 0.2 times the levels expressed in normal esophageal epithelium were selected. These genes were classified according to their biologic roles, such as metabolism, cell proliferation, cell adhesion protein, cell cycle regulator, intracellular signaling and transmembrane protein (Table 1). A search of MEDLINE for papers published from 1965 to.
(4) 46. Gene-expression Profile in an Esophageal Cancer Patient. the present revealed that only 7 of the 26 upregulated genes and only 8 of the 28 downregulated genes have been reported to be associated with gene expression in ESCC (Table 2). DISCUSSION. The major methods for screening and identifying specific gene(s) involved in carcinogenesis, disease progression and resistance of treatment of ESCC comprise microarray, cDNA subtraction, serial analysis of gene expression (SAGE), differential display and proteomics [6-8]. Although cDNA microarray technology has limitations, such as chip to chip variation, unanswered biological relevance of fold change, cross-hybridization of sequences with high identity, and difficulty of mRNA levels reflecting protein levels [9], it has enabled the expression profiles of thousands of genes to be analyzed simultaneously. In addition, although the correlation between clinicopathological phenotypes and gene expression status has not been completely proven, this technique can provide a powerful means to stratify tumors into classes with distinct molecular pathophysiologies [5]. Several of the genes expressed in ESCC tissue identified in the literature were also found in this study. For example, ornithine decarboxylase was the most highly (13.4-fold) expressed up regulated gene in this study [10]. In addition, ornithine decarboxylase has also been reported to be one of the transcriptional genes expressed in esophageal adenocarcinoma [11]. The Fas-assocated via death domain (FADD), which was abundantly expressed in our study, has been reported to be associated with an increased risk of developing ESCC [12,13]. Interestingly, it has been reported that both transglutaminase and cytokeratin were down-regulated genes in ESCC in Chinese [14]. The clinical relevance of those two genes needs to be clarified. It is still unclear whether the disease process in young patients with ESCC is more aggressive and has a worse long-term outcome than in older patients [15,16]. It has been reported. that esophageal carcinogenesis differs between the young and the elderly [17]. Whether there is any significant difference in gene-expression profiling between young patients and older patients with ESCC needs to be explored in the future. In this study, tobacco smoking was defined as one pack or more per month; alcohol consumption was defined as consumption of at least one alcoholic beverage (equivalent to 125 mL of normal strength beer) per week; betel nut chewing was defined as consumption of at least 10 betel nuts per week [18]. The patient in this study was defined as an active tobacco smoker, alcohol drinker and betel nut chewer. A study of Taiwanese who smoke, drink alcohol and chew betel nut revealed that 89% of betel nut chewers also were tobacco smokers, and that 66% of male and 61% of female betel nut chewers also drank alcohol [18]. Clinically, it has been reported that the synergetic effect of betel nut and tobacco induces a higher risk of cancer of the oral cavity, pharynx, and esophagus [19,20]; however, relatively limited information is available on gene-expression profiling regarding the synergetic effect of these three habits on ESCC. We were able to profile the genes expressed in ESCC tissue occurring in one patient. In the near future, we will try to confirm the validity of the microarray results by qualitative reverse transcription-PCR and immunohistochemical evaluation of the gene products whose levels were assessed to be differentially expressed in normal and tumor cells in this patient. REFERENCES. 1. Kan T, Shimada Y, Sato F, et al. Gene expression profiling in human esophageal cancers using cDNA microarray. Biochem Biophys Res Commun 2001;286: 792-801. 2. Hu YC, Lam KY, Law S, et al. Identification of differentially expressed genes in esophageal squamous cell carcinoma (ESCC) by cDNA expression array: overexpression of Fra-1, Neogenin, Id-1, and CDC25B genes in ESCC. Clin Cancer Res 2001;7: 2213-21. 3. Xu SH, Qian LJ, Mou HZ, et al. Difference of gene expressioin profiles between esophageal carcinoma.
(5) Nan-Yung Hsu, et al.. and its pericancerous epithelium by gene clip. World J Gastroenterol 2003;9:417-22. 4. Lu J, Liu Z, Xiong M, et al. Gene expression profile changes in initiation and progression of squamous cell carcinoma of esophagus. Int J Cancer 2001;91:28894. 5. Tamoto E, Tada M, Murakawa K, et al. Geneexpression profile changes correlated with tumor progression and lymph node metastasis in esophageal cancer. Clin Cancer Res 2004;10:3629-38. 6. Kihara C, Tsunoda T, Tanaka T, et al. Predictioin of sensitivity of esophageal tumors to adjuvanat chemotherapy by cDNA microarray analysis of geneexpressioin profiles. Cancer Res 2001;61:6474-9. 7. Maeda S, Otsuka M, Hirata Y, et al. cDNA microarray analysis of helicobacter pylori-mediated alteration of gene expression in gastric cancer cells. Biochem Biophys Res Commun 2001;284:443-9. 8. Liang P, Averboukh L, Pardee AB. Distribution and cloning of eukaryotic mRNAs by means of differential display: refinements and optimization. Nucleic Acids Res 1993;21:3269-75. 9. Wooster R, Weber BL. Breast and ovarian cancer. N Engl J Med 2003;348:2339-47. 10. Yoshida M, Hayashi H, Taira M, et al. Elevated expression of the ornithine decarboxylase gene in human esophageal cancer. Cancer Res 1992;52:66715. 11. Hourihan RN, O'Sullivan GC, Morgan JG. Transcriptional gene expression profiles of oesophageal adenocarcinoma and normal oesophageal tissues. Anticancer Res 2003;23:161-5. 12. Kase S, Osaki M, Adachi H, et al. Expression of Fas and Fas ligand in esophageal tissue mucosa and. 47. carcinomas. Int J Oncol 2002;20:291-7. 13.Sun T, Miao X, Zhang X, et al. Polymorphisms of death pathway genes FAS and FASL in esophageal squamous-cell carcinoma. J Natl Cancer Inst 2004; 96:1030-6. 14. Luo A, Kong J, Hu G, et al. Discovery of Ca2+relevant and differentiation-associated genes downregulated in esophageal squamous cell carcinoma using cDNA microarray. Oncogene 2004;23:1291-9. 15. Tsai CH, Hsu HS, Wang LS, et al. Surgical results of squamous cell carcinoma of the esophagus in young patients. J Chin Med Assoc 2003;66:288-93. 16. Chen H, Yang Z, Li Y. Carcinomas of the esophagus and the cardia in young patients. J Thorac Cardiovasc Surg 1994;108:512-6. 17. Okuda E, Osugi H, Morimura K, et al. Detection of p53 gene mutation in human esophageal squamous cell carcinomas using a p53 yeast functional assay: possible difference in esophageal carcinogenesis between the young and elderly group. Clin Cancer Res 2001;7:600-6. 18. Liang WM, Kuo HW, Wang CB. Prevalence of tobacco smoking, drinking and betel nut chewing among Taiwanese workers in 1999. Mid Taiwan J Med 2002;7:146-54. 19. Wu MT, Wu DC, Hsu HK, et al. Relationship between site of oesophageal cancer and areca chewing and smoking in Taiwan. Br J Cancer 2003;89:1202-4. 20. Znaor A, Brennan P, Gajalakshmi V, et al. Independent and combined effects of tobacco smoking, chewing and alcohol drinking on the risk of oral, pharyngeal and esophageal cancers in Indian men. Int J Cancer 2003;105:681-6..
(6) 48. 1. 2 1. 32. 2. 10 cDNA 8354. 26 7. 5. 28. 5. 28. 26. 8 2005;10:43-8. 404. 2. 2004. 9. 30. 2004. 11. 26. 2004. 11. 16.
(7)
數據

相關文件
The resulting color at a spot reveals the relative levels of expression of a particular gene in the two samples, which may be from different tissues or the same tissue under
Normalization by the number of reads in the sample, or by calculating a Z score, should be performed on the reported read counts before comparisons among samples. For genes with
Employment of Foreign Workers, overseas Chinese students shall meet the student status regulated in the Regulations on Study and Counseling Assistance in Taiwan for
By correcting for the speed of individual test takers, it is possible to reveal systematic differences between the items in a test, which were modeled by item discrimination and
With new ICE trains crossing Europe at speeds of up to 300 km/h, sound and vibration levels in the trains are an important issue. Hilliges/Mehrmann/Mehl(2004) first proposed
The increasing charges of medical services, rising prices in jewellery and air tickets pushed the indices of Health; Other goods and services; and Transport and communications up
A Boolean function described by an algebraic expression consists of binary variables, the constant 0 and 1, and the logic operation symbols.. For a given value of the binary
北京中醫藥大學 天津中醫藥大學 上海中醫藥大學 遼寧中醫藥大學 南京中醫藥大學 浙江中醫藥大學 廈門大學 福建中醫藥大學 江西中醫藥大學 暨南大學
