Propagation of acoustic waves in phononic-crystal plates and waveguides
using a finite-difference time-domain method
Jia-Hong Sun and Tsung-Tsong Wu*
Ultrasonics Laboratory, Institute of Applied Mechanics, National Taiwan University, Taipei 106, Taiwan 共Received 12 February 2007; revised manuscript received 10 August 2007; published 17 September 2007兲
Propagation of acoustic waves in a phononic-crystal plate and related waveguides are analyzed in this paper. A two-dimensional phononic-crystal plate consisting of circular steel cylinders which form a square lattice in an epoxy matrix is studied first using the finite-difference time-domain共FDTD兲 method. The Bloch theorem is employed to deal with the periodic condition, and the traction free condition is set on the top and bottom boundaries of the plates. The dispersion curves and displacement fields are calculated to identify the band gaps and eigenmodes. With the existence of a complete band gap in the phononic-crystal plate, an acoustic wave-guide is presented accordingly. Eigenmodes of acoustic waves inside the wavewave-guides are indicated, and the modes are affected by the geometry arrangement of waveguides. Inside the phononic-crystal plate waveguides, wave propagation is well confined within the structure.
DOI:10.1103/PhysRevB.76.104304 PACS number共s兲: 63.20.⫺e, 43.20.⫹g, 43.40.⫹s, 46.40.Cd
I. INTRODUCTION
Phononic crystals have attracted much academic interest in their property of band gaps during the past decade. A band gap is the frequency range that acoustic waves cannot propa-gate in a periodic structure. The bulk acoustic waves共BAWs兲 in the unbounded phononic crystals1–3and the surface
acous-tic waves 共SAWs兲 in the phononic crystals with a free surface4–8 were analyzed. In these studies, band gaps of
BAW and SAW were observed. Furthermore, complete band gaps that BAW and SAW are forbidden to propagate in any direction were also analyzed. With the properties of complete band gaps, many applications of phononic crystals were de-signed accordingly, such as elastic wave filters, couplers,9
and waveguides.9–13A phononic-crystal waveguide is an
im-portant elementary component to build an acoustic wave cir-cuit. In fact, to construct the SAW waveguides is more prac-tical because the unbounded BAW waveguide is difficult to realize. However, the possible energy loss of pseudosurface acoustic wave 共PSAW兲 in the SAW waveguides is another considerable issue.14,15
Recently, the acoustic wave propagation in the two-dimensional phononic-crystal structure with a finite thick-ness referred to as a phononic-crystal plate was studied.16,17 The plate is constructed by periodic arranged elastic materi-als with two free surfaces. Unlike the PSAW in semi-infinite phononic-crystal media that allows energy leakage, the finite plate thickness keeps acoustic waves inside the structure. In this paper, we study the characteristics of acoustic wave propagating in the phononic-crystal plates and the related waveguides. The FDTD method is developed to analyze the dispersion of acoustic wave in the phononic-crystal plates. The Bloch theorem and traction free conditions are em-ployed to deal with the periodic boundary condition and the top and bottom surfaces of plates, respectively. A steel/epoxy square lattice phononic-crystal plate is studied, and complete band gaps of acoustic wave are obtained. With the properties of the complete band gaps, a phononic waveguide is de-signed by arranging adjacent point defects. The eigenmodes of acoustic waves inside waveguides are indicated and the
acoustic waves propagating inside the straight waveguide are demonstrated. The results show that the allowed surface waves can be propagated and well confined within the wave-guide.
II. ACOUSTIC WAVES IN A PHONONIC-CRYSTAL PLATE The FDTD method had been developed to analyze the BAW in infinite phononic crystals18,19 and SAW in
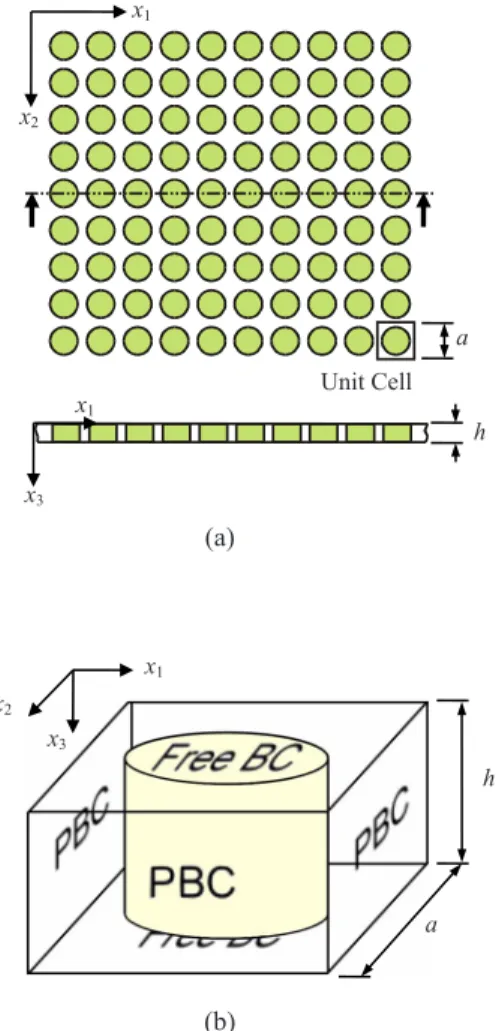
semi-infinite structures.14,15This method has the flexibility to con-struct a variety of two-dimensional 共2D兲 and three-dimen-sional共3D兲 periodic structures, and the phenomena of acous-tic waves propagating inside the structures can be investi-gated. A typical phononic-crystal plate is shown in Fig.1共a兲. The cylindrical inclusions are arranged to form a square lat-tice on the x1-x2plane. The lattice constant of the phononic crystal is denoted by a. In the x3-axis direction, the thickness of the plate is defined by h, and the normal of the free sur-faces of the plate is in the x3axis. To analyze acoustic waves in a phononic-crystal plate, the periodic boundary condition based on Bloch’s theorem and the traction free surface con-dition for the free surfaces are applied in the FDTD method. The FDTD method for acoustic waves is developed from the equations of motion and the constitutive law of elastic materials. They are expressed as
u¨i=ij,j+fi, 共1兲
ij= Cijklkl, 共2兲
whereis the density of materials, uiis the displacement,ij
is the stress, fiis the body force, Cijklis the elastic constant,
andkl is the strain. With the definition of staggered grids,
differential equations共1兲 and 共2兲 are transferred into
differ-ence equations based on Taylor’s expansion, and then the 3D heterogeneous finite-difference formulation is developed. By arranging the densities and elastic constants, these equations are applicable to the inhomogeneous structure of phononic crystals. Bloch’s theorem is then introduced to treat the pe-riodic boundary condition of a unit cell of the phononic
crystals.18The direct periodic boundary conditions共PBCs兲 in
terms of the displacement uiand the stressijare defined as19 ui共x + a,t兲 = eik·aui共x,t兲, 共3兲
ij共x + a,t兲 = eik·aij共x,t兲, 共4兲
where k is a wave vector, and a is a lattice translation vector. Further, the traction free condition is defined on the top and bottom surfaces of the plates:
兩3j共x,t兲兩x3=0=兩3j共x,t兲兩x3=h= 0. 共5兲 Figure1共b兲is the unit cell of the square lattice phononic-crystal plates, and the setting definitions of the boundaries are applied to the FDTD method. With the periodic boundary condition, the unbounded periodic structures can be analyzed by calculating a unit cell; furthermore, the property of phononic-crystal plates is available with the definition of traction free surfaces. In the unit cell, a small disturbance in a random position is set as the initial condition. Thus, all possible wave modes are excited inside the considered phononic-crystal plate. The time-varying displacement is re-corded during the calculations, and the Fourier
transforma-tion is then performed to obtain the frequency spectrum. The eigenfrequencies of a given wave vector k are indicated by selecting the resonance peaks of the spectrum.
In this paper, a square lattice phononic-crystal plate con-sisting of steel cylinders embedded in an epoxy matrix is analyzed, and then it is also used to construct the waveguides. The material constants used in calculation are = 7900 kg/ m3, C11= 280.2 GPa, and C44= 82.9 GPa for steel, and those for epoxy are = 1180 kg/ m3, C11 = 7.61 GPa, and C44= 1.59 GPa. To calculate the eigenmodes of acoustic waves in the phononic-crystal plate, the unit cell in Fig.1共b兲is defined. The cross section on the x1-x2plane is 1a⫻1a, and a is the lattice constant. a is divided into 48 grids in this study. The lattice constant a of the phononic crystal is defined as 8 mm, and the radius r of steel cylinder is 3 mm. Thus, a time step interval of 10 ns in the FDTD calculation is sufficient to satisfy the numerical stability con-dition.
In this case, the filling fraction, defined asr2/ a2, equals to 0.442. In general, the eigenmodes of acoustic waves in phononic crystals are decided by the filling fraction, while the materials and geometry conditions 共i.e., lattice symme-try兲 are chosen. However, the values of the eigenfrequencies of acoustic waves in the phononic-crystal plates are not only a function of filling fraction but also the plate thickness.16,17
In this paper, we chose the thickness h as 0.25a for the fol-lowing study of waveguides.
To investigate the band gap of the phononic-crystal plate, the dispersion relations of acoustic waves are calculated first. Although the phononic-crystal plate is actually a 3D prob-lem, the wave propagation is mainly confined within the
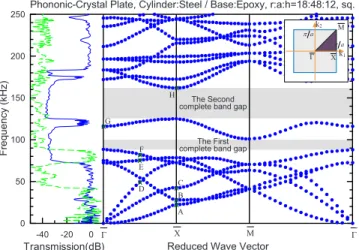
x1-x2plane. Thus, the first Brillouin zone and the denotation of the smallest irreducible area in k space for 2D cases are inherited here; moreover, the denotations are denoted with a bar on top to present the surface Brillouin zone symmetry points. The dispersion is shown in Fig.2and inset is the first Brillouin zone. In Fig.2, there are three developing bands starting from the zero frequency to higher frequency range which are similar to the results of BAW.15 In addition, two
noticeable complete band gaps appear from 89 to 101 kHz and 125 to 162 kHz, respectively.
In an unbounded 2D phononic crystal, the structure is infinite along the x3 direction. Thus, the BAW propagating within the x1-x2 plane can be decoupled into the in-plane modes 共x1-x2 plane兲 and the antiplane modes. However, in the phononic-crystal plate, the eigenmodes cannot be classi-fied in the same way. The modes in the phononic-crystal plates are coupled, and they are identified as flexural 共anti-symmetric兲, longitudinal 共symmetric兲, and transverse 共shear horizontal兲 waves such as Lamb waves in the classical plates. To investigate the acoustic wave modes in the dispersion, the transmission of waves and the polarization of specific modes are analyzed. First, to launch a wide frequency wave packets along⌫¯X¯ direction, line sources of x2 and x3 polar-izations are defined on the plate surface, respectively. The acoustic waves propagating through a ten-layered phononic-crystal plate and a homogeneous plate without steel cylinders are recorded and compared with each other to calculate the transmission. The corresponding results are plotted in the left
(b) (a) x1 x3 h x1 x3 x2 h a x1 x2 Unit Cell a
FIG. 1. 共Color online兲 共a兲 The phononic-crystal plate with cir-cular cylinders embedded in a background material arranged in a square lattice.共b兲 The unit cell of the phononic-crystal plate and setting of boundary conditions.
part of Fig. 2. When the wave is generated from the
x3-direction polarized source, the gaps appear at 72–116, 125–172, and 176– 183 kHz, shown by the solid line. The dotted line presents that, when the wave is generated from the x2-polarized source, the passbands are between 73– 87 kHz and the range below 43 kHz. Compared to the dispersion of⌫¯X¯-direction, these two transmission distribu-tions show a consistent result with the band structure, except a deaf band that can be observed on the top of the second complete band gap.
The displacement distribution inside the unit cell is calcu-lated to investigate the eigenmodes of acoustic waves. The setup is the same as Fig.1共a兲but the initial condition is now replaced by a monochromatic wave source. The source gen-erates a wave package with the chosen eigenfrequency, and the corresponding wave vector is set at the periodic boundary condition. By assigning both of the wave vector and the fre-quency, the specific eigenmode is, therefore, excited, and the displacement field is recorded to identify the modes.
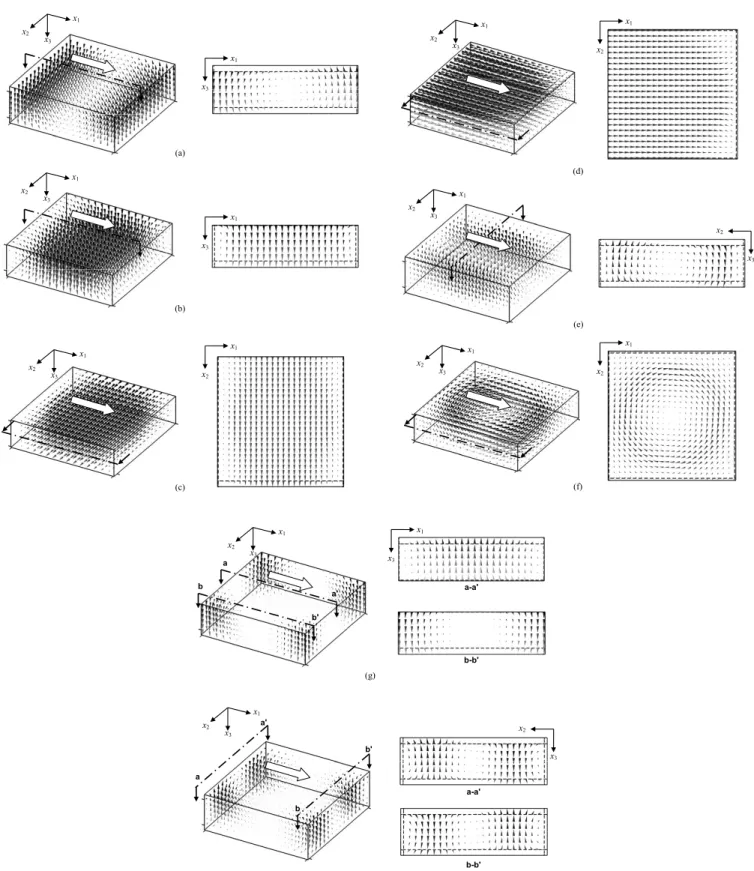
The displacement distributions of the eigenmodes which belong to the first seven bands at⌫¯X¯ direction are plotted in Fig.3to investigate the wave propagating inside the plate. In these 3D plots, the directions of cones indicate the direction of displacement vector, and the sizes of the cones reflect the magnitudes of displacement vectors. First, the eigenmodes of wave vector k =共/ a , 0兲 with frequencies f =22.5 kHz 共point
A in Fig.2兲 and f =28 kHz 共point B in Fig.2兲 are calculated,
and the displacement distributions are shown in Figs. 3共a兲 and3共b兲. These two modes belong to the lowest band and its folded band with the same wave vector. Since the wave-length of the first band with兩k兩=/ a is 2a, and thus, only one-half of the periodic displacement field is shown. In these two cases, the displacement fields are almost invariant along the x2axis. The 3D vector plots show the displacement dis-tribution inside a unit cell. Additional 2D figures are also plotted for clearer understanding. The 2D figures show the
polarizations along the plane which is parallel to x1-x3 plane and passing through the center of the steel cylinder. Obvi-ously, the displacement components u1 and u3 dominate the behavior of these modes, which are basically corresponding to the lowest flexural mode in a plate.
The next eigenmode belongs to the second band in the phononic-crystal plate, and it has a wave vector k =共/ a , 0兲 and f =42.5 kHz 共i.e., point C in Fig.2兲. The
dis-placement field on the plate at x3= h / 2 is shown in Fig.3共c兲. The eigenmode has a primary polarization in the x2direction. This is the lowest mode of horizontally polarized shear wave that the distribution does not vary obviously along thickness. The case of the third band has a vector k =共/ 2a , 0兲 and
f = 49.5 kHz共i.e., point D in Fig.2兲. The mode has a higher
phase velocity than the previous two bands. The distribution of the displacements is shown in Fig.3共d兲, and the polariza-tion on the plane x3= h / 2 of the plate is also plotted. The polarization in this case is mainly along the x1direction, and the field does not have a large change along the thickness of the plate. This means it is the lowest longitudinal mode.
The modes of the next two bands are the waves of k =共/ 2a , 0兲 with f =75.5 kHz 共point E in Fig. 2兲 and f
= 82 kHz共point F in Fig.2兲, respectively. For the mode of
point E, the slice of typical displacement field is parallel to the x2-x3 plane and passes through the center of the steel cylinder, as shown in Fig.3共e兲. The polarization remains at the x2-x3 plane but the magnitude also varies with the x1 direction. Basically, this mode has x3 components, but they are antisymmetric with respect to the x1-x3plane passing the center of the unit cell. Thus, this band cannot be excited by the x3-polarization line source, as shown in the transmission of Fig.2. The result of point F is shown in Fig.3共f兲, and this band determines the lower boundary of the first complete band gap. The displacement distribution shows a circular po-larization pattern on the plate at x3= h / 2, and this band is excitable by the x2-polarization source.
The next mode shown in Fig. 3共g兲 is the mode with k =共0,0兲 and f =116 kHz 共point G in Fig.2兲 which exists in
between the two complete band gaps. The normalized dis-placement fields of two slices a-a
⬘
and b-b⬘
are plotted, re-spectively, in order to show the polarization clearly. Basi-cally, the displacement field shows the property as a flexural mode in a plate, similar to the case shown in Fig.3共b兲, but the field varies significantly along the x2direction.Finally, an example of the deaf band observed in the transmission is calculated. The mode of k =共/ a , 0兲 and f = 162 kHz 共point H in Fig. 2兲 is shown in Fig. 3共h兲, and normalized displacement distributions of the unit cell and the two slices a-a
⬘
and b-b⬘
are plotted. The displacement field is antisymmetric with respect to the x1-x3 plane passing through the central line of the unit cell. The x3component is antisymmetric and the x2component shows two opposite di-rections across the unit cell. Thus, neither the x2polarization nor the x3 polarization line sources on the plate surface can excite this wave, and this band is identified as a deaf band.Compared to the results of BAW reported in Ref.15, the complete band gaps of BAW are at 90–143 and 153– 204 kHz; the phononic-crystal plate has narrower com-plete band gaps than ones of BAW in the 2D case of the
-40 -20 0 Transmission(dB) 0 50 100 150 200 250 Fr e q uenc y (kH z)
Phononic-Crystal Plate, Cylinder:Steel / Base:Epoxy, r:a:h=18:48:12, sq.
Γ X M Γ
Reduced Wave Vector
k1 k2 M Γ X a π a π The First complete band gap
The Second complete band gap
A D C B E F G H
FIG. 2. 共Color online兲 Band structure of the steel/epoxy phononic-crystal plate with square lattice. The filling fraction is 0.442 and plate thickness is 0.25a. The transmission of acoustic waves along⌫¯X¯ direction is also plotted on the left part. The solid and dotted lines present result of wave sources polarized along the x3and x2directions, respectively.
same filling fraction. We calculated dispersion relations of phononic-crystal plates with the same filling fraction but dif-ferent thicknesses. The thickness varies from 0.125a to 1.5a,
and all the complete band gaps are smaller than those of the BAW. In these analyzed cases, the maximum complete band gaps belong to the case of thickness h = 0.875a, and the
x1 x3 (b) x1 x3 x1 x3 x2 x1 x3 x2 x1 x2 x1 x3 x2 (a) (c) (d) x1 x2 x1 x3 x2 x1 x3 x2 x2 x3 (e) x1 x3 x2 x1 x2 (f) (g) b-b' x1 x3 a-a' x1 x3 x2 a' a b' b (h) x1 x3 x2 a' a b' b b-b' x2 x3 a-a'
FIG. 3. The displacement fields of eigenmodes. The ticks on axes and dashed lines indicate the boundaries of the unit cells.共a兲 k =共/a,0兲, f =22.5 kHz 共point A of Fig.2兲; 共b兲 k=共/a,0兲, f =28 kHz 共point B of Fig.2兲; 共c兲 k=共/a,0兲, f =42.5 kHz 共point C of Fig.2兲;
共d兲 k=共/2a,0兲, f =49.5 kHz 共point D of Fig.2兲; 共e兲 k=共/2a,0兲, f =75.5 kHz 共point E of Fig.2兲; 共f兲 k=共/2a,0兲, f =82 kHz 共point F of
ranges are 90–134 and 146– 190 kHz. The calculation shows that in these phononic-crystal plates, the bands of longitudi-nal waves 共the band of point D in Fig. 2兲 and transverse
waves 共the bands of points C and F in Fig. 2兲 appear at
similar ranges. Thus, the plate thickness does not alter the gaps of these two types of waves. However, the flexural modes共the bands of points A, B, E, G, and H in Fig.2兲 in the
plates are affected by the thicknesses. In a thinner plate, the lowest flexural mode shifts toward the lower frequency range. Thus, the folded bands above the gaps of longitudinal and transverse waves shift downward and narrow the gap width. For a thicker plate, the cutoff frequency of higher order flexural modes is lowered, and then, the higher order modes appear at the range of the band gap. Therefore, the phononic-crystal plates usually have narrower complete band gaps than those of the 2D phononic crystal at the same filling fraction.
In brief, the dispersion curves, the transmissions, and the displacement distribution of the eigenmodes can be analyzed by the FDTD method. The displacement analyses help iden-tify the polarizations of acoustic wave modes and verify the results of transmissions. In this phononic-crystal plate, the acoustic waves have not only similar modes as the Lamb modes in a classical plate but also some more complex modes because of the periodic cylinders. Furthermore, with a plate thickness as thin as 0.25a, the acoustic waves of the higher modes which vary along the thickness do not appear at the concerned frequency range. This simplifies the band structure and results in the obvious complete band gaps. Fi-nally, the steel/epoxy phononic-crystal plate shows complete band gaps, and then it can be employed to create a wave-guide in the next section.
III. ACOUSTIC WAVES IN A PHONONIC-CRYSTAL PLATE WAVEGUIDE
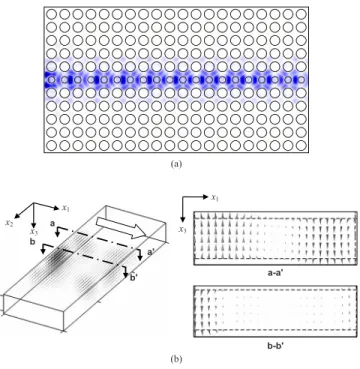
A waveguide is one of the important applications of phononic crystals for its unique role in acoustic circuits. To construct a waveguide, continuous point defects are defined in the phononic-crystal structure, as shown in Fig. 4共a兲. These defects form an area without scatters, i.e., the cylin-ders, and thus, the acoustic waves can propagate accordingly. Currently, most studies focus on the BAW in phononic-crystal waveguides, and few analyses of SAW in waveguides are reported. In this section, the acoustic waveguides in the phononic-crystal plates are analyzed with the FDTD method. A phononic-crystal waveguide is formed based on the complete band gaps of acoustic waves. In the steel/epoxy phononic-crystal plate presented in Sec. II, there exist com-plete band gaps in 89–101 and 125– 162 kHz. Thus, the plate can be used to create waveguides. Inside the waveguides, acoustic waves cannot penetrate across the boundaries. The existence of waveguides means that the defects are created in the perfect phononic-crystal structure, and thus the pass-bands are splitting off from its original value. At the bottom of a band gap, the gap-edge band splits into a higher fre-quency mode into the band gap. Similarly, the gap-edge band at the top of a band gap also splits into the band gap. Thus, these split modes contribute to defect modes 共or guided
modes兲 in the waveguides, and the defect modes will appear at the range of complete band gaps.20
In the FDTD method, the supercell technique is used to analyze the dispersion of a waveguide. A supercell is defined by combining several unit cells and then the whole supercell is treated as a basic cell in the analysis. As shown in Fig.
4共a兲, a supercell for the waveguides is chosen to contain the defect area and extra ten unit cells. Therefore, according to the definition of the supercell, there are ten rows of periodic phononic-crystal structure between two waveguides in our analysis. After defining the supercell and using the similar boundary conditions shown in Fig.1共b兲, the wide band wave sources are then excited and the eigenmodes are analyzed by selecting the local maximum peaks from the Fourier trans-formed spectra as the procedure for a unit cell in Sec. II.
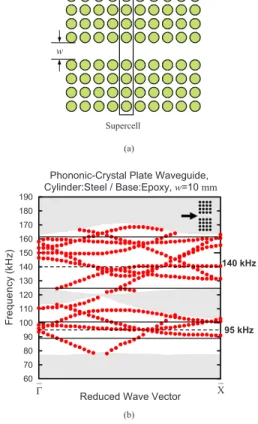
First, we consider a waveguide with a width w = 10 mm, i.e., the distance between two neighboring cylinders on both sides of a waveguide. This means that one row of cylinders in the supercell is removed from the perfect periodic struc-ture. Thus, a supercell of phononic-crystal plate consisting of 11 unit cells is defined to calculate eigenmodes of wave-guide. The dispersion of the waveguide of w = 10 mm in the plate is obtained and shown in Fig.4共b兲with an inset on the top right to present the structure. This figure is focused on the frequency range of 60– 190 kHz to observe defect modes in the complete band gaps, and the boundaries of complete band gaps are marked with horizontal solid lines. In the waveguide, there are numerous extended modes at the
pass-Supercell w (a) 100 150 60 70 80 90 110 120 130 140 160 170 180 190 Fr e q u e n c y (kH z )
Phononic-Crystal Plate Waveguide, Cylinder:Steel / Base:Epoxy,w=10 mm
_
Γ Reduced Wave Vector X_ (b)
95 kHz 140 kHz
FIG. 4. 共Color online兲 共a兲 Top view of a waveguide in the phononic-crystal plate and the supercell. 共b兲 Band structure of acoustic waves in the steel/epoxy phononic-crystal plate waveguide of width w = 10 mm.
band of the phonic crystal, i.e., outside the range of complete band gaps. In this case, they appear at the range below 79 kHz, the range of 101– 125 kHz, and the range above 162 kHz. These modes are not concerned and the regions are presented in gray.
In the band structure of acoustic waves in the phononic-crystal plate shown in Fig. 2, band gaps at ⌫¯X¯ direction appear at 89–116 and 125– 162 kHz. However, a passband locates at 101– 125 kHz along the X¯ M¯ direction; therefore, the first complete band gap is actually in the range 89– 101 kHz. In this case, acoustic waves propagating to-ward ⌫¯X¯ direction have a larger partial band gap than the complete band gap. The additional partial band gap cannot result in useful guided waves because the acoustic waves at that frequency range will leave the waveguide along the⌫¯M¯ direction. In Fig.4共b兲, the band structure of the waveguide is analyzed along the ⌫¯X¯ direction, and the result shows that extended bands are allowed in the frequency range of 101– 125 kHz, instead of the range of 116– 125 kHz. This verifies the necessary of complete band gaps to form a wave-guide. Besides, the upper limit of the lowest extended band in Fig.4共b兲is not 89 kHz, which is the highest value of sixth band at the ⌫¯X¯ direction shown in Fig. 2, but the highest value 79 kHz of the fifth band. The reason is that, as shown in Fig.3共f兲, the acoustic waves of the sixth band polarized around the cylinder, and thus the mode does not appear in the waveguide. As a result, the useful frequency range for con-structing the waveguides is still the same as the complete band gaps. Besides, some branches of the guided modes ex-tend from the complete band gaps to the outside range. Acoustic waves that belong to these modes outside the com-plete band gaps can be excited. However, they convert into other transmission modes and propagate away from the waveguide when these modes encounter the waveguide boundaries. Thus, the modes outside the complete band gap still do not contribute to well propagation of waves in the waveguides.
In Fig. 4共b兲, there are 13 recognizable defect bands ap-pearing in the complete band gaps. We did not examine all of the defect bands of phononic-crystal waveguides to indicate if they are active or deaf. In general, numerous defect bands at the same frequency range support the acoustic waves to propagate inside the waveguide. In the FDTD method, an area of 20a⫻11a is defined and the waveguide of w = 10 mm is constructed to demonstrate the wave propagation. A monochromatic line source is set in the left-hand inlet of the waveguide and the acoustic waves propagate toward the right hand side. As illustrating cases, the waves generated from 95 and 140 kHz sources with the x3 polarization are calculated. These two frequencies belong to the first and the second complete band gaps, respectively. The result shows that wave propagation is confined within the scatter-free area. Therefore, these two complete band gaps are applicable to construct waveguides. These frequencies are marked with dashed lines in Fig.4共b兲, and the figure shows that both the monochromatic wave sources of 95 and 140 kHz can excite multiple defect modes inside the waveguide. Thus, the am-plitude distribution shows a complicated pattern, not a simple harmonic wave.
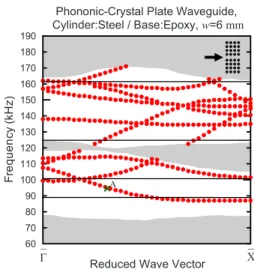
However, a waveguide with a single mode or fewer defect modes is much preferred for some further applications. In the study of BAW in 2D phononic-crystal waveguide which has a narrower width allows fewer defect modes.9,11In this study, we also depress the number of defect modes by reducing the width of the waveguide. The narrowed waveguides with a width w = 6 mm is analyzed, and the band structures are pre-sented in Fig. 5. In the dispersion relations, the number of the bands at the range of complete band gaps is reduced from 13 to 10. In the first complete band gap, 89– 101 kHz, there are only two bands of defect modes. Similar to the above-mentioned procedure, a 95 kHz wave source is set in the inlet of waveguide to investigate the propagation of acoustic wave. In this case, the amplitude distribution on the surface at x3= 0 is shown in Fig.6共a兲. In the plot, darker color means larger amplitude. The acoustic wave propagation inside the waveguide has a simple pattern. From the dispersion, the defect mode is marked as point A in Fig.5and it belongs to a folded band. We found that the corresponding wave vector k is共1.69/ a , 0兲, and thus the wavelength is about 1.18a, which agrees with result of the displacement pattern. The characteristic displacement field is also plotted in Fig.6共b兲. The 3D vector plot shows a full view of the waveguide, and the 2D figure of the cross section at the center of waveguide helps identify the wave as a flexural mode. This mode shows symmetric x3component with respect to the x1-x3plane pass-ing through the central line of the waveguide, and thus it is excitable by the line source of flexural waves.
The acoustic waves perform fewer bands in the wave-guides with 6 mm width at the first complete band gap. However, there are still numerous defect modes at the second complete band gap of 125– 162 kHz. Further, we calculate another narrowed waveguide of width w = 4 mm. This means the waveguide results from an additional space of one-quarter of a lattice constant between adjacent unit cells. The band structure is calculated and shown in Fig.7. Because of the extremely narrowed width, there are only six bands in-side the waveguide. Both two complete band gaps have simple band structures, and in addition, the range of 93– 101 kHz in the first complete band gap allows no defect
100 150 60 70 80 90 110 120 130 140 160 170 180 190 F re quen c y (k H z )
Phononic-Crystal Plate Waveguide,
Cylinder:Steel / Base:Epoxy,w=6 mm
_
Γ X_
Reduced Wave Vector
A
FIG. 5. 共Color online兲 Band structure of acoustic waves in the steel/epoxy phononic-crystal plate waveguides of width w = 6 mm.
modes. The consistent phenomenon is obtained because we observed that the 95 kHz waves cannot propagate into the waveguide. Thus, more defect modes are depressed by con-structing a narrower width waveguide, and the width of the waveguide cannot be too small in practice for the acoustic wave propagation.
Although the waveguides with a narrowed width have fewer modes, however, these waveguides are no longer sisted of the multiply unit cells. This is inconvenient to con-struct an acoustic circuit in a periodic phononic crystal, es-pecially to create a bend waveguide. We proposed another modified waveguide by inserting scatters in the center of waveguides, as shown in Fig. 8共a兲. The waveguide has a width of 10 mm and the scatters in the center of the
wave-guide have a smaller diameter of 4 mm. This means that one row of cylinders in the phononic-crystal plate is replaced by the smaller ones in radius. Thus, the waveguide is consisted of multiply unit cells. After defining the corresponding su-percell, the band structure of the waveguides is calculated and presented in Fig.8共b兲. In the dispersion diagram, there are 11 bands of defect modes in the complete band gaps. However, there is a single-mode band range from 130 to 142 kHz at the second complete band gaps. In addi-tion, there is a forbidden gap at 125– 130 kHz. We demon-strated the propagation of the 136 kHz acoustic wave in Fig.
9共a兲. From the corresponding mode marked as point A in the dispersion curve, the wave vector k is共0.5/ a , 0兲, and thus the wavelength is 2a. The amplitude field of the wave is affected by the scatters, but the periodic pattern satisfies the foregoing calculation. The characteristic displacement field of this mode is shown in Fig. 9共b兲. In addition to the 3D vector plot, two 2D figures of the cross section at the center of waveguide and a half lattice constant away from the center are also plotted. The sizes of cones in these 2D figures are normalized independently. From these displacement patterns, the wave is also identified as a flexural mode and the polar-ization varies along the x2 direction. Since the polarization x1 x3 (a) (b) x1 x3 x2
FIG. 6. 共Color online兲 共a兲 Amplitude distribution of the 95 kHz acoustic wave共point A in Fig.5兲 on the surface of the linear
wave-guide. 共b兲 The displacement fields of the eigenmode point A in Fig.5. 100 150 60 70 80 90 110 120 130 140 160 170 180 190 Fr e q u e n c y (kH z )
Phononic-Crystal Plate Waveguide,
Cylinder:Steel / Base:Epoxy,w=4 mm
_
Γ Reduced Wave Vector X_
FIG. 7. 共Color online兲 Band structure of acoustic waves in the steel/epoxy phononic-crystal plate waveguides of width w = 4 mm.
Supercell w d (a) (b) 100 150 60 70 80 90 110 120 130 140 160 170 180 190 F re q uen c y (k Hz )
Phononic-Crystal Plate Waveguide
with scatters of d=4mm,
Cylinder:Steel / Base:Epoxy, w=10 mm
_
Γ X_
Reduced Wave Vector
A
FIG. 8.共Color online兲 共a兲 Top view of a waveguide with scatters in the phononic-crystal plate and the supercell.共b兲 Band structure of acoustic waves in the steel/epoxy phononic-crystal plate waveguide of width w = 10 mm with the scatters of diameter d = 4 mm.
shows symmetry with respect to the central plane共the x1-x3 plane兲 of the waveguide, the mode is excited by the line source of x3polarization. Indeed, the single-mode frequency range is useful for further applications. For example, an acoustic wave coupler can be designed based on this prop-erty.
Finally, the phononic-crystal plate of the inserted scatters, the lattice constant a = 8 mm, thickness h = 2 mm, and cylin-ders of 4 mm in diameter, has also been analyzed. The dis-persion relation shows that there is only one complete band gap, the first one, at 101– 112 kHz. The second complete
band gap observed in Fig. 2 vanishes because other high frequency modes move downward. Obviously, the single row scatters do not act as the perfect phononic crystal. The band gaps and extended modes are still dominated by the original phononic-crystal plate but the scatters change the defect modes inside the waveguides.
IV. CONCLUSION
In this paper, we have applied the FDTD method to ana-lyze acoustic wave propagation in phononic-crystal plates and waveguides. Combining the free surface condition and PBC, the band structure of the 2D phononic-crystal plate is calculated and the steel/epoxy phononic-crystal plate shows two complete band gaps. By investigating the displacement fields of eigenmodes, the modes similar to the one of a clas-sical plate and some different modes resulted from the peri-odic structure are identified. Furthermore, wave-guides based on the complete band gaps of a phononic-crystal plate are constructed. Inside the phononic-phononic-crystal plate, the waveguides have numerous defect modes that acoustic waves can propagate in. To modulate the defect modes of waveguides, the waveguides with narrowed width were calculated and the modes were depressed by the con-straint. Besides, the defect modes are also changed by intro-ducing scatters inside the waveguides. Finally, the phononic-crystal plate has a limit size in thickness which is practicable to be manufactured, and the acoustic wave is confined with the structure without the possibility of propagating away. Thus, it has potential to realize acoustic circuits on the phononic-crystal plates.
ACKNOWLEDGMENT
The authors acknowledge the financial support of this re-search by the National Science Council of ROC 共NSC 96-2221-E-002-206-MY3兲.
*Corresponding author. [email protected]
1M. S. Kushwaha, P. Halevi, L. Dobrzynski, and B.
Djafari-Rouhani, Phys. Rev. Lett. 71, 2022共1993兲.
2M. S. Kushwaha, P. Halevi, G. Martinez, L. Dobrzynski, and B.
Djafari-Rouhani, Phys. Rev. B 49, 2313共1994兲.
3M. S. Kushwaha and P. Halevi, Appl. Phys. Lett. 64, 1085
共1994兲.
4Y. Tanaka and S. I. Tamura, Phys. Rev. B 58, 7958共1998兲. 5Y. Tanaka and S. I. Tamura, Phys. Rev. B 60, 13294共1999兲. 6T.-T. Wu, Z.-G. Huang, and S. Lin, Phys. Rev. B 69, 094301
共2004兲.
7T.-T. Wu, Z.-C. Hsu, and Z.-G. Huang, Phys. Rev. B 71, 064303
共2005兲.
8V. Laude, M. Wilm, S. Benchabane, and A. Khelif, Phys. Rev. E 71, 036607共2005兲.
9J.-H. Sun and T.-T. Wu, Phys. Rev. B 71, 174303共2005兲. 10M. Kafesaki, M. M. Sigalas, and N. García, Phys. Rev. Lett. 85,
4044共2000兲.
11A. Khelif, B. Djafari-Rouhani, J. O. Vasseur, and P. A. Deymier,
Phys. Rev. B 68, 024302共2003兲.
12A. Khelif, B. Djafari-Rouhani, J. O. Vasseur, P. A. Deymier, Ph.
Lambin, and L. Dobrzynski, Phys. Rev. B 65, 174308共2002兲.
13Y. Pennec, B. Djafari-Rouhani, J. O. Vasseur, A. Khelif, and P. A.
Deymier, Phys. Rev. E 69, 046608共2004兲.
14Y. Tanaka, T. Yano, and S. I. Tamura, Wave Motion 44, 501
共2007兲.
15J.-H. Sun and T.-T. Wu, Phys. Rev. B 74, 174305共2006兲. 16J.-C. Hsu and T.-T. Wu, Phys. Rev. B 74, 144303共2006兲. 17A. Khelif, B. Aoubiza, S. Mohammadi, A. Adibi, and V. Laude,
Phys. Rev. E 74, 046610共2006兲.
18Y. Tanaka, Y. Tomoyasu, and S. I. Tamura, Phys. Rev. B 62, 7387
共2000兲.
19P.-F. Hsieh, T.-T. Wu, and J.-H. Sun, IEEE Trans. Ultrason.
Fer-roelectr. Freq. Control 53, 148共2006兲.
20I. E. Psarobas, N. Stefanou, and A. Modinos, Phys. Rev. B 62,
5536共2000兲. (a) (b) x1 x3 x2 a' a b' b x1 x3 a-a' b-b'
FIG. 9.共Color online兲 共a兲 Amplitude distribution of the 136 kHz acoustic wave 关point A in Fig.8共b兲兴 on the surface of the linear
phononic-crystal plate waveguide with scatters.共b兲 The displace-ment fields of the eigenmode point A in Fig.8共b兲.