PLEASE SCROLL DOWN FOR ARTICLE
On: 27 November 2009
Access details: Access Details: [subscription number 908165592]
Publisher Taylor & Francis
Informa Ltd Registered in England and Wales Registered Number: 1072954 Registered office: Mortimer House,
37-41 Mortimer Street, London W1T 3JH, UK
Journal of Environmental Science and Health, Part B
Publication details, including instructions for authors and subscription information:
http://www.informaworld.com/smpp/title~content=t713597269
Use of residence time distribution for evaluation of gaseous pollutant
volatilization from stored swine manure
Chung-Min Liao
aa
Department of Agricultural Engineering, National Taiwan University, Taipei, Taiwan R.O.C.
To cite this Article
Liao, Chung-Min'Use of residence time distribution for evaluation of gaseous pollutant volatilization
from stored swine manure', Journal of Environmental Science and Health, Part B, 32: 1, 127 — 145
To link to this Article: DOI:
10.1080/03601239709373079
URL:
http://dx.doi.org/10.1080/03601239709373079
Full terms and conditions of use: http://www.informaworld.com/terms-and-conditions-of-access.pdf
This article may be used for research, teaching and private study purposes. Any substantial or systematic reproduction, re-distribution, re-selling, loan or sub-licensing, systematic supply or distribution in any form to anyone is expressly forbidden.
The publisher does not give any warranty express or implied or make any representation that the contents will be complete or accurate or up to date. The accuracy of any instructions, formulae and drug doses should be independently verified with primary sources. The publisher shall not be liable for any loss, actions, claims, proceedings, demand or costs or damages whatsoever or howsoever caused arising directly or indirectly in connection with or arising out of the use of this material.
USE O F RESIDENCE T I M E DISTRIBUTION F O R EVALUATION O F GASEOUS POLLUTANT VOLATILIZATION F R O M
S T O R E D SWINE MANURE
Key words: Residence time distribution, Gaseous pollutant, Volatilization, Stored swine manure
Chung-Min Liao
Department of Agricultural Engineering National Taiwan University
Taipei, Taiwan R . O . C .
ABSTRACT
A quantification analysis for evaluation of gaseous pollutant volatilization as a result of mass transfer from stored swine manure is presented from the viewpoint of residence time distribution. The method is based on evaluating the moments of concentration vs. time curves of both air and gaseous pollutants. The concept of moments of concentration histories is applicable to characterize the dispersal of the supplied air or gaseous pollutant in a ventilated system. The mean age or residence time of airflow can be calculated from an inverse system state matrix [B]-1 of a linear dynamic equation describing the dynamics of gaseous pollutant in a ventilated air-space. The sum elements in an arbitrary row i in matrix [B]-1 is equal to the mean age of airflow in airspace i. The mean age of gaseous pollutant in airspace i can be obtained from the area under the concentration profile divided by the equilibrium concentration reading in that space caused by gaseous pollutant sources. Matrix [B]-1 can also be represented in terms of the inverse local airflow rate matrix ([W]-1),
127 Copyright © 1997 by Marcel Dekker, Inc.
transition probability matrix ([P]), and air volume matrix ([V]) as, [B]-1 =[W]-1[P][V]. Finally the mean age of airflow in a ventilated airspace can be interpreted by the physical characteristics of matrices [W] and [P]. The practical use of the concepts is also applied in a typical pig unit.
INTRODUCTION
Workers and pigs in pig units are exposed to a wide range of gaseous pollutants that cause respiratory irritation and sensitization. Longitudinal hygiene studies (Crook et al., 1991) indicate that many factors influence the presence and concen-trations of gaseous pollutants, but it is clear that a large proportion of exposed pigs and farmers may suffer respiratory symptoms.
Gases in pig units arise from the animal's respiration, but the main sources are caused bymicrobial composition of the faeces and urine (i.e..manure decomposition). The primary gaseous pollutants of physiological and physical concern are end pro-ductions of manure decomposition: ammonia, carbon dioxide, hydrogen sulfide, and methane.
There is ample evidence that several of the gaseous pollutants released during the decomposition of excreta, if concentrated, can cause injury or even death to pigs (Muehling, 1969;Drummond et al.,1968). Prolonged exposure to low levels of those gaseous pollutants may be of considerable importance, although health effects are largely unknown.
From the viewpoint of air quality, the main objective of a ventilation system in animal housing is to limit worker and animals exposure to polluted air. This implies at least for a steady air pollutant source, that its spread and residence time within the animal housing shall be minimized. The spread of a pollutant and pollutant itself and the distribution of the supplied air stated above must be quantified. That is to say, the flow field occurring must somewhat be characterized.
In general, a ventilated pig unit is a multiport system having several supply and exhaust terminals. It is of vital importance to know where a pollutant goes within a
pig unit. Measurements of the residence time distribution of the air extracted in a mechanically ventilated test-house with several exhaust air dusts are reported by Sandberg (1983). In hospital wards Lidwell (1960) studied the spread of pollutants between rooms. The dispersion of pollutants in a house, simulated by tracer gas, is reported by Freeman et al. (1982). Measurements of equilibrium concentrations of simulated pollutants in an office room are reported bySkarret and Mathisen (1981). Therasse and Sine (1974) in their study of ventilation for livestock buildings inter-preted the results of tracer gas experiments in terms o f a concept related to residence time.
Therefore, the aim of this paper is to give a comprehensive presentation of both the method and the theory of the residence time orage concept to problems occurring within pig units. With the development of this methodology, studies of an interdis-ciplinary nature involving both occupational health and the life of animal will be able to define an acceptable atmospheric environment for the animals and operators.
S Y S T E M M O D E L Dynamic system equation
The lumped-parameter model is used to establish the time-dependent chemical concentrations by solving the differential equation that balance the time rate of change of gaseous pollutant concentration to the instantaneous difference between gains and losses. The mass balance equation for each point (or subspace) in a ven-tilated airspace can be represented by a first-order vector-matrix differential equation (Liao and Bundy, 1995):
{ C ( í ) / c í í } = - [ f i ] { C ( í ) > + [ l/] - ' { G ( í ) } , < C ( 0 ) } = { C0} , ( 1 ) where {C(t)} = gaseous pollutant concentration vector, ppm; {G(t)} = source generation rate vector, g min"1; {Cs(t)} = supplied air concentration vector, ppm; [V]-1 = inverse diagonal matrix of air volume, nr3; [B] = [V]-'[Q] = system state matrix, min"1; in which [Q] = a square airflow matrix with entries Qy (j=source,
i=destination). The sum of the elements in a row (say No. i) of [Q] is equal to the flow rate of outdoor air entering airspace i. All elements in a column (say No. j ) of [Q] is equal to the total flow rate of air transferred directly from airspace jto outdoor. Based on the basic of asimple entrainment concept (ASHRAE, 1993),the secondary flow rate in a ventilated airspace is entirely induced by the primary flow rate, i.e.,by the entrainment in the inlet jets. Therefore, airflow matrix can also be expressed as, [ Q ] = [ ß ] Q; where [ β ] = square matrix of entrainment ratio function and β is an
entrainment ratio and can be defined as (ASHRAE, 1993): $=$Q/Q = entrained flow/ininial flow = ((2/K')(X/H0)); in which X=distance from face of outlet, m;
Ho=width of slot, m; and K ' = proportionality constant (approximately 7). The
equilibrium concentration of gaseous pollutant attained can be given as,
' 1 ) } . (2)
Volatilization rate determination
In a paper addressing the changes in gaseous mass transfer from stored swine manure (Liao and Bundy, 1994), a two-film resistance approach is used to calculate the transfer of gaseous pollutants from liquid manure to air,
m ( » ) = (64.31 · \0-*)KoACw, ( 3 )
where m(<»)=equilibrium volatilization rate of gaseous pollutant transferred from stored manure, g s"1; Ko=overall transfer coefficient, gmole cm"2 s"1; A=area of
manure pit,cm2;Cw=concentration ofcompound instored manure, mgl"';64.31*10"4
is a conversion factor related to the overall composition of pig manure which is found to be C272H445O14gN23S in which the molecular weight is equal to 6431 g gmole-1
(Anderson et al., 1987).
The overall mass transfer coefficient at the air-liquid interface reflects the resistance through both liquid and gas phases (Liao and Bundy, 1994):
+ 1/(A'· £ „ ) ) • ' . 0 . 1 < a < 0 . 2 5 , (4)
where a = a dimensionless factor, Kw = liquid-side mass transfer coefficient, gmole
cm"2 s"1;Kg=gas-side mass transfer coefficient, gmole cm-2s"';K=(H¡/(PMs))*10"6,
in which H¡=Henry's law constant of compound i,atm gmole"1 nr3;P=total pressure,
atm; and Ms=average molecular weight of swine manure, g gmole"1. If the bulk fluids
are well mixed, then essentially all resistance to mass transfer occurs within the two boundary layers each side of the interface. Under these conditions, Liao and Bundy (1994) determined semi-empirically that:
° \u 2 0 )U0 0 7H -O B'i, ' (5)
A'ff = 8 . 0 5 · 1 0 "4M - ' Z -0" S ¡0 6 7, ( 6 )
Λ > ( ( 1 / Κ1β χ ρ ( Κ2/ Τα) ) Μ , ) / ( / ' Μ , ) ) · ΙΟ6, ( 7 )
where M¡= molecular weight of compound i, g gmole-1; Τ=temperature, °C;
Ta=absolute temperature, °K; U=air velocity, m hr1; H=depth of manure pit, m;
Z=length of manure pit, m; Sc=gas phase Schmidt number; Kj and K2 coefficients
for predicting the variation of Henry's law constants.
The assumption of a completely mixed air phase is probably fairly reasonable, but complete mixing in the manure is not realistic. This variation has been achieved introducing a factor (a) ranging in values from 0.1 to 0.25 that is used to multiply the value of the clean water mass transfer coefficients as calculated from equations (5)-(7). The condition of the interface is another factor that cannot modelled exactly, but can be examined by the above-mentioned strategy of varying Ko.
Parameter estimation
The source term vector ({G(t)}) are used to account for the input of a gaseous pollutant transferred from manure pit in each pig occupant compartment. The general form of the source term for an arbitrary compartment i (G¡(t)) has the form
( 8 )
where V ¡ = a i r volume of pig compartment, m3; φ—transfer efficiency (g n r3 in
ventilation air transferred divided by mg I"1 of initial concentration in manure) of the
chemical from stored manure to air in compartment i ; 0 ( ( , t ° , T,")=function whose value is 1 when t is between x°and x'and zero otherwise, dimensionless; T°=time at which activity in compartment begins, min;t,°=time at which activity in compartment i ends.
Key parameter inequation (8) is the transfer efficiency (φ¡). Representative values
of these transfer efficiencies were estimated from literature researches as,
*l~-KKUVK(.m). (9)
where <K'=transfer efficiency for gaseous pollutant j in compartment i, and
Φ Τ=transfer efficiency for predicted value as derived from literature research by Anderson et al. (1987) (referred to as LR-Model) in compartment i, K(j)=overall mass transfer coefficient for gaseous pollutant j calculated from equation (4), and K(m)=overall mass transfer coefficient derived from LR-Model. Table 1 provides
the resulting ratios of K(j)/K(m) and values of φm for ammonia, carbon dioxide,
hydrogen sulfide, and methane at the end of pit-filling periods.
For the current estimation, the mass transfer parameters used in equation (9) is evaluated at 20°C. Although this may seem to introduce significant error because of the sensitivity of the Henry's law constant to temperature, it should be recognized that for the compounds considered here the overall mass transfer coefficient is dominated by liquid-phase resistance, which tends to be less dependent on temper-ature than gas-phase resistance (Liao and Bundy, 1994).
RESIDENCE TIME DISTRIBUTION
Age distribution function
Considering a ventilated pig unit, each air entering and gaseous pollutant volatilizing into the ventilated airspace will spend some time in the airspace before leaving. It is obvious that the exit time of one gaseous pollutant is different from that of another
TABLE 1
Transfer Efficiencies and K(j)/K(m) Ratios of Ammonia, Carbon Dioxide, Hydrogen Sulfide, and Methane at the
End of Pit-Filling Period
Compound Ammonia Carbon dioxide Hydrogen sulfide Methane α 0.10 0.25 0.10 0.25 0.10 0.25 0.10 0.25 Transfer efficiency (φ01) 4.6x10"' l.lxlO"8 0.03 0.06 0.02 0.05 0.025 0.08 K(j)/K(m) 13.69 3.44 4.88 15.16
not only because of the circulation of airflow in a ventilated airspace but because of the internal mixing (due to the molecular diffusion and turbulent movement, etc.) in each airspace. Therefore, there is an exit age distribution in the leaving airflow. This exit age distribution function will be denoted by E(t). Intimately related to the exit age distribution function is internal age distribution function, I(t), which accounts for the distribution of the ages (the length of time has elapsed since the gaseous pollutant volatilizes into the ventilation air) of air and gaseous pollutants at any moment in a ventilated airspace.
The following ages can be defined (Zwietering, 1959): (1) the internal age (t¡):
the travel time for component to move from a point at outdoor to a specific airspace within structures; (2) the residual life time (tri): the travel time from a specific airspace to the exhaust; and (3) the residence time (tr): the average time of release to time of exhaust. Each concentration of gaseous pollutants may be characterized by their
statistical cumulative age distribution function (CDF), and corresponding probability density function (PDF).
For the exit age distribution function (E(t)), the general relationship between a CDF (F(t)), and corresponding PDF (E(t)) is: dF(t)/dt = E(t). The term E(t)dt represents the fraction of the fluid elements in the exit stream having spend the time between i t o t+dt'ms. ventilated airspace, and I(t)dt represents the fraction of fluid elements withinternal age between fand t+dt. Therefore, ¡IE(t)dt = ¡%1 (t)dt= 1. From the statistical point of view, the moments about the origin of concentration profiles are (Feller, 1968):
f
Joí " C ( í ) d í , n=\, 2 , 3 n, ( 1 0 ) where μ^'ίεΛε area under the concentration profile. After use of the technique of Laplace transform, the application of equation (10) on the relation of the solution of equation (1) in the case of no {G(t)}: <C(()> = e x p ( - [ ß ] t ) { Co> , the moment
vector regards to age distribution of concentration profile may be obtained as: {TÍ;'1)} = n! ( [ f i ] ) -(" -1 ){ C0} , ( 1 1 )
therefore, the moment about the origin regards to exit age distribution function are: τ'"1» f t"E(t)dt = f í " d f ( í ) . ( 1 2 )
Jo Jo
t'/'can also be calculated from the CDF (F(t)) by integrating by parts and applying equation (12), it leads to:
τ ' / ^ η ί ( " • " ( l - f ( O ) c l l . ( n > 0 ) . ( 1 3 )
Jo
There are two perfectly equivalent methods of obtaining experimentally or numerically, the age distribution functions (Himmelblau and Bischoff, 1968;Nauman and Buffham, 1983): (1) step-up method: at time t=O,a fraction of the supplied air is labeled with gaseous pollutant, and the concentration of gaseous pollutant is measured at the point(s) in the system where the local age distribution is to be
obtained, and (2) step-down method: the system is initially filled with known homogeneous concentration of gaseous pollutant and is then supplied fresh air, the decay of concentration is recorded at point(s) where the local age in a step-down simulation is to be obtained.
The equation for the local age in a step-up simulation is now derived. At time
r=O,a fraction, Co, o f all the entering molecules in the system are labeled. Consider
an arbitrary point Ρ within the system at time t where the concentration is Cp(t). A
fraction Cp(t)/C0 of the molecules at time Ρ thus have an age less than or equal to
t. Since Cp(t)/C0 has the characteristics of a cumulative distribution function, let Φ P(t)=Cp(t)IC0 is defined as the cumulative distribution function of the local age
at point P.
The local mean age, τ 5 ' \ can be calculated according to equation (13) as:
( l - < t >p( í ) ) d f = ( 1 - Cp( t ) / Ce) d t . ( 1 4 )
• Jo
For step-down simulation with<]>p(O = 1 - Cp( i ) / C0, t h e local mean age then is:
τ < " = Γ ( 1 - Φρ( ί ) ) Λ = 1/CO [~Cp(t)dt= 1/C0-40 ). ( 1 5 )
" J 0 •'0
Mean ages of airflow and gaseous pollutant
From the definition of experimental measurement of age distribution functions by step-down simulation (equation (15)), it is possible to determine the internal age of airflow in a ventilated pig unit by starting from the same initial concentration of
air in each airspace as the reference concentration Co, in which Co= C ( 0 ) . Therefore,
by the definition of equation (15) and the recorded concentration-time relations of airflow, the mean age of the airflow in a ventilated airspace i can be obtained by dividing the Oth moment, i.e.,the area under the recorded concentration-time curve by the initial concentration, C(0), and by using the matrix notation, it becomes.·
! 1 ) S : O ) } . ( 1 6 )
According to equation (11) of { τ ^1} = [Β]' ' { C ( 0 ) > and the relation of
{C(O)}=C(O){1}, it leads to,
{ T ^0 )} = [ ß ] - ' { 1 } C ( 0 ) , ' ( 1 7 )
after inserting equation (17) into equation (16) gives the important relations: { τ <1 )} = [ β ] - ' { 1 } . ( 1 8 )
Equation (18) means the row sum in matrix [ B ]1, say the ith row, is equal to mean
age of airflow in airspace i.
The mean age of gaseous pollutant can be obtained by the same procedure as for the airflow. The only difference is that it starts from an equilibrium concentration, C ,-(«>), caused by gaseous pollutant sources (equations (2) and (8)). The equilibrium concentration is not necessarily the same in each airspace.
The mean age of the gaseous pollutants in airspace i is therefore calculated from the concentration reading in that airspace as:
T I J ' - T ^ ' / C . C « ) . ( 1 9 )
Liao and Feddes (1990) have shown that the inverse flow matrix ([Q]"1) can be
expressed in terms of the local (purging) airflow rates and transition probabilities as: [Q]-1 = [ ! / ] - ' [ / > ] , ( 2 0 )
where [W] = diagonal matrix of local purging flow rates, m3 hr^.and [P] = square
transition probability matrix (dimensionless). The exact mathematical and physical interpretations of matrices [W] and [P] have already been introduced by Liao and Feddes (1990).
Equation (20) on the relation of [ B l ' ^ t Q l ^ f V ] leads to an important relation as:
[B]-l"[W]-l[P][V]. ( 2 1 )
By matrix notation, the mean age vector of airflow finally can be expressed in terms of the matrices of local purging flow rate and transition probability as:
}. (22)
IMPLEMENTATION Daily air concentration profiles
A model implementation were studied in some details to give insight into the meanings of the concept introduced. The simulation of transport and distribution of gaseous pollutants is implemented in a typical pig unit consists of six compartments with a totally slatted floor (Figure 1). This unit has one negative pressure ventilation system of three high endwall exhaust fans with a continuous slot inlet. Each com-partment is divided into two airspaces of upper and pig occupant airs pace. Figure 2 illustrates the major components of the lumped-parameter model and shows the airflow pathways.
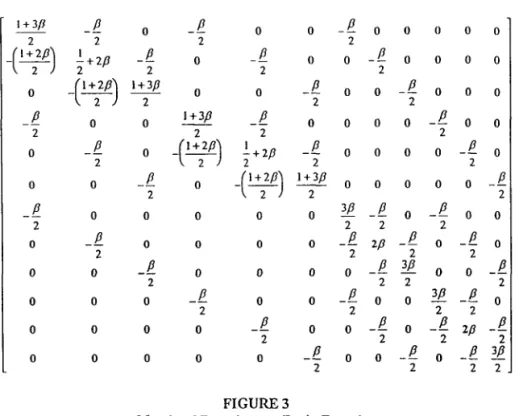
Dynamic system equation (3) is solved numerically using the 4th-order Runge-Kutta Subroutine and done in double precision of FORTRAN 77. Figure 3 shows the matrix of entrainment ratio matrix indicating the solution of airflow matrix is by the con-servation of air mass of 3-D lumped form of control volumes. Figure 4 displays the calculated 24-h average air concentration profiles for 6 pig occupant airspaces. The parameters used to calculate the ventilation air concentrations of gaseous pollutant attributable to manure pit volatilization are listed in Table 2.
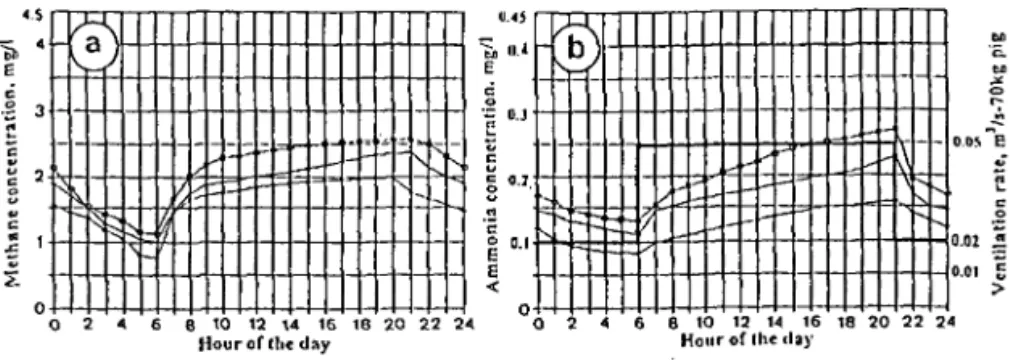
Figure 4 illustrates that the ventilation air concentration profiles of gaseous pollutants in pig occupant compartment are driven by the source term in the manure pit which begins at 6:00 a.m. at which major activities of pig in compartments begin. Figures 4(a)-4(c) show that air concentration profiles of methane, ammonia, and hydrogen sulfide almost have the same trend of concentration histories. The carbon dioxide concentration profiles shown in Figure 4(d) indicate that after the peak concentration in the ventilation air decay, the concentrations in each compartment become dependent on the other sources, e.g.,pig respiration and inflow carbon dioxide concentration from outdoor, etc.
0.05m
FIGURE 1
A Typical Swine Confinement Unit with A Negative Ventilation System Used in the Model Implementation
Mean age and local flow rate
The procedures for determining the purging flow rates and the local mean residence times of gaseous pollutants are illustrated below.
(1) Determination of flowmatrix [Q]: The entries in flow matrix can be determined
by the relations o f [ Q ] = [ß]Q. Then the inverse, [Q]"1, of the flowmatrix gives the desired quantities. With the diagonal elements written as the reciprocal of the purging flow rates, and .off-diagonal elements written as transition probabilities divided by the purging flow rates (equation (21)), therefore, the local purging flow rates can be calculated.
ι upper airspace ι pig occupant airspace
- + • 1
SYSTEM BOUNDARY
FIGURE 2
The Unit Airflow Patterns and the Control Volume of Pig Compartment Where Each Compartment Is Divided into Upper and Pig Occupant Airspace
ι + 3/y 2 ( 1 + 2fi\
I 2 J
0 β 2 0 2 0 0 0 0 0 Ρ 2ϊ·»
(l + 2/ΛI 2 J
2 0"I
0 0 0 0 0 Ρ 2 2 0 2 0 0_P
0 0 β 2 0 1 + 3/? 2I 2 )
0 0 0 2 0 0 1 2 -( 0 /? 2 0 ρ • + 2β 1 + 2/7) 2 J 0 0 0 0 0 0 0 2 β 2 1 + 3/? 2 0 0 0 0 0 _β 2 2 0 0 π 0 0Μ
2 2 0 2 0 0 0 β 2 0ο
0 0 2ο
-Ρ.
2 0 0 0 Ρ 2 0 0 0 0~Ί
21
0 0_£
2 0 0 0 ρ 0 2 0Μ
2 2 0 0 0 0 0 β 2 0 0 2 0 2 7 0 0 0 η 0 Ρ 2 0 0ο
~Ί
Μ
? FIGURE 3Matrix of Entrainment Ratio Function
(2) Determination of local equilibrium concentration C¡(r o): Equations (2) and
(8) can be used to determine the local equilibrium concentration of gaseous pollutant caused by pollutant sources (Fig. 4 ) . The mean age of gaseous pollutant in airspace i is then calculated from the concentration reading in that airspace as shown in equation (19).
Table 3 summarizes the results obtained from the model implementation for local purging flow rates and local mean residence time of ammonia, carbon dioxide, hydrogen sulfide, and methane. The local mean residence time of each gaseous pollutant is calculated refers to the full 24-h period. The local purging flow rates and local residence times of gaseous pollutant listed in Table 3 are in terms of the dimensionless unit in which dimensionless local purging rate: w' = w¡/Q and dimensionless local residence time of gaseous pollutant: τ^1'" = τ ¡J ' / ( ! / / Q ) .
«.s % A Ε ration , u c £ 2o u ethan e 0 \ -4 • \ -/ Í - -- -'â n.i Ε co o 0.2 CO., Ε 0 -- --
λ
-0.02 S 0.01 1 O 2 « 6 β tO 13 14 16 18 2 0 22 24 O 2 4 6 β ΙΟ 12 14 16 18 2 0 22 24Hourofllicciny Hour of Ih« clay
O: Compartments 1,4 + : Compartments 2,5 •: Compartments 3,6
£ o =.600
l
m Ξ S 300 6 c "ι (V -Lji
)
J / V / -- s. s O 2 4 6 8 10 12 14 16 18 20 2 2 24 0 2 4 6 8 10 12 14 16 18 20 22 24 Hmirofthcday Hour o í Iht «layF I G U R E 4
Estimated 24-h Average Air Concentration Profiles of Methane, Ammonia, Hydrogen Sulfide, and Carbon Dioxide in Pig Occupant Airspaces
in 6 Compartments
Table 3 indicates that the purging flow rate, the net rate by which a gaseous pollutantt is flushed out of the system is always less than or equal to the total flow rate of outdoor air supplied to the whole system. Equilibrium concentration at a region surrounding a point source are controlled by the net flow rate of air flushing the region. Transient phenomena of the decay of a gaseous pollutant are also dependent on how fast the air is arriving. The purging flow rates and mean residence times are to some extent interrelated. A high purging flow rate means that the air rather quickly arrives at the point in question.
TABLE 2
Parameters Used to Calculate Ventilation Air Concentrations of Gaseous
Pollutant Attributable to Manure Pit Volatilization
Parameter
Q
V
c
wτ°
τ*
Φ'
ß
[ß]
Description Representative value
Ventilation rate
9:00 pm-6:00 am
6:00 am-9:00 pm
Airspace volume
Component concen. in
manure pit*
Time when major
activity in compart,
begins
Time when major
activity in compart,
ends
Transfer efficiency of
compoundj
Entrainment ratio
Matrix of entrainment
ratio function
0.02
0.05
'4mX8mX1.5m
CO
2=17.2 mg/1
CH
4=1.05 mg/1
NH
3=864.5 mg/I
H
2S=0.02 mg/1
6:00 am
9:00 pm
CO
2=0.15
CH
4=0.5
NH
3=5xl0"
7H
2S=0.2
11.71"
Figure 3
Likely range
0.01-0.06"
(m
3/s-70kg pig)
11.7-26.6
0.35-1.05
863.1-865.9
0.017-0.02
0.07-0.24
0.3-0.9
6.9xl0"
8-1.5xl0
70.07-0.34
"From Anderson et al. (1987).
b
Ho=0.05m, X=24m, and K
l=7.
TABLE 3
Local Purging Flow Rates and Local Mean Age Residence Times of Gaseous Pollutant Obtained from Model
Implementation
Compound Compartment Local purging flow rate Local mean age
w¡* = w¡/Q.
(Wi*)" M\ )
upper pig occupant 9:00pm-6:00«m i:00«ra-9:00pm airspace airspace Ammonia Carbon dioxide Hydrogen sulfide Methane 1,4 2,5 3,6 1,4 2,5 3,6 1,4 2,5 3,6 1,4 2,5 3,6 0.97 0.98 1.00 0.97 0.98 1.00 0.97 0.98 1.00 0.97 0.98 1.00 0.95 0.96 0.99 0.95 0.96 0.99 0.95 0.96 0.99 0.95 0.96 0.99 0.91 0.93 0.95 0.99 0.98 1.00 0.93 0.96 0.98 0.97 0.98 0.99 0.84 0.90 0.94 0.97 0.98 0.99 0.98 0.96 0.93 0.98 0.97 0.94 CONCLUSIONS
Workers and animals exposure to aerial pollutants in confinement units identified the potential for transferring gaseous compounds from manure pit to ventilation air. The problem of determination of space air distribution for a pig unit with multiple inlets and outlets are difficult. There does not exist any definition of a local flow rate which would describe the local flow situation accounted for gaseous pollutants vol-atilization as a result of mass transfer from stored swine manure.
To provide a more comprehensive picture of the relationship between volatilization of gaseous pollutant and space air distribution, a residence time distribution is used.
The concept of moments of concentration profile of gaseous pollutant is applicable to characterize either the dispersal of gaseous pollutant or supplied air in a ventilated airspace. In this paper a distinction between flow rates predicted by recording velocities and the net flow rates by which a gaseous pollutant is removed from the system is made. The pertinent key concepts are the purging now rates and the mean residence times of both air and gaseous pollutant.
The mean residence time of airflow in a ventilated airspace can be calculated from an inverse system state matrix ([B]"1) of a linear dynamic equation ({C(t)/dt}=-[BKCCOj + rVl^fGCt)}) describing the dynamics of gaseous pollutant volatilized from stored swine manure. The sum elements in an arbitrary row i in matrix [B]"1 is equal to the mean residence time of air in airspace i. The mean residence time of gaseous pollutant in airspace i can be calculated from the area under the concentration profile divided by the equilibrium concentration reading in that space caused by pollutant sources.
Matrix [B]·1 can also be represented in terms of the inverse local purging flow rate matrix ([W]"1), transition probability matrix ([P]), and air volume matrix ([V]) as, [ B H = [ W ] - ' [ P ] [ V ] . Finally the mean residence time of air in a ventilated airspace can be interpreted by the physical characteristics of matrices [W] and [P].
ACKNOWLEDGMENTS
This work was supported partly by the National Science Council of Republic of China through grant NSC-85-2621-B-002-016.
R E F E R E N C E S
Anderson, G. A., Smith, R. J.,Bundy, D. S. and Hammond, E. G., J . Agric. Eng. Res. 37(4), 235-253 (1987).
ASHRAE. "ASHRAE Handbook of Fundamentals" American Society of Heating, Refrigerating, and Air Conditioning Engineers, New York (1993), pp. 31.8-31.12.
Crook, B . , Robertson, J . F . , Glass, S. A., Botheroyd, E. M., Lacey, J . and Topping, M. D., Am. Ind. Hyg. Assoc. J . 52(7), 271-279 (1991).
Drummond, J . G., Curtiss, S. E . , Simon, J . and Norton, H. W., J . Animal Sci. 50, 1085-1091 (1968).
Feller, W. (3rd ed.) "An introduction to probability theory and its applications" John Wiley & Sons, New York (1968), pp. 227-232.
Freeman, J.,Gale, R. and Sandberg, M., Proceedings 3rd AIC Conference, London (1982), pp. 45-51.
Himmelblau, D. M. and Bischoff, Κ. Β. "Process analysis and simulation. Deter-ministic systems" John Wiley & Sons, New York (1968), pp. 59-70.
Liao, C. M. and Feddes, J . J . R., Applied Math. Modelling 14, 248-257 (1990). Liao, C. M. and Bundy, D. S., J . Environ. Sci. Health B29(6), 1219-1249 (1994). Liao, C. M. and Bundy, D. S., J . Environ. Sci. Health B30(6), 859-893 (1995). Lidwell, O. M., I. Hyg. Camb. 58, 297-305 (1960).
Muehling, A. J . , J . Animal Sci. 30, 526-530 (1969).
Nauman, E. B. and Buffham, B. A. "Mixingin continuous flow systems" John Wiley & Sons, New York (1983), pp. 23-33.
Sandberg, M., ASHRAE Trans. 89(IIb), 455-479 (1983).
Skarret, E. and Mathisen, H. M., International Symposium on Indoor Air Pollution, Health and Energy Conservation, Amtierst, Mass. (1981), pp. 102-110.
Therasse, R. and Sine, L., Bull. Rech. Agron. Gembloux 9(2), 165-187 (1974). Zwietering, Th. N., Chem. Engng Sci. 11(1), 1-15 (1959).
Received: July 17, 1996