國 立 交 通 大 學
電 子 物 理 研 究 所
博士論文
第二型能帶結構量子井與量子點
之成長與光學研究
Growth and optical study of
type-II quantum well and quantum dot structures
研 究 生:范文忠
指導教授:周武清 博士
第二型能帶結構量子井與量子點之成長與光學研究
Growth and optical study of ype-II quantum well and quantum dot structures
研 究 生:范文忠 Student:
Wen-Chung Fan指導教授:周武清 Advisor:
Wu-Ching Chou國 立 交 通 大 學
電子物理研究所
博 士 論 文
A Thesis
Submitted to Institute of Electrophysics College of Science
National Chiao Tung University in partial Fulfillment of the Requirements
for the Degree of Doctor of Philosophy
in Electrophysics
July 2011
第二型能帶結構量子井與量子點之成長與光學研究
研究生:范文忠 指導教授:周武清
國立交通大學電子物理系研究所
摘要
利用分子束磊晶法成長第二型能帶排列的硒化碲鋅/硒化鋅多重量子井、碲 化鋅/硒化鋅量子點、碲化錳鋅/硒化鋅量子點與碲化鋅/硒化錳鋅量子點。並且 利用光激螢光譜、變溫光激螢光光譜、時間解析光譜、磁性光激螢光光譜等實驗 技術來探究其物理特性。 硒化碲鋅/硒化鋅多重量子井的發光波長、震盪強度以及光激螢光發光效率 可依量子井的井寬以及雷射激發強度做調控。隨著量子井井寬由 5 奈米降至 1 奈米我們可以觀察其光激螢光譜譜峰值有一個260 毫電子伏特的藍位移。在井寬 最寬的樣品中我們可以觀察到一個特別長的結合時間,而在最窄的井寬中此間接 激子束縛能為12 毫電子伏特。另外在高雷射激發功率下光激螢光強度因獲得熱 能而降低的效應被大大的減小。 同樣也利用變溫光激螢光光譜和時間解析光譜來研究第二型能帶結構的碲 化鋅量子點其物理特性。電洞在升溫過程中獲得熱能由小量子點脫逃並被其他鄰 近的大量子點捕捉,這使得光激螢光譜峰的半高寬會先變窄而後變寬的趨勢。而 因為載子在量子點中脫逃與再捕捉的過程使其時間衰減曲線呈現非單一指數趨 勢,而我們以 Kohlrausch 延伸指數可以完美的擬合碲化鋅量子點的時間衰減曲 線。 碲化錳鋅/硒化鋅量子點因為摻雜錳原子進入量子點內使得其磁光效應與碲式所成長的碲化錳鋅量子點擁有較佳的發光效率。利用右旋與左旋極化光的光激 螢光譜和時間解析光譜來研究碲化錳鋅/硒化鋅量子點內的載子自旋動力學,發 現 Kohlrausch 延伸指數可以精確地擬合右旋與左旋極化光的時間衰減曲線,進 而可以得到自旋鬆弛時間大約為23 奈秒。此外我們也在碲化錳鋅/硒化鋅量子點 中觀察到磁極化子(magnetic polarons)的形成,此磁極化子主要是由被侷限在量 子點內的電洞與錳離子中的3d 電子之間的自旋交互耦合作用而形成。在此系統 中我們觀察極化子可維持至100 K,且幾乎不隨溫度而有所改變。 最後我們在硒化錳鋅中成長碲化鋅量子點並且研究其光學特性,以瞭解其與 碲化錳鋅/硒化鋅量子點的異同。在碲化鋅/硒化錳鋅量子點中我們觀察到圓極化 率隨著磁場變化遵守Brillouin 函數,表示此量子點擁有順磁特性。由不同磁場 下的圓極化程度我們可以推得其自旋鬆弛時間約為35 奈秒。而在低溫中我們也 可在此樣品中觀察到磁極化子的形成。此外碲化鋅/硒化錳鋅量子點相較碲化錳 鋅/硒化鋅量子點有一較佳的發光效率。
Growth and optical study of ype-II quantum well and quantum dot structures Student:Wen-Chung Fan Advisor:Wu-Ching Chou
Institute of Electrophysics National Chiao Tung University
Abstract
Type-II ZnSeTe/ZnSe multiple quantum wells (MQWs), ZnTe/ZnSe quantum dots (QDs), ZnMnTe/ZnSe QDs, and ZnTe/ZnMnSe QDs were grown by molecular beam epitaxy (MBE). The photoluminescence (PL), temperature dependent PL, time-resolved PL and magneto-PL were used to investigate the interesting physical properties.
The tunability of the emission energy, oscillator strength and PL efficiency by varying the well thickness and excitation density was demonstrated in the ZnSe0.8Te0.2/ZnSe multiple quantum wells. A significant blueshift about 260 meV of
the PL peak energy was observed as the well width decreased from 5 to 1 nm. An extraordinary long lifetime (300 ns) of the recombination for the widest sample was detected. The binding energy of the indirect excitons is determined as 12 meV for the thinnest sample. The reduction of PL efficiency by thermal energy is greatly suppressed by employing a high excitation power.
increase with temperature for the full width at half maximum (FWHM) of PL is attributed to the hole thermal escape from the smaller QDs then transfer and re-capture to the neighboring-larger QDs. The non-mono-exponential decay profiles reflect the processes of carrier transfer and recapture. We show that the Kohlrausch’s stretching exponential well fits the decay profile of ZnTe/ZnSe QDs.
ZnMnTe/ZnSe QD structures have distinguished difference in magneto-optical properties from ZnTe/ZnSe QD structures due to the existence of Mn in the QDs. Different growth modes of ZnMnTe/ZnSe QDs were studied by using MBE. The ZnMnTe QD system grown by opened the Mn for a few seconds and then Zn+Te growth mode exhibit better emission efficiency. The σ+ and σ– circularly polarized
time-integrated and time-resolved PL were employed to investigate the carrier spin dynamics of ZnMnTe/ZnSe QDs grown on GaAs substrates by molecular beam epitaxy. The Kohlrausch’s stretching exponential function well correlates both the σ+
and σ– decay profiles. The measured spin relaxation time is about 23 ns. In addition,
we present a magneto-optical study of magnetic polarons (MP) in ZnMnTe/ZnSe QDs. The polarons are found due to the exchange coupling between the spins of the holes and those of the Mn ions, both of which are localized in the QDs. In this system, the MP was detected at temperature up to 100 K and the formation energy is roughly independent of temperature.
Finally, the ZnTe QDs were grown in ZnMnSe matrix. The magnetic field dependence of PL circular polarization degree follows the Brillouin function and evidences the Mn magnetism in ZnTe/ZnMnSe QDs. The magnetic field dependence of PL circular polarization degree shows the long spin relaxation time of about 35 ns. The magnetic polaron formation was observed in low temperature. The ZnTe/ZnMnSe QDs have better PL emission efficient than ZnMnTe/ZnSe QDs.
致謝(Acknowledgements)
漫長的學生生涯終於要劃下句點了,想想從進入拉曼實驗室開始也已經跟隨 周武清老師超過九個年頭了,感謝老師這幾年來在實驗研究上的細心指導,讓本 論文能順利完成。另外老師亦師亦友的相處方式也讓我獲益良多,我一直覺得做 人比做事難多了,而在老師身上我看到許多值得學習的待人處事方法,我覺得這 方面的學習更是珍貴,總之這幾年不論在課業上實驗上或是人與人之間的互動等 我都在老師身上學習到很多東西,謝謝老師這幾年對我的照顧與指導。 我還要感謝我最愛的爺爺、奶奶與爸、媽,謝謝你們提供給我一個不錯的家 庭環境以及一直默默的在背後支持我幫我加油打氣,讓我即使面臨困難也能勇敢 面對進而想辦法解決。 感謝高雄大學謝振豪教授以及大同大學楊祝壽教授一直以來在光譜以及分 子束磊晶上相關問題的解答與指導,沒有您們的幫助我會走的更辛苦的,謝謝您 們。 感謝實驗室任何時期所有伙伴的陪伴,大家一起做實驗一起苦,一起玩樂一 起笑,讓做實驗變成一件快樂的事。尤其是拉曼時期的學長姐們大家當時幾乎天 天熬夜培養出來的革命情感更是濃厚,感謝大家能在我低潮時聽我吐吐苦水並給 予我意見幫我打氣。 也感謝各位好友不論是高國中同學或是爬山攝影的好友們,感謝你們在我想 疏壓時可以陪著我到處趴趴走,也感謝大家在最後幫我集氣加油。 總之要感謝的人真的太多了,感謝這幾年來出現在我生命中的所有人,因為 有你們的出現我的生活才會如此的多采多姿。謝謝大家…。最後,僅以此論文獻 給所有關心我的朋友與家人。Contents
Abstract (Chinese) i
Abstract (English) iii
Acknowledgements vi
Contents vii
Table captions viii
Figure captions ix
Chapter 1 Introduction ………...………....1
Chapter 2 Experimental setup………….………....8
2-1 Molecular beam epitaxy (MBE) system………...8
2-2 Photoluminescence………...10
2-3 Time-resolved photoluminescence………...11
2-4 Magneto Time-resolved photoluminescence……….…...11
Chapter 3 ZnSe0.8Te0.2/ZnSe multiple quantum wells ……...…… 23
Chapter 4 ZnTe/ZnSe quantum dots………...……….. 34
Chapter 5 ZnMnTe/ZnSe quantum dots ……….. 47
Chapter 6 ZnTe/ZnMnSe quantum dots ...……… 67
Table captions
2.1 The growth condition of ZnSe0.8Te0.2/ZnSe MQWs………13
2.2 The growth conditions of ZnTe/ZnSe QDs……….13
2.3 The growth conditions of ZnMnTe QDs and Zn(Mn)Te MQDs……….14
Figures captions
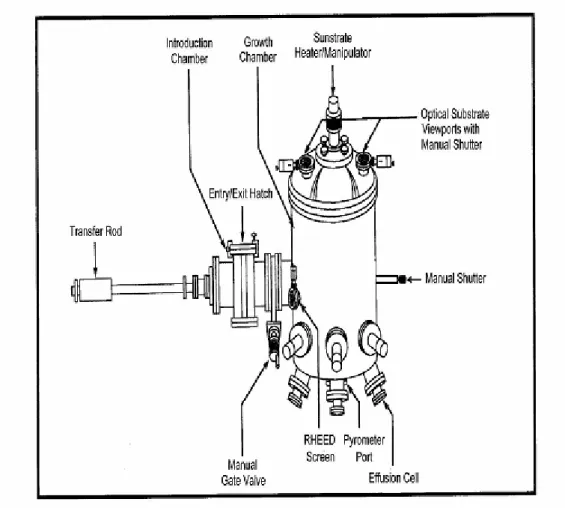
2.1 The Veeco Applied EPI 620 MBE system………..…….15
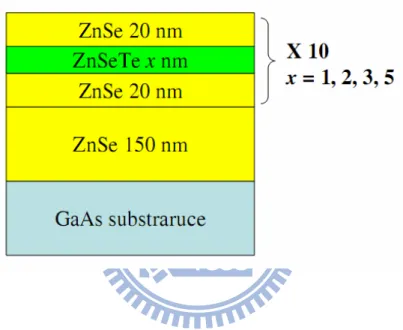
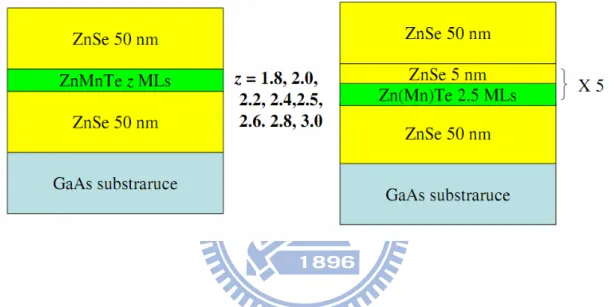
2.2 The structure of ZnSe0.8Te0.2/ZnSe MQWs……….16
2.3 The structure of ZnTe/ZnSe QDs………17
2.4 The structure of ZnMnTe/ZnSe QDs and Zn(Mn)Te MQDs………..18
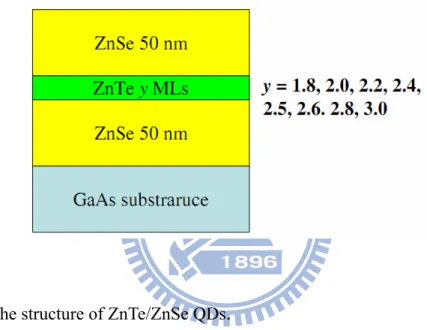
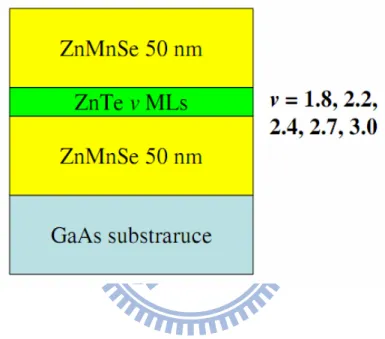
2.5 The structure of ZnTe/ZnMnSe QDs………...19
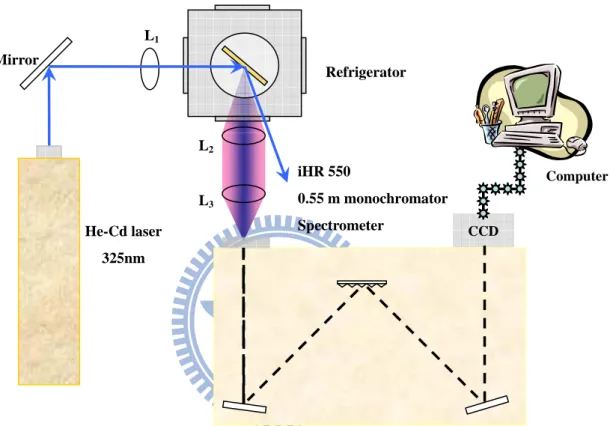
2.6 Experimental setup for the PL measurements……….20
2.7 Experimental setup for the time-resolved PL measurements………..21
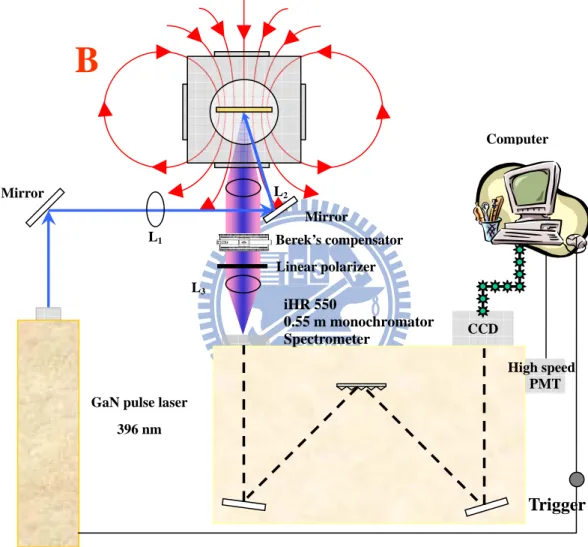
2.8 Experimental setup for the magneto time-resolved PL measurements………...22
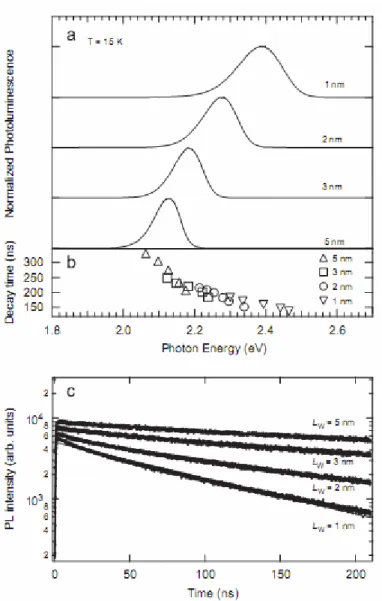
3.1 (a) Low-T PL spectra of ZnSe0.8Te0.2/ZnSe MQWs. (b)Spectral distributions of the decay times for the ZnSe0.8Te0.2/ZnSe MQWs. (c)Evolution of PL peak intensity as a funtion of time………...30
3.2 PL spectra at various excitation powers for the sample with Lw = 3 nm. The inset plots the dependence of the PL peak energy on the cube root of the excitation power……….………..31
3.3 (a) T-dependence of τPL (solid circles), τr (open circles) and τnr (open squares). The solid line represents the fit of τr to Eq. 2, yielding a characteristic energy of 12±3 meV. (b) Arrhenius plot of the normalized PL peak intensity………32
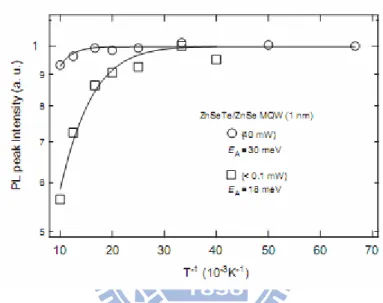
3.4 Arrhenius plot of the normalized PL peak intensity for the ZnSe0.8Te0.2/ZnSe MQW (Lw = 1 nm), under excitation powers of 40 mW (solid triangles) and below 0.1 mW (solid squares). Activation energies with the fitting errors were also shown………...33
4.2 (a) Temperature dependent PL spectra of 2.6 ML sample. (b) The FWHM as a function of the sample temperature for 2.6 ML samples………42 4.3 PL intensity as a function of the inverse temperature……….43 4.4 The decay profiles of the PL signal from ZnTe QDs detected at their PL peak
energies with different coverage……….44 4.5 The energy dependent decay times obtained by the stretched exponential…….45 4.6 Coverage dependences of decay times and β values………...46 5.1 AFM image of (a) ZnTe QDs, (b) ZnMnTe QDs grown by opening the Zn, Te, and Mn flux at the same time, and (c) ZnMnTe QDs grown by first starting the Mn flux then Zn and Te flux………56 5.2 Low temperature PL spectra of 2.5 MLs of ZnTe QDs, ZnMnTe QDs grown by opening the Zn, Te, and Mn flux at the same time, and ZnMnTe QDs grown by first starting the Mn flux then Zn and Te flux……….57 5.3 Low temperature PL spectra of ZnMnTe QDs with different coverages. The inset shows the PL peak energy of QD as a function of ZnMnTe coverage. The solid line is just a guide for eyes………..58 5.4 PL spectra with σ+ (solid line) and σ– (dashed line) circular polarization of a 2.6
ML multi-QD layers with 10 nm of spacer layer thickness at B = 0 T and B = 5 T………..59 5.5 Plot of circular polarization as a function of magnetic field at 10K (circle). Insert:
schematic conduction and heavy-hole band diagram of ZnMnTe/ZnSe quantum dots at B>0. The spin splitting in ZnSe is ignored………..60 5.6 Decay profile of ZnMnTe/ZnSe QDs. The red solid curve is a fit using the
Kohlrausch’s stretching exponential function described in the text………61 5.7 Lifetime as a function of magnetic field. The squares represent σ and circles
5.8 The time-resolved PL spectra of ZnMnTe MQDs at various time………..63 5.9 Time-resolved PL spectra of ZnTe MQDs at various time………..64 5.10 Time dependent PL peak energy of ZnMnTe MQDs at 10 to 100 K………65
5.11 Temperature dependence of the magnetic-polaron formation time (right) and magnetic-polaron binding energy (left)………...66 6.1 AFM image of 2.7 MLs ZnTe/ZnMnSe QDs………..73 6.2 Low temperature PL spectra of ZnTe QDs with different coverages. The inset
shows the PL peak energy of QD as a function of ZnTe coverage. The solid line is just a guide for eyes……….74 6.3 PL spectra with σ+ (solid line) and σ– (dashed line) circular polarization of 2.7
ML at B = 0 T and B = 5 T………..75 6.4 Plot of circular polarization as a function of magnetic field at 10K (circle)…...76 6.5 The magnetic field dependent circular polarization of ZnMnTe/ZnSe 2.6 MLs
SQDs, ZnMnTe/ZnSe 2.6 MLs and ZnTe/ZnMnSe 2.7MLs SQDs………77 6.6 The TR PL spectra of 2.7 MLs at various time………...78
Chapter 1
Introduction
Recently, quantum structures based on type-II band alignment material systems have received much interest due to their application in photodetectors, [1] optical memory devices, [2] and solar cells. [3] In quantum structures with a type-II band alignment, electrons and holes are spatially separated. Because of this spatial separation, type-II quantum structures show optical properties quite different from those of type-I quantum structures, such as long radiative lifetime [4] and large tenability of emitted photons. Moreover the interesting physical phenomenon like Aharonov–Bohm (AB) oscillations in the optical spectrum due to the confinement of charge carriers in different regions have also been demonstrated [5] in type-II quantum structures. In order to study the novel optical properties of type II quantum structures, several type II quantum structures, ZnSeTe/ZnSe multiple quantum wells (MQWs), ZnTe/ZnSe quantum dots (QDs), ZnMnTe/ZnSe QDs, and ZnTe/ZnMnSe QDs, were grown by molecular beam epitaxy (MBE) and investigated by the time-resolved, temperature dependent and magneto-photoluminescence.
The ternary compound semiconductor, ZnSe1-xTex, has long been of interest
semiconductors in II-VI compound semiconductor light emitters [6]. Numerous studies of the bulk structure of ZnSe1-xTex have been conducted [7-10]. ZnSeTe-based
light emitting device in the green spectral region has also been proposed [11]. The photoluminescence (PL) of ZnSe/ZnTe superlattice structures has always been attributed to isoelectronically bound excitons [11, 12], instead of quantum confined excitons. The wavefunction of a compact Te-trapped hole of size 1 nm has been reported theoretically [13]. We have established that the quantum confinement effect of Te-bound excitons is significant only in an extremely thin layer previously [14]. However, the thermal effect on the recombination properties, which is crucial for the optoelectronic device application, have not yet been thoroughly investigated. On the other hand, the enhancement of exciton lifetime by isoelectronically bound centers has been found by several groups [8, 10, 15].The spatial separation of Te-trapped exciton in type-II ZnSe quantum structures was expected to further reduce its oscillator strength. This increases the potential application taking the advantage of small electron-hole wavefunction overlap. For instance, a long spin coherence time is essential for spintronics device [16] and the suppression of spin relaxation rate due to small electron-hole exchange interaction was found experimentally [17] and theoretically [18]. In this dissertation, we studied the recombination properties of the
demonstrated the tuning of the long radiative recombination time [11] for indirect Te-bound excitons by tailoring well-width of type II [15] ZnSe0.8Te0.2/ZnSe MQW.
The radiative lifetime of the thickest MQW is about 300 ns at low temperature. Besides the thermal quenching process due to the Te-cluster binding energy, [11] the temperature (T) dependence of radiative efficiency was also found to be governed by dissociation of spatially separated exciton at low T region. This thermal quenching process depends crucially on the excitation power.
Self-assembled ZnTe QDs grown in the ZnSe matrix by MBE also has type II band alignment as ZnSeTe/ZnSe QWs, long carrier recombination time is expected in ZnTe/ZnSe QDs. However, the carrier recombination dynamics of QDs might be very different from that of QWs due to the stronger quantum confinement. Recently, carrier recombination dynamics of semiconductor QDs has attracted much attention because of its importance to understand the operation and performance of opto-electronic devices made of QD structures. The decay dynamics of neutral and charged excitonic complex in single InAs/GaAs QDs was investigated to explore the specific transition time of different channels [19]. The decay times of holes in GaSb QD recombined with electrons in InGaAs quantum well (QW) and GaAs buffer were studied to comprehend the optical properties of GaSb/GaAs QD laser structure [20, 21]. Transient carrier transfer was also investigated in the InGaAs QW and QD
tunnel-injection nano-structures [22]. Furthermore, carrier localization and interdot carrier transfer was observed in CdZnMnSe QDs by integrated and time-resolved PL [23]. For most QD systems, the PL decay profiles show non-mono-exponential behavior. This non-mono-exponential behavior was usually analyzed by a bi-exponential function. However, the bi-exponential fits were attributed to different mechanisms. C. -K. Sun et al. [24] found that the fast component is shortened significantly with higher excitation intensity while the slow component is roughly constant. They ascribed it to the staggered band lineup and the space charge induced band-bending of type II GaSb/GaAs QDs. On the other hand, H. Yu et al. associated the slow decay of type I InAs QDs to the recombination of the ground states of smaller QDs and the fast decay to the excited states of the larger QDs [25]. R. Hostein et al. also observed two decay times in their PL decay profiles at high temperature [26]. The short time is due to emission of thermally excited states and the long time results from the emission of the ground states at the maximum of the InAsP/InP QD distribution.
Recently, we found the decay profile of iso-electronic ZnSeTe alloys also shows non-mono-exponential behavior [27]. It was well fitted by the Kohlrausch’s stretching exponential and can be understood by the theoretical hopping transport of excitons
Stranski-Krastanov (SK) growth mode inevitably encounters the carrier transfer between QDs through the underlying wetting layer before electron and hole recombination. Especially, for type II SK QDs, one carrier is confined in the QD, while the other carrier situates outside the QD and can transport in the space between QDs. In our previous report, we have used the temperature dependent PL peak shift and PL linewidth to illustrate the phenomenon of exciton thermal activation, transfer, and recombination in type II ZnTe/ZnSe QDs [29]. In chapter 4, we studied the optical properties of the ZnTe QDs by temperature-dependent and time-resolved PL spectroscopy. We show that the Kohlrausch’s stretching exponential is better than the two-decay-time function to analyze the SK ZnTe/ZnSe QD decay profile.
ZnMnTe/ZnSe QD structures are more interesting than ZnTe/ZnSe QD structures because of the existence of Mn ions in the ZnMnTe QDs. Incorporating QD structures with magnetic ions (typically Mn) [30-35] provides intriguing opportunities to manipulate and study magnetic ordering, not available in bulk magnetic semiconductors [36, 37]. For example, adding an extra carrier can strongly change both the total carrier spin and the onset temperature of the magnetic order [38]. Furthermore, modifying the quantum confinement can create or destroy the magnetic order, even at a fixed number of carriers [39]. PL provide a sensitive probe of the magnetic properties in (II,Mn)VI QDs. For example, PL can be used as a fingerprint
for the deformation of the quantum confinement and the placement of a single Mn-impurity in a QD [32]. Since the number of Mn impurities in a single QD typically does not exceed several thousands, the magnetic order resulting from the carrier mediated Mn-Mn interaction differs from the situation at the thermodynamic limit. Instead, the magnetic order in QDs resembles more closely (bound) magnetic polarons (MPs) that have been extensively studied in bulk magnetic semiconductors [36, 40-42]. In MPs the exchange interaction between a localized carrier, or exciton, and magnetic impurities creates a could of aligned spins. The formation of MPs, lowers the energy of the system resulting in a red shift in the interband transition energy, which is observable in time-resolved PL. [30] The renewed interest in MP studies in MP studies arises from the tunability of the QD confinement, absent for MPs formed in the bulk systems. ZnTe/ZnMnSe QD structures also have type-II band alignment as ZnMnTe/ZnSe QD structures. However, the magneto-optical properties are dominated by the exchange interaction of conduction band electron (outside the QD) and d electron of Mn ions, which is different from that of ZnMnTe/ZnSe QDs, MP formation due to exchange interaction of hole (inside the QD) and d electron of Mn ions.
ZnMnTe/ZnSe QDs, and ZnTe/ZnMnSe QDs, are described in Chapter 3, 4, 5, and 6, respectively. In chapter 7, a brief conclusion will be presented.
Chapter 2
Experimental setup
In this chapter, the experimental techniques used in this thesis were described. The experimental techniques include molecular beam epitaxy, photoluminescence spectroscopy, time-resolved photoluminescence spectroscopy, and magneto photoluminescence spectroscopy. The details are described below.
2.1
Molecular beam epitaxy (MBE) system
The Veeco Applied EPI 620 molecular beam epitaxy (MBE) system was shown in Fig. 2.1, which is a six source vertical growth chamber. It includes the vacuum systems, analytical equipments, one introduction chamber, and one growth chamber.
The growth chamber contains all of the components and analytical equipment. Five element solid sources are Zinc (Zn), Selemium (Se), Manganese (Mn), Tellurium (Te), and Cadmium (Cd). There is one compound source, zinc chloride (ZnCl2), for
n-type doping. The EPI 40 cc low temperature cells were used for the evaporation of the elemental solid sources Zn, Se, Te, and Cd. For Mn solid source, the EPI 40 cc standard temperature cell was used. Each cell has its own shutter to control the growth time. There is a main-shutter between sources and the substrate to protect substrate
plane on a substrate heating stage, which can be continuously rotated for high uniform growth. Substrate motion is imparted to the manipulator’s magnetically coupled drive train from a servomotor. The reflection high-energy electron diffraction (RHEED) system is also set up in the growth chamber. It is an invaluable tool to determine different aspects of the depositing layer. Morphological information of the surface may be interpreted from the spot and line pattern, which appear on the phosphor screen display during growth.
To maintain the ultrahigh vacuum of the growth environment, several kinds of pumps were used. Both the growth and introduction chambers are rough pumped (the range between atmosphere and approximately 100 m-torr) using an oil-free mechanical diaphragm pump. The introduction chamber uses the Varian V-250 turbo-molecular pump to reduce the pressure to the high vacuum region (<5×10⁻⁸ torr ) in all volumes. The growth chamber uses a closed loop liquid He cryogenic pumping system to obtain the ultrahigh vacuum (<1×10⁻¹⁰ torr).
The samples studied in this thesis were grown on GaAs (100) substrates by Veeco Applied EPI620 MBE system. Solid sources Zn, Mn, Te, and Se were used for the growth of self-assembled ZnMnTe QDs and ZnSe buffers. Prior to the growth procedure, GaAs (100) substrate was etched in a H2O2 : NH4OH : H2O (1:5:50)
two minutes and dried with high purity N2. De-sorption and growth procedures were
monitored by the RHEED pattern.
The structure of the ZnSe0.8Te0.2/ZnSe multi quantum wells (MQWs) used in
chapter 3 was shown in Fig. 2.2. The growth conditions of the ZnSe0.8Te0.2/ZnSe
MQWs were shown in Table. 2.1.
The structure of the ZnTe quantum dots (QDs) used in chapter 4 was shown in Fig. 2.3. The growth conditions of the ZnTe/ZnSe QDs were shown in Table. 2.2.
The structures of the ZnMnTe quantum dots (QDs) and Zn(Mn)Te multi quantum dots (MQDs) used in chapter 5 were shown in Fig. 2.4. The growth conditions of the Zn(Mn)Te/ZnSe QDs were shown in Table. 2.3.
The structures of the ZnTe/ZnMnSe quantum dots (QDs) used in chapter 6 were shown in Fig. 2.5. The growth conditions of the ZnTe/ZnMnSe QDs were shown in Table. 2.4.
2.2 Photoluminescence
The experimental setup for the photoluminescence (PL) measurements is shown in Fig.2.6. Samples were loaded on the cold finger of a closed-cycle refrigerator, whose temperature can be controlled between 10 and 300 K. The 325 nm line from a He-Cd
wells (MQWs), the spectra were analyzed by SPEX 1403 double-grating 0.85 m spectrometer equipped with a thermal electric-cooled photo-multiplier tube (PMT). For the other Zn(Mn)Te/Zn(Mn)Se QDs, the spectra were dispersed using a Horiba Jobin-Yvon iHR550 0.55 m single-grating spectrometer and detected using an LN2-cooled charge-coupled device (CCD).
2.3 Time-resolved photoluminescence
Recombination dynamics of excitons in all samples were studied by time-resolved PL. The experimental setup of time-resolved PL is shown in fig. 2.7. A GaN diode laser with 50 ps pulses and a repetition rate of 2.5 MHz at a wavelength of 396 nm was used as an excitation source. The peak power of the pulse was estimated to be below 0.1 mW. The signal was dispersed by a Horiba Jobin-Yvon iHR550 0.55 m single-grating spectrometer and detected by a high-speed photomultiplier tube, followed by a PC plug-in time-correlated counting card. The overall temporal resolution of the setup was about 300 ps.
2.4 Magneto time-resolved photoluminescence
The schematic diagram of the magneto time-resolved PL experiment is shown in Fig. 2.8. The linear polarized 396 nm line of a GaN diode laser was used as the
excitation source. The samples mounted on a copper holder were in contact with exchange helium gas. The temperature was controlled between 10 and 300 K. The incident light was focused by lens L1 on the sample. The scatter light was collected in
the Faraday geometry (the light propagates along the direction of the magnetic field). To analyze the σ+ and σ- polarization components of the luminescence, a combination
of a Berek’s compensator and a linear polarizer was used. The luminescence signals were analyzed by a Horiba Jobin-Yvon iHR550 0.55 m monochromator and detected using an LN2-cooled CCD.
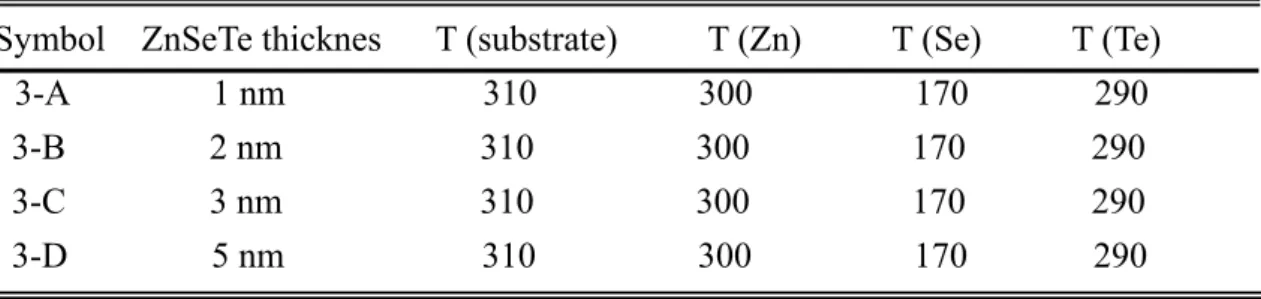
Table 2.1 The growth condition of ZnSe0.8Te0.2/ZnSe MQWs.
Symbol ZnSeTe thicknes T (substrate) T (Zn) T (Se) T (Te) 3-A 1 nm 310 300 170 290 3-B 2 nm 310 300 170 290 3-C 3 nm 310 300 170 290
3-D 5 nm 310 300 170 290
※ T (Temperature) Unit:℃
Table 2.2 The growth conditions of ZnTe/ZnSe QDs.
Symbol ZnTe coverage T (substrate) T (Zn) T (Se) T (Te) 4-A 1.8 MLs 300 294 178 310 4-B 2.0 MLs 300 294 178 310 4-C 2.2 MLs 300 294 178 310 4-D 2.4 MLs 300 294 178 310 4-E 2.5 MLs 300 294 178 310 4-F 2.6 MLs 300 294 178 310 4-G 2.8 MLs 300 294 178 310 4-H 3.0 MLs 300 294 178 310 ※ T (Temperature) Unit:℃
Table. 2.3 The growth conditions of ZnMnTe QDs and Zn(Mn)Te MQDs..
Symbol coverage T (substrate) T (Zn) T (Se) T (Te) T (Mn) 5-A 2.5 MLs 300 294 178 310 ---- 5-B 2.5 MLs 300 294 178 310 695 5-C 2.5 MLs 300 294 178 310 695 5-D 1.8 MLs 300 294 178 310 695 5-E 2.0 MLs 300 294 178 310 695 5-F 2.2 MLs 300 294 178 310 695 5-G 2.4 MLs 300 294 178 310 695 5-H 2.5 MLs 300 294 178 310 695 5-I 2.6 MLs 300 294 178 310 695 5-J 2.8 MLs 300 294 178 310 695 5-K 3.0 MLs 300 294 178 310 695 5-L 2.5 MLs 300 294 178 310 695 5-M 2.5 MLs 300 294 178 310 ---- ※ T (Temperature) Unit:℃, sample 5-M is the ZnTe MQDs.
Table. 2.4 The growth condition of ZnTe/ZnMnSe QDs.
Symbol coverage T (substrate) T (Zn) T (Se) T (Te) T (Mn) 6-A 1.8 MLs 300 294 178 310 695 6-B 2.0 MLs 300 294 178 310 695 6-C 2.2 MLs 300 294 178 310 695 6-D 2.4 MLs 300 294 178 310 695 6-E 2.7 MLs 300 294 178 310 695 6-F 3.0 MLs 300 294 178 310 695 ※ T (Temperature) Unit:℃
Fig. 2.6 Experimental setup for the PL measurements. CCD L1 Refrigerator L2 L3 Computer He-Cd laser 325nm iHR 550 0.55 m monochromator Spectrometer Mirror
Fig. 2.7 Experimental setup for the time-resolved PL measurements.
Trigger
iHR 550
0.55 m monochromator Spectrometer
GaN pulse laser 396 nm High speed PMT L1 L2 L3 Refrigerator
Fig. 2.8 Experimental setup for the magnetotime-resolved PL measurements.
CCD L2
L3
Computer
GaN pulse laser 396 nm Mirror Mirror
B
Berek’s compensator Linear polarizer L1 iHR 550 0.55 m monochromator Spectrometer Trigger High speed PMTChapter 3
ZnSe
0.8Te
0.2/ZnSe multiple quantum wells
In this chapter, novel optical properties of ZnSe0.8Te0.2/ZnSe multiple quantum
wells (MQWs) structures were studied by excitation power dependent photoluminescence (PL) and temperature (T) dependence time resolve photoluminescence. A significant blueshift of PL energy and long exciton lifetimes were observed. The T dependence of radiative efficiency was found to be governed by the dissociation of spatially separated exciton at low T region. The thermal quenching of the PL intensity was found to depend crucially on the excitation power.
The 10-period ZnSe0.8Te0.2/ZnSe MQWs, were grown on the GaAs substrates by
molecular beam epitaxy. A 150 nm-thick ZnSe buffer was grown before the deposition of the MQW. The cell temperatures of Zn, Se and Te were set at 300 oC, 170 oC and 290 oC, respectively. The substrate surface temperature was kept at 310 oC throughout the growth of the MQWs. The Te concentration was determined by an energy dispersive X-ray diffraction measurement using a ZnSe0.8Te0.2 epilayer grown under
the same conditions as the MQW structures. The thickness of the barrier layer (ZnSe) was kept at 20nm, and the well-widths (Lw) for the four 10-period MQWs are 1 nm, 2 nm, 3nm and 5 nm, respectively. A pulsed GaN diode laser (396 nm) with pulse
duration of 50 ps and repetition rate of 2.5 MHz was used as an excitation source for the time-resolved measurement. The peak power of the pulse was estimated to be below 0.1 mW. The transient PL spectra were analyzed by a high-speed photomultiplier tube, followed by a personal computer plug-in time-correlated counting card. The overall time resolution of the detection system was about 300 ps.
Bright luminescent energies from yellow to green spectral region were detected from the samples at low T. Figure 1(a) shows the low-T PL spectra of the MQWs, pumped under an excitation power below 0.1 mW. A significant blueshift of PL peak energy with decreasing Lw is attributed to the quantum confinement effect. The large PL linewidth of the MQWs was attributed to the radiative recombination between the holes trapped in the short-range potentials of the isoelectronic impurities in ZnSe0.8Te0.2 and the electrons bound in ZnSe by the Coulomb interaction.
In Fig. 1(c) shows the evolution of PL peak intensity as a function of time. The decay profiles could be fitted by a single time constant using
IPL( )t =I0exp( /−t τPL) (1)
where ( )IPL t and I are the PL intensity at time t and 0, respectively. 0 τPL is the PL decay time. The spectral distributions of PL decay time (τPL) were shown in Fig.
only determinant of the recombination linewidth, since inhomogeneous broadening is also relevant [15]. The different aggregates of Te-clusters is responsible for inhomogeneous broadening. The τPL decreases with the increasing Lw. The increase
in Lw reduces the wavefunction overlap between the spatially separated electrons and holes [43], therefore the decay rate decreases. A decay time of 30 ns has been reported for a bulk ZnSe1-xTex with x = 0.12 [15]. The long-lived exciton in bulk ZnSe1-xTex is
due to the suppression of hole wavefunction by Te-clusters [44]. The further enhancement about an order of magnitude in the τPL’s of the QW structures is ascribed
to a more spatial separation of the carriers that were confined in different layers. The observed lifetimes are longer than that was reported for type-II ZnSe/BeTe superlattice structures [45]. This indicates that Te doping can be a factor for the further reduction of decay rate by modifying the hole wavefunction in the ZnSeTe quantum structures.
We further confirm the type-II nature of the emissions in the MWQs. Figure 2 plots the evolution of PL peak energy as a function of excitation power for the MQW (Lw = 3 nm). The PL bands blueshift markedly as the excitation power increases. This phenomenon, which is usually interpreted as being caused by the carrier-induced band-bending effect at the heterointerfaces [5,6]. As the excitation density increases, the increase in population of spatially confined electron-hole pairs strengthens the
band-bending effect at the heterointerfaces. The quantization energy was found to increase in proportion to the cube root of the excitation power [46]. This is in good agreement with the experimental data (inset of Fig. 2). Hence, the PL of the ZnSe0.8Te0.2/ZnSe MQWs is attributable to the radiative recombination of holes
localized in the ZnSe0.8Te0.2 layers and electrons in the ZnSe barrier region.
The T-dependent PL efficiency was examined by the T-dependent PL intensity
(IPL) and lifetime. Figure 3(a) shows the τPL (solid circles) measured at the PL peak
energy as a function of T for the sample with Lw = 1 nm. The lifetime increases initially from low T to 100 K (from 160 ns to 184 ns), and decreases monotonically above 120 K. The radiative (τr) lifetime and nonradiative (τnr) lifetimes were
estimated by a combined analysis of T-dependent IPL and τPL [47]. Considering only
radiative and nonradiative recombination process in the system. The internal radiative yield, η τ= nr /(τnr +τr)=IPL( ) /T IPL(0), rules the variation of I versus T, where PL
the ( )IPL T and IPL(0) are the PL intensity at temperature T and 10 K, respectively. The radiative efficiency is assumed to be unity at low temperature (30 K) because the excitons are strongly localized by the Te-clusters, thus, the migration of excitons to the nonradiative centers is inhibited [15]. Since the measured τPL can be given by
1 1 1
PL r nr
τ− =τ− +τ− , we can obtain the radiative lifetime as /
R PL
at low T, dominating the recombination at over 120 K. The increase in τr can be
understood as a consequence of ionization of weakly bound electrons from the strongly localized holes. Therefore, the dependence of τr on T can be fitted by the
formula [8]:
τr( )T =τr(0) /[1−Cexp(−ε/k TB )] (2)
where τr(0) is the radiative time at the low T limit, C is a constant and ε is a characteristic energy that is of the order of the electron-hole binding energy. The obtained binding energy, indeed, depends sensitively on the T range chosen for fitting. The best fit yields a characteristic energy of 12 ± 3 meV for the binding of indirect excitons, where the error bar covers the fitting results for the different range of T. Such a low exciton binding energy (Eb) is expected for type-II MQW structures due to the spatial separation of electrons and holes. Figure 3(b) shows the Arrhenius plot of the normailized PL peak intensity for the same sample. The solid line is fitted by the equation:
IPL( )T =IPL(0) /[1+CAexp(−EA/k TB )] (3) where IPL(0) is the PL intensity at 0 K, CA is fitting constant, kB is the Boltzmann constant and EA is activation energy. We fitted the experimental valves for the low T range where the excitons are not totally dissociated (below 100 K). The obtained activation energy E (18 meV) is comparable to (Eb) obtained above.
We also plot the T-dependences of IPL (Lw = 1 nm) at a pumping power of 40
mW and below 0.1 mW in Fig. 4. The data were fitted by Eq. (3). The value of EA is
larger than the room temperature thermal energy and approximately twice that was obtained from the low-power excitation. It can be explained by the aforementioned band-bending effect, which strongly modifies the electron-hole wavefunction overlap. In the high excitation case, the wavefunctions of the carriers are expected to be strongly confined in the bent zones, which results in a strongly bound electron-hole pairs. Indeed, a decrease of three orders of magnitude has been reported for the recombination lifetimes of ZnSe/BeTe superlattices under high excitation [45]. Notably, the PL efficiency is mostly kept in the high excitation case. A drop of only about an order of magnitude in IPL was found from low T to 300 K. In contrast, the PL
efficiency decreases by at least two orders of magnitude in the weak excitation case and is hardly detected at room temperature. The indirect-exciton recombination rate enhances under a high excitation density, based on the band-bending model. The effect plays an important role in the observed high emission efficiency.
In conclusion, the tunability of the emission energy, oscillator strength and PL efficiency by varying the well thickness and excitation density was demonstrated in the strained ZnSe0.8Te0.2/ZnSe MQWs. The type-II nature of the recombination was
the binding energy of the indirect excitons is determined as 12 meV for the thinnest sample. A reduction in PL efficiency was found to be greatly suppressed by employing a high excitation power.
Fig. 1 (a) Low-T PL spectra of ZnSe0.8Te0.2/ZnSe MQWs. (b)Spectral distributions of
the decay times for the ZnSe0.8Te0.2/ZnSe MQWs. (c)Evolution of PL peak intensity
Fig. 2 PL spectra at various excitation powers for the sample with Lw = 3 nm. The inset plots the dependence of the PL peak energy on the cube root of the excitation power.
Fig. 3 (a) T-dependence of τPL (solid circles), τr (open circles) and τnr (open squares).
The solid line represents the fit of τr to Eq. 2, yielding a characteristic energy of 12±3
Fig. 4 Arrhenius plot of the normalized PL peak intensity for the ZnSe0.8Te0.2/ZnSe
MQW (Lw = 1 nm), under excitation powers of 40 mW (solid triangles) and below 0.1 mW (solid squares). Activation energies with the fitting errors were also shown.
Chapter 4
ZnTe/ZnSe quantum dots
In this chapter, the optical properties of type-II semiconductor ZnTe 0-D quantum dots (QDs) were investigated by temperature-dependent and time-resolved photoluminescence (PL) spectroscopy. The initial decrease then increase with temperature for the full width at half maximum (FWHM) of PL is attributed to the hole thermal escape from the smaller QDs then transfer and re-capture to the neighboring-larger QDs. The non-mono-exponential decay profiles reflect the processes of carrier transfer and recapture. We show that the Kohlrausch’s stretching exponential well fits the decay profile of ZnTe/ZnSe QDs.
The samples studied in this chapter were grown on GaAs (100) substrates with a Vecco Applied EPI 620 molecular beam epitaxy (MBE) system. Solid sources Zn, Te, and Se were used for the growth of self-assembled ZnTe QDs and ZnSe buffers. Prior to the growth procedure, GaAs (100) substrate was etched in a H2O2 : NH4OH : H2O
(1:5:50) solution for one minute at room temperature, rinsed in flowing de-ionized water about two minutes and dried with high purity N2. The substrate temperatures
conventional MBE. Immediately after the deposition of ZnSe buffer layer, the alternating supply method of ZnTe growth was performed. The root mean square roughness of the ZnSe buffer layer, determined from atomic force spectroscopy, is approximately 0.5 nm. The coverage of the single ZnTe QDs layer, grown on the flat ZnSe buffer layer, was varied from 1.8 to 3.0 ML. A 50 nm ZnSe capping layer was grown on the QDs for optical measurements. The strong PL was observed even in the 3.0 ML ZnTe QDs sample. It implies less defects in this sample. The excitation source for the conventional PL spectroscopy was the 325 nm-line of a He-Cd laser and the emissions were analyzed using the SPEX 1403 double grating spectrometer in conjunction with a thermoelectrically cooled photomultiplier tube. A pulsed GaN diode laser (405 nm) with pulse duration of 50 ps and a repetition rate of 2.5 MHz was used as an excitation source for the time-resolved measurement. The PL decay spectra were analyzed by a high-speed photomultiplier tube, followed by a personal computer plug-in time-correlated counting card. The overall time resolution of the detection system was about 300 ps.
Figure 1 shows the low-temperature PL spectra of ZnTe QDs with different values of coverage. The 1.8 eV to 2.2 eV energy emission band is sensitive to the change of coverage. The emission energies are lower than that (2.4 eV) of the ZnTe epilayer because of the type II band alignment of ZnTe/ZnSe QDs as reported
previously [29]. For the ZnTe/ZnSe QDs, holes are confined in ZnTe and electrons are localized in ZnSe with the Coulomb attraction from holes. The red-shift in energy is attributed to the decrease in the quantum confinement of the holes in ZnTe. Noted that there exists a critical coverage (near 2.4 MLs) for which the slope of the peak energy versus coverage changes, as shown in the inset of Fig. 1. This indicates a change from the 2-D layer growth to 0-D ZnTe QD formation. It is confirmed by the atomic force microscopy (AFM) measurements and reflection high energy electron diffraction (RHEED) patterns. In the case of type I CdSe/ZnSe QDs, smooth slope changes to abrupt slope as the growth varying from 2-D layer to 0-D dot [48]. The abrupt slope is attributed to the sudden increase in QD volume. It further results in a faster decrease in energy with the coverage MLs. However, for the type II ZnTe/ZnSe QDs, the formation of QD results in a decreasing electron-hole wave-function overlap and the exciton binding energy. Therefore, the decreasing of emission energy with coverage for 0-D QDs is not as fast as the 2-D layers. For the 3.0 ML sample, in addition to the main peak, a weak PL structure appears at 2.2 eV. It is attributed to the emission from the underlying wetting layer.
The temperature dependent PL spectra of 2.6 ML sample is shown in Fig. 2 (a). The peak energy exhibits red shift with increasing temperature. Whereas, the full
The FWHM as a function of the sample temperature is shown in Fig. 2(b). The initial decrease in FWHM at low temperature is attributed to the exciton thermal activation and escape from smaller QDs then recaptured by the larger QDs [49]. It results in a quench of the higher energy part of the PL spectra, which is contributed by the smaller QDs. The broadening of FWHM at high temperature regime is due to the exciton-longitudinal optical (LO) phonon interaction and can be fitted by line-width broadening model [50].
Figure 3 reveals the relation between PL intensity and inverse temperature. The dotted line is fitting curve using the equation
1 1 2 2 (0) ( ) 1 exp( / ) exp( / ) PL PL a B a B I I T D E k T D E k T = + − + − (1),
where T is the temperature, kB is the Boltzmann constant, D1 and D2 are fitting constant, ( )IPL T and IPL(0) are the integrated PL intensities at temperatures T and 0 K, and Ea1 and Ea2 are the activation energies. The smaller activation energy is due
to the activation of smaller QDs. The higher activation energy is attributed to the dissociation of exciton. This phenomenon corroborates the result of FWHM versus temperature plot, because the lower activation energy Ea1 is about several meV which
is very close to the temperature where the minimum FWHM and exciton activation/escape become significant.
ZnTe/ZnSe QD samples detected at their PL peak energies are shown in Fig. 4 with semi-log plot. The non-linear dependence is found. Such non-linear dependence could not be fitted by a mono-exponential function. As discussed in above mentioned temperature dependent FWHM and PL intensity, the PL spectra involve emissions from smaller and larger QDs and exciton transfer between them. Recently, the hopping-transport model has been proposed as the origin of the stretched exponential relaxation in complex condensed-matter systems [28]. Therefore, we propose that the decay profiles should be better fitted by the stretched exponential.
The stretched exponential, known as the Kohlrausch’s law, is the following equation:
IPL( )t =I0exp{ ( /− t τPL) }β (2) where ( )IPL t and I are the PL intensity at time t and 0, respectively. 0 τPL and β are the mean lifetime and stretched parameter, respectively. The higher energy part of PL originates from the emission of smaller QDs. Part of the holes relax to the smaller QDs then recombine with the attracted electrons immediately and give rise to a fast decay time. Part of the holes are thermally excited and transfer to the larger QDs as discussed in the above mentioned temperature dependant FWHM and PL intensity. The thermal activation and carrier transfer create other decay channels for exciton
sites of larger QDs. The lower parts of PL spectra are emissions due to the recombination from the larger QDs. It is better fitted by the stretched exponential function with a decay time of several hundred ns. The energy dependent decay times obtained by the stretched exponential are also plotted in Fig. 5. The increasing decay time with decreasing energy indicates the exciton thermal activation and transfer between smaller and larger QDs. This phenomenon is similar to the case of exciton transfer between localized states in CdSSe alloys [51]. The excitons in smaller QDs have higher energy and were thermally excited then transferred to larger QDs of lower energy localized states. As a result, the lower energy states have much longer decay time.
Figure 6 presents the PL lifetime and stretching exponent β of different values of coverage. The lifetimes of 2-D layers are longer than 100 ns. On the other hand, as the 0-D QDs are formed, the lifetime decreases to values less than 100 ns. It decreases with the coverage thickness. The stretching exponent β also drops as the coverage above 2.5 ML. The long decay time of 2-D layers could be attributed to the long traveling (transfer) time before recombination. However, for the 0-D case, the formation of QDs results in an increase in numbers of recombination centers and a decrease in the traveling time. Furthermore, the decreasing stretching exponent β reflects the increasing recombination centers and the size of QDs. This result is
closely related to the numerical analysis of hopping-transport models by Sturman et al. [28].
In conclusion, optical properties of MBE-grown type-II ZnTe QDs in ZnSe matrix were investigated by temperature-dependent and time-resolved PL spectroscopy. The PL results showed that the critical thickness for dot formation of SK ZnTe/ZnSe QDs is around 2.4 MLs. The two activation energies obtained from the temperature-dependent PL are consistent with the phenomenon of initial decrease in FWHM then increase with temperature. The PL decay profiles were reasonably fitted by the Kohlrausch’s stretched exponential which describes the hole activation from smaller QDs then transfer and re-capture to larger QDs. Current work shows that the Kohlrausch’s stretched exponential is very useful to analyze the decay profiles of the semiconductor QDs which involve carrier activation, transfer and then re-capture process.
1.8 2.0 2.2 2.4 2.0 2.4 2.8 1.8 2.0 2.2 H QD 2.8 ML 2.6 ML 2.5 ML 2.4 ML 2.2 ML 3.0 ML 2.0 ML 1.8 ML In ten s ity (a.u .)
Photon energy (eV)
ZnTe/ZnSe QDs T = 10 K P e ak en er g y ( e V ) Coverage (MLs)
Fig. 1: Low temperature PL spectra of ZnTe QDs with different coverages. The inset shows the PL peak energy of QD as a function of ZnTe coverage. The solid line is just a guide for eyes.
0 50 100 150 200 250 300 80 90 100 110 120 130 140 150 160 170 180 1.7 1.8 1.9 2.0 (b) FWHM (meV) Temperature (K) 2.6ML 2.6ML PL Intensity (a.u.)
Photon energy (eV) 160K *3
100K 10K
50K
(a)
Fig. 2: (a) Temperature dependent PL spectra of 2.6 ML sample. (b) The FWHM as a function of the sample temperature for 2.6 ML samples.
0.00 0.02 0.04 0.06 0.08 0.10 Ea1 = 4.5+0.4 meV Ea2 = 60.6+0.6 meV Integrated PL Intensity (a.u.) 1/T(1/K) 2.6 ML
0 100 200 300 400 3.0 ML 2.8 ML 2.6 ML 2.5 ML 2.4 ML 2.2 ML 2.0 ML
Normailized PL Intensity (a.u.)
Time (ns)
1.8 ML
Fig. 4: The decay profiles of the PL signal from ZnTe QDs detected at their PL peak energies with different coverage.
1.8 2.0 0 50 100 150 200 250 300 350 L ife ti m e ( n s) P L inte nsi ty (a .u .)
Photon energy (eV)
2.6 ML
1.8 2.0 2.2 2.4 2.6 2.8 3.0 50 100 150 200 0.0 0.2 0.4 0.6 0.8 1.0 Decay time (ns) Coverage (ML) Beta
Chapter 5
ZnMnTe/ZnSe quantum dots
In this chapter, optical properties of type-II diluted magnetic semiconductor (DMS) ZnMnTe quantum dots (QDs) were investigated by temperature-dependent, time-resolved and magneto-photoluminescence (PL) spectroscopy. The time-resolved magneto-PL was analyzed by σ+ and σ– circular polarization to study the electron and
hole spin dynamics. Both σ+ and σ– time-decay PL profiles can be well fitted by the
Kohlrausch’s stretching exponential function. In addition, the magnetic polarons are detected at temperature up to 100K.
The samples studied in this chapter were grown on GaAs (100) substrates by a Vecco Applied EPI 620 molecular beam epitaxy (MBE) system. After the deposition of ZnSe buffer layer, two kinds of alternating supply MBE methods were performed to grow the ZnMnTe QDs of 2.5 mono-layers (MLs). A 2.5 ML ZnTe QD sample (sample A) was also grown as a reference by the same growth conditions. Morphology investigation by atomic force microscopy (AFM) and PL spectra measurement were used to evaluate the sample quality for the choice of the best growth condition.
same time (Zn+Mn+Te, sample B). While the second method is opened the Mn for a few seconds and then Zn+Te (Mn then Zn+Te, sample C). The same Zn, Mn and Te flux were used as the growth condition of ZnMnTe epilayer of Mn ~ 11% for the growth ZnMnTe QDs. Figure 1 shows the AFM images of samples A, B, and C. Fig. 1(b) and Fig. 1(c) show that the size and density of sample B and C are larger than that of Fig. 1(a) of sample A. This is due to the larger lattice mismatch between ZnMnTe and ZnSe than that between of ZnTe and ZnSe. For the second alternating supply MBE method, we exposed the ZnSe surface to Mn flux for several seconds, Mn atoms aggregated on the ZnSe surface to form the nucleation center for the growth of ZnMnTe QDs.
Figure 2 shows the low temperature PL spectra of samples A, B, and C. The lower energy peaks are emissions from the QDs. While the broader and higher energy peaks near 2.2 eV (I0) are attributed to the emission from the underlying wetting layer.
The QDs peak energy from sample B is the lowest which is ascribed to the large dot size. The FWHMs of emission peaks from ZnMnTe QDs (90 and 98 meV) were larger than that of ZnTe QDs (80 meV). It is attributed to the broader QDs size distribution. The PL emission intensity of ZnMnTe QDs is weaker than that of ZnTe QDs, it also was observed in other DMS regardless of the sample geometry (i.e., in epi-layers and
recombination and Mn2+ intra-ion transitions [52]. It implies that the ZnMnTe QD
system grown by the second method exhibit better emission efficiency. Therefore, the multiple (ZnMnTe/ZnSe) QDs sample with 5 periods of 2.6 MLs ZnMnTe QDs and 10 nm ZnSe spacer and 50 nm ZnSe capping layer were grown by the second method for the study of magnetic polaron and spin dynamics. In addition, a series of single-layer ZnMnTe QD samples with different coverage (1.8 to 3.0 ML) were also grown by the second method to characterize the optical properties of (ZnMnTe/ZnSe) QDs.
Figure 3 shows the low-temperature PL spectra of ZnMnTe QDs with different values of coverage. The sharp PL features near 2.80 eV is attributed to the near band edge emission of the ZnSe matrix. There are mainly two emission bands observed in the PL spectra at the spectral region from 1.8 eV to 2.6 eV. The lower-energy emission band is due to QD recombination. The origin of the 2.3 eV emission band is wetting layer emission.
Figure 4 shows the time integrated PL spectra with σ+ and σ– circular
polarization at B = 0 and 5 Tesla (T) for a 2.6 MLs ZnMnTe/ZnSe QDs sample. The large difference in PL intensity between both polarization results from the magnetic field induced spin splitting of holes in ZnMnTe QDs and electrons in ZnSe matrix. The circular polarization P = (I - I)/(I + I) = 77% at 5 T, where I and I are the PL
intensities of σ+ and σ– circular polarization, respectively. The finite P is unexpected
for B = 0, when there is no expected preferential direction for Mn spin alignment. This non-zero circular polarization at B=0 is attributed to the formation of bound magnetic polaron caused by the exchange interaction between the localized holes and Mn 3d levels in the ZnMnTe QDs.
The circular polarization degree P as a function of B, obtained from low temperature, is shown in Fig. 5. The P abruptly enhances at low B and gradually saturates at high B. The magnetic field dependence follows the Brillouin function, which is a signature of Mn magnetism. Similar results were also observable for other DMS QDs [2, 3]. The insert of Fig.5 shows the splitting of the heavy-hole band and conduction band of ZnMnTe QD at B>0 and the allowed transitions for σ+ exciton
(heavy hole -3/2 spin state and electron -1/2 spin state) and σ– exciton (heavy hole
+3/2 spin state and electron +1/2 spin state). The light hole spin states are neglected due to the large compressive strain induced heavy-light hole splitting in ZnMnTe QDs and light hole exciton energy is much higher than heavy hole exciton energy. The spin splitting of the conduction electron in ZnSe is also ignored due to very small g factor. Assuming that the exciton recombination timeτR for both σ+ and σ– exciton are the
/ B E k T R S S dn n n n e G dt τ τ τ −Δ − − + − − = − + − (1), / B E k T R S S dn n n n e G dt τ τ τ −Δ + + + − + = − − + (2).
Where, n- represents number density of σ– exciton and n+ stands for number density of
σ+ exciton. τS corresponds to an effective spin relaxation time between the two
Zeeman levels. G+ and G- are generation rates for σ+ and σ– exciton, respectively. kBT
is thermal energy and Δ =E gμBB is the Zeeman splitting energy between σ+ and σ–
excitons. g is the effective g factor and μB is the Bohr magneton. For steady state condition, the ratio ρ = τS /τR can be obtained by the experimental data using the
following equation: / / 1 ( ) ( ) 1 (1 ) B B E k T E k T s R I I n n e P I I n n e τ τ Δ + − + − Δ + − + − − − − = = = + + + + (3).
For a very slow spin relaxation (τS >>τR), very large ρ = τS /τR results zero
circular polarization. In Fig.2, P = 77% at 5T , it results in approximate same order of magnitude for τS and τR.
In Fig. 5, the solid line is a fitting curve for the magnetic field dependence of circular polarization P by using equation Eq. (3) with fitting parameters, g factor and the ratio ρ =τS /τR. The best fit to the data yields g B
kT μ
= 0.94±0.03 (Tesla-1) and τS /τR = 0.31±0.01. This indicates that the spin relaxation time is about 3 times
In order to determineτR, the decay profiles of time-resolved PL were measured,
as shown in Fig. 6. The solid curve is a fit using the Kohlrausch’s stretching exponential function:
0
( ) exp{ ( / ) }
PL PL
I t =I − t τ β (4),
where τPL is the exciton radiative recombination time (τR), and β is the stretching
exponential. The solid line fits the experimental data reasonably. Figure 6 shows a very long decay time of about 76 ns due to the type II band alignment induced slow exciton recombination. The spin relaxation time is then estimated to be about 23 ns. This spin relaxation time is much longer than other type I QD systems [53] and could be useful for spin manipulations.
The time-resolved PL spectra were also analyzed by σ+ and σ– circular
polarization and correlated by the Kohlrausch’s stretching exponential function. The resultant data were shown in Fig. 7. The lifetimes of σ– (τσ−) exciton decreases with
the increasing magnetic field. On the other hand, the lifetimes of σ+ (τσ+) exciton is
almost independent of magnetic field. The increasing magnetic field results in the energy splitting of σ+ and σ– excitons, it further enhances the spin relaxation from the
higher energy σ– excitons to the lower energy σ+ excitons. As a result, τσ− is shorter
between τσ+and τσ− is about 25 ns, which is very close to the value obtained by equation (3).
Figure 8 shows the TR PL spectra in increments of 2 ns. The PL peak energy is initially at ~ 1.908 eV, gradually decreases, and reaches the value of ~ 1.894 eV. According to Refs. 2 and 18, we attribute this evolution of the PL peak to the formation of magnetic polarons (MPs). In this process, the hole spin aligns the randomly oriented Mn spins, resulting in a Zeeman splitting [40] of the hole levels. The time-resolved PL peak position at t = 0 corresponds to the exciton recombination the Mn spins are not aligned at this moment. During the subsequent alignment, the hole occupies preferentially the lower Zeeman level and therefore the exciton PL peak undergoes a redshift as a function of time with a characteristic MP formation time
MP
τ . In addition, during this process the linewidth of the PL narrows slightly (see Fig. 8), suggesting a reduction in the magnetic disorder of the QDs [54].
In Fig. 9, we show the time-resolved PL spectra in increments of 2 ns for ZnTe MQDs. Contrary to the behavior of ZnMnTe MQDs, the PL energy of the nonmagnetic sample exhibits just only a slightly red-shift within the formation time of MPs in magnetic sample. This effect could be attributed to band bending resulting from the formation of diopole layer or carrier transfer between the smaller dots and
larger dots due to the broad size distribution. Therefore the redshift in ZnMnTe/ZnSe MQDs is a signature of magnetic spin alignment and the formation of MPs.
Figure 10 shows the peak energy of the PL as a function of time t at various temperatures. The MP formation persists up to 100K, about 3 times higher than the MP in CdSe/ZnMnSe QDs, which persisted only up to 30 K [30]. It is well known that the energy gain due to the formation of a MP can be described by a single exponential law [55, 56]
( ) ( 0) MP[1 exp( / MP)]
E t =E t= −E − −t τ (5),
where E t is the transient recombination energy, ( ) E is the polaron binding energy MP
(i.e., the total energy shift when equilibrium is reached, when the Mn spins become fully aligned by the exchange field of the exciton), and τMP is the exciton MP formation time. In Fig. 10 the solid line of equation (6) fits the experimental data reasonably. Figure 11 shows the fitting of E and MP τMP by using equation (6) at different temperature. Weak temperature dependence of E and MP τMP was observed even up high temperature. This unique property of type II ZnMnTe QDs is very different with the other type I magnetic QDs [30, 57].
In conclusion, the magnetic field dependence of PL circular polarization degree follows the Brillouin function and evidences the Mn magnetism in ZnMnTe QDs. In
relaxation time of about 23 ns. In addition, we found that the Kohlrausch’s stretching exponential function well correlates both the σ+ and σ– decay profiles. Furthermore,
the magnetic polaron persists up to 100 K and the formation energy is roughly independent of temperature.
(a) Zn+Te (b) Zn+Te+Mn (c) Mn then Zn+Te Fig.1. AFM image of (a) ZnTe QDs, (b) ZnMnTe QDs grown by opening the Zn, Te, and Mn flux at the same time, and (c) ZnMnTe QDs grown by first starting the Mn flux then Zn and Te flux.
1.8 2.0 2.2 2.4
Intens
ity (a.u.)
Photon energy (eV)
Mn+ZnTe Zn+Mn+Te
ZnTe
Zn(Mn)Te QD 2.5 ML
Fig. 2. Low temperature PL spectra of 2.5 MLs of ZnTe QDs, ZnMnTe QDs grown by opening the Zn, Te, and Mn flux at the same time, and ZnMnTe QDs grown by first starting the Mn flux then Zn and Te flux.
3.0 2.8 2.6 2.4 2.2 2.0 1.8 1.6 1.8 ML 2.2 ML 2.4 ML 2.6 ML 2.5 ML 2.8 ML 3.0 ML 2.0 ML
Photon Energy (eV)
Photoluminescence (a. u.)
ZnMnTe/ZnSe QDs T = 10 K QD H ZnSe 2.10 2.00 1.90
PL peak energy (eV) 2.0 2.4 2.8 coverage (ML)
Fig. 3 Low temperature PL spectra of ZnMnTe QDs with different coverages. The inset shows the PL peak energy of QD as a function of ZnMnTe coverage. The solid line is just a guide for eyes.
Fig. 4 PL spectra with σ+ (solid line) and σ– (dashed line) circular polarization of a 2.6
Fig. 5 Plot of circular polarization as a function of magnetic field at 10K (circle). Insert: schematic conduction and heavy-hole band diagram of ZnMnTe/ZnSe quantum dots at B>0. The spin splitting in ZnSe is ignored.
Fig. 6 Decay profile of ZnMnTe/ZnSe QDs. The red solid curve is a fit using the Kohlrausch’s stretching exponential function described in the text.
0
1
2
3
4
5
6
40
50
60
70
80
90
100
Lifeti
me (ns)
Magnetic field (T)
τσ+ τσ−Fig. 7 Lifetime as a function of magnetic field. The squares represent σ+ and circles
1.80 1.84 1.88 1.92 1.96
1.894 eV
PL Intensi
ty (a.u.)
Photon energy (eV)
0 ns 2 ns 4 ns 6 ns 8 ns 10 ns 12 ns 14ns 16 ns 18 ns 20 ns 1.908 eV
1.84 1.88 1.92 1.96 PL Inten s ity (a .u .)
Photon energy (eV)
1.905 eV 0 ns 2 ns 4 ns 6 ns 8 ns 10 ns 12 ns 14ns 16 ns 18 ns 20 ns 1.910 eV
-5 0 5 10 15 20 25 30 35 40 1.885 1.890 1.895 1.900 1.905 P h
ton energy (eV)
Time (ns) 10 K 25 K 50 K 75 K 100 K
0 20 40 60 80 100 5 10 15 0 20 40 60 80 100 2 4 6 8 10 12 14 16 18 τ mp (n s) Em p ( m e V ) Temperature (K)
Fig. 11 Temperature dependence of the magnetic-polaron formation time (right) and magnetic-polaron binding energy (left).
Chapter 6
ZnTe/ZnMnSe quantum dots
In this chapter, optical properties of type-II diluted magnetic semiconductor (DMS) ZnTe/ZnMnSe quantum dots (QDs) were investigated by low temperature, time-resolved and magneto photoluminescence (PL) spectroscopy. The magneto-optical measurement demonstrates a magnetic-induced degree of circular polarization in the PL spectra. In addition, the magnetic polarons formation was also observed in this system.
The samples studied in this chapter were grown on GaAs (100) substrates by a Vecco Applied EPI 620 molecular beam epitaxy (MBE) system. Solid sources Zn, Te, Mn and Se were used for the growth of self-assembled ZnTe QDs and Zn(Mn)Se buffers. The growth rate for ZnMnSe buffer layer is 0.04 nm/s, and the growth rate for the ZnTe QDs is 0.03 nm/s. The effusion cell temperatures of Zn, Mn, Se, and Te are 294, 695, 178, and 310 oC, respectively. Prior to the growth procedure, GaAs (100) substrate was etched in a H2O2 : NH4OH : H2O (1:5:50) solution. The substrate
temperatures were set at 300 ℃. The growth process started with several mono-layers (MLs) of ZnSe by migration enhanced epitaxy, followed by a ZnSe buffer layer of 50 nm by conventional MBE. The 50 nm ZnMnSe buffer layer growth follows the