國 立 交 通 大 學
工 業 工 程 與 管 理 學 系
碩士論文
應用田口方法品質分析於單壁奈米碳管的原材料
Quality Analysis of SWNT Raw Materials and
Buckypaper using the Taguchi Method
研 究 生:黃柏儒
指導教授:巫木誠 博士
Quality Analysis of SWNT Raw Materials and
Buckypaper using the Taguchi Method
研究生:黃柏儒
Student:Po-Ju Huang
指導教授:巫木誠 博士
Advisor:Dr. Muh-Cherng Wu
國立交通大學
工業工程與管理學系
碩士論文
A Thesis
Submitted to Department of Industrial Engineering and Management
College of Management
National Chiao Tung University
In Partial Fulfillment of the Requirements
For the Degree of Master of Science
In
Industrial Engineering
September 2008
Hsin-Chu, Taiwan, Republic of China
應用田口方法品質分析於單壁奈米碳管的原材料
研究生:黃柏儒 指導教授:巫木誠 博士國立交通大學工業工程與管理研究所碩士班
中文摘要
對奈米科技而言,選擇正確單壁奈米碳管的規格而用來製造出需要的奈米碳 管紙的品質是很重要的。本篇論文以一種統計實驗設計方法-田口方法來解決這 個重要的問題。奈米碳管紙的過濾時間、平均導電性、表面面積、平均碳管直徑 和孔徑當作品質特性,單壁奈米碳管的平均碳管直徑、純度和導電性當作重要參 數。田口方法分析結果顯示奈米碳管的平均碳管直徑對於奈米碳管紙的過濾時 間、導電性和平均碳管直徑有顯著的影響。奈米碳管的導電性對於奈米碳管紙的 導電性也有重要的影響。後來由幾次實驗也驗證了田口方法的分析結論是正確 的。結論,我們可以藉由控制單壁奈米碳管的重要參數來製造出所需要的奈米碳 管紙的品質。Quality Analysis of SWNT Raw Materials and
Buckypaper using the Taguchi Method
Student : Po-Ju Huang Advisor:Dr. Muh-Cherng Wu
Department of Industrial Engineering and Management
National Chiao Tung University
ABSTRACT
It is critical to choose the correct specification of carbon nanotubes (CNTs) from a CNT company in order to fabricate a desired quality of nanotube buckypaper (NBP). In this paper, a statistical experimental design method, Taguchi method with an L4 orthogonal array robust design, was applied to resolve this problem. Filtration, electrical conductivity, surface area, rope diameter and pore size of NBPs were considered as the properties. The rope diameter, purity and electrical conductivity of carbon nanotubes were chosen as significant parameters. As a result of Taguchi analysis in this study, rope diameter was determined to be the most influencing parameter on the filtration time, electrical conductivity and rope diameter of NBPs. The electrical conductivity of CNTs also had a principal effect on the electrical conductivity of NBPs. The optimal conditions were determined by using Taguchi method. There is good agreement that is being observed between the prediction and experiment. Consequently, desired NBPs can be fabricated by controlling the significant parameters of CNTs.
Acknowledgements
I am indebted to several mentors, especially my advisor, Professor Muh-Cherng Wu, who showed concern and support for my efforts. He taught me both the proper approach to and attitude toward problem solving. Professor Chuck Zhang taught me the importance of completeness in a study, Professor Richard Liang helped me overcome research bottlenecks many times, and Professor Ben Wang gave me many valuable suggestions.
I also would like to thank the committees of my defense presentation, Professor Muh-Cherng Wu, Professor Der-Baau Perng, Professor Wen-Lea Perng and Professor Yung-Chia Chang. They taught how to revise my thesis, and gave me lots of suggestions.
I also wish to thank several classmates. Kuan-Hsien Chiang kindly provided advice on analysis methods; we met frequently via MSN whenever I came to a dead end. Other fellow lab members also assisted me in developing this research.
Finally, this thesis could not have been completed without the endless love and support from my father, mother, and the rest of my family. I owe all of my achievements to them and send them my love and gratitude.
Doubtless, I could not graduate without these important people that I had mentioned above.
Contents
Abtract (in Chinese) ... I Abtract (in English) ... II Acknowledgements ... III Contents ... IV List of Tables ... V List of Figures ... VI 1. Introduction ... 1 1.1. Research Motivation ... 1 1.2. Research Method ... 2 1.3. Research Objective ... 2 2. Literature Review ... 3 2.1. Structure of Nanotubes ... 3
2.2. Carbon Nanotube Buckypaper ... 8
2.3. Characterization of Nanostructure ... 9
2.3.1. Rope Size ... 10
2.4. Surface Area of Buckypaper ... 12
2.5. Electrical Conductivity of Buckypaper ... 13
2.6. Taguchi Method ... 14
2.6.1 Principle of Taguchi Method ... 15
2.6.2 Application of Taguchi Method ... 15
2.7. Summary ... 17
3. Experiments ... 18
3.1. Suspension Preparation Process ... 18
3.2. NBP Filtration Process ... 19
3.3.Orthogonal Array and Experimental Parameters ... 20
4. Results and Discussion ... 23
4.1. CNTs’ Electrical Conductivity Measurement Methodology ... 23
4.2. Taguchi Array Design and Analysis of Variance... 24
4.3 Determination of Optimal Conditions using Taguchi Method ... 30
5. Conclusion and future works ... 35
List of Tables
TABLE 2.1 EXPERIMENTAL MEASURED VALUES FOR PARTICLE SIZE AND STANDARD DEVIATION (S.D.) OF SILVER PARTICLES AND S/N RATIO (TAGUCHI
ORTHOGONAL ARRAY TABLE OF L9(34)) ... 16
TABLE 2.2 S/N RESPONSE TABLE FOR PARTICLE SIZE ... 16
TABLE 2.3 S/N RESPONSE TABLE FOR STANDARD DEVIATION ... 16
TABLE 2.4 RESULTS OF THE CONFIRMATION EXPERIMENT FOR PARTICLE SIZE AND STANDARD DEVIATION ... 17
TABLE 3.1 ROPE DIAMETER, PURITY AND ELECTRICAL CONDUCTIVITY OF SIX DIFFERENT BATCHES OF CNTS ... 21
TABLE 3.2 TAGUCHI ORTHOGONAL ARRAY TABLE OF L4 ... 21
TABLE 3.3 THE FOUR BATCHES FITTED TAGUCHI ORTHOGONAL ARRAY ... 22
TABLE 3.4 PARAMETERS AND LEVELS USED IN THIS EXPERIMENT ... 22
TABLE 4.1 THE MEASUREMENT METHODOLOGY ... 23
TABLE 4.2 EXPERIMENTAL MEASURED VALUES FOR FILTRATION TIME OF NBPS AND S/N RATIO ... 25
TABLE 4.3 EXPERIMENTAL MEASURED VALUES FOR ELECTRICAL CONDUCTIVITY OF NBPS AND S/N RATIO ... 25
TABLE 4.4 EXPERIMENTAL MEASURED VALUES FOR SURFACE AREA OF NBPS AND S/N RATIO ... 26
TABLE 4.5 EXPERIMENTAL MEASURED VALUES FOR ROPE DIAMETER OF NBPS AND S/N RATIO ... 26
TABLE 4.6 EXPERIMENTAL MEASURED VALUES FOR PORE SIZE OF NBPS AND S/N RATIO ... 26
TABLE 4.7 THE ANOVA TABLE OF FILTRATION TIME FOR THE POOLING METHOD ... 27
TABLE 4.8 THE ANOVA TABLE OF ELECTRICAL CONDUCTIVITY FOR THE POOLING METHOD ... 27
TABLE 4.9 THE ANOVA TABLE OF SURFACE AREA FOR THE POOLING METHOD ... 28
TABLE 4.10 THE ANOVA TABLE OF ROPE DIAMETER FOR THE POOLING METHOD ... 29
TABLE 4.11 THE ANOVA TABLE OF PORE SIZE FOR THE POOLING METHOD ... 29
TABLE 4.12 S/N RESPONSE TABLE FOR FILTRATION TIME OF NBPS ... 31
TABLE 4.13 S/N RESPONSE TABLE FOR ELECTRICAL CONDUCTIVITY OF NBPS ... 32
TABLE 4.14 S/N RESPONSE TABLE FOR ROPE DIAMETER OF NBPS ... 32
TABLE 4.15 LEVEL VALUES OF THREE BATCHES ... 33
TABLE 4.16 RESULTS OF THE CONFIRMATION EXPERIMENT FOR ELECTRICAL CONDUCTIVITY, FILTRATION TIME AND ROPE DIAMETER OF NBPS ... 34
List of Figures
FIGURE 2.1 SCHEMATIC DIAGRAM OF C60MOLECULE ... 4
FIGURE 2.2 SCHEMATIC DIAGRAMS OF C60,C70 AND C80 MOLECULES ... 4
FIGURE 2.3 SCHEMATIC DIAGRAM OF A GRAPHENE SHEET ROLLED UP TO FORM A NANOTUBE ... 5
FIGURE 2.4 A SCHEMATIC DIAGRAM OF (A) A SWNT AND (B) A MWNT ... 5
FIGURE 2.5 CLASSIFICATION OF CARBON NANOTUBES:(A) ARMCHAIR,(B) ZIGZAG, AND (C) CHIRAL NANOTUBES ... 6
FIGURE 2.6 SCHEMATIC DIAGRAM OF A CHIRAL VECTOR ROLLING UP TO FORM A SWNT WITH DIFFERENT LATTICE VECTORS ... 7
FIGURE 2.7 A.SEM IMAGE OF THE SURFACE OF BUCKYPAPER AFTER THE FIRST CROSS-FLOW FILTRATION STEP. B.SEM IMAGE OF THE RAW SWNT MATERIAL SHOWN IN A PRIOR TO PURIFICATION ... 9
FIGURE 2.8 GAUSSIAN FIT OF SWNT DIAMETER DISTRIBUTION ... 11
FIGURE 2.9 SHIFT OF SWNT DIAMETER DISTRIBUTION IN DIFFERENT APPARATUSES .. 12
FIGURE 2.10 TEMPERATURE-DEPENDENT ELECTRICAL RESISTANCE OF THE BUCKYPAPER SAMPLE ... 14
FIGURE 3.1 FLOW CHART OF SUSPENSION PREPARATION PROCESS ... 19
FIGURE 3.2 FLOW CHART OF NBP FILTRATION PROCESS ... 20
FIGURE 4.1 SCHEMATIC DIAGRAM OF COPPER MOLD ... 24
CHAPTER 1 INTRODUCTION
1.1 Research Motivation
The discovery of carbon nanotubes (CNTs) introduced a new world of nanotechnology. A number of experimental investigations proved that CNTs are molecular-scale tubes of graphitic carbon possessing outstanding properties, such as elastic modulus, tensile strength, unique thermal conductivity, and electrical conductivity [1, 2]. Hence, CNTs are regarded as the most promising reinforcement material for the next generation of high-performance structural and multifunctional composites. In addition, CNTs evoke great interest in polymer-based composites research. However, due to nanometric dimensions and strong inter-tube van der Waals attractions, SWNTs (Single-Wall Nanotubes) have the tendency to align parallel to each other and pack themselves into crystalline ropes [3]. Those aggregations were found to act as an obstacle to most applications, diminishing the mechanical and electrical properties of resulting composite materials. Satisfactory dispersion and the uniform distribution of SWNTs are essential elements in achieving improved mechanical properties in nanocomposites [4-5]. One effective method to achieve uniform dispersion is to preform nanotubes into nanotube buckypaper (NBP) [6].
NBPs are made up of robust networks of SWNTs, which compensates for the variations from individual nanotubes and offers some interesting properties [7]. However, large variations of quality of NBPs were observed due to different specifications of CNTs from the CNT companies. Therefore, determining how to order the correct specifications of CNTs from the CNT companies in order to produce desired quality and stable variation NBPs is important. In order words, establishing a systematic order rule between the NBPs manufacturers and CNT companies is imperative.
1.2. Research method
In this thesis, Taguchi robust design method [8-10] is introduced. Taguchi method is an engineering technique used in an empirical study. The method is economical for characterizing a complicated process. It uses fewer experiments required in order to study all levels of the input parameters and filters out some of the effects that occur due to statistical variation. Taguchi method can also determine that the experimental condition that has the least variability is the approximate optimum condition. The variability can be expressed by the signal to noise (S/N) ratio. The experimental condition having the maximum S/N ratio is considered the approximate optimal condition, as the variability of characteristics is in inverse proportion to the S/N ratio.
1.3. Research Objective
The objectives of this work are to: (1) evaluate the effect of purity, electrical conductivity and rope diameter of CNTs on the filtration time, electrical conductivity, surface area, rope diameter and pore size of NBPs; (2) define how to measure the electrical conductivity of CNTs; and (3) apply the statistical experimental design and Taguchi method on the optimization of properties and obtain the desired quality of NBPs by using the correct specification of CNTs from the CNT companies.
CHAPTER 2 LITERATURE REVIEW
Carbon nanotubes possess exceptional physical and mechanical properties together with their nanoscale diameter and hollowness which reveal their strong, light weight, and high toughness characteristics. They own unique electronic properties, high thermal conductivity, and extraordinary mechanical properties accompanied by stiffness, strength, and elasticity exceeds any previously existing reinforcement materials. These excellent characteristics moved carbon nanotubes into the spotlight in the 21 century. For their superior thermal and electrical properties, theoretical and experimental results have revealed: thermally stable up to 2800oC in vacuum, extremely high thermal conductivity about twice as diamond, and electric-current-carrying capacity 1000 times greater than copper wires [11]. For the mechanical properties, they also possess extremely high tensile modulus, ranging around 270 GPa to 1 TPa and own 11-200 GPa strength, which is 10-100 times higher than the strongest steel at a fraction of the weight [12-13]. Carbon nanotubes have been the focus of considerable research and offer tremendous opportunities for the development of fundamentally new material systems. This chapter mainly describes the structure and properties of carbon nanotubes
2.1 Structure of Nanotubes
Fullerenes have been addressed before the carbon nanotube discussion. The chemistry of fullerenes is like a geometric cage structures of carbon atoms, and is composed of hexagonal and pentagonal faces, which were discovered by Smalley
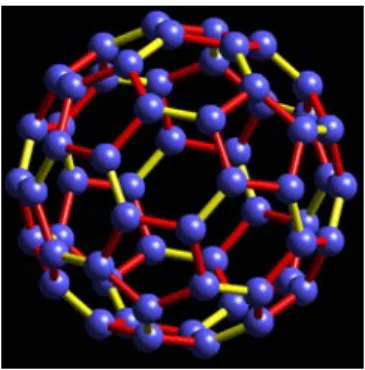
group in the mid 1980s [14]. Based on the fullerenes, C60 molecule further was deduced and discovered by Kroto group in 1985. C60 molecule is often referred to as Buckyballs [14], which consisted of sixty carbon atoms and was surrounded by 20 hexagons and 12 pentagons similar into the shape of soccer ball shown in Figure 2.1.
Figure 2.1 Schematic diagram of C60 molecule
Since the discovery of C60, similar purified carbon molecules were consequentially revealed such as C70 and C80. C70 was displayed by the shape of an ellipse, which consisted of 25 hexagons and 12 pentagons, while the structure of C80 can be treated as the transverse development of a C70. These led to the synthesis of carbon nanotubes investigated by Iijima after few years later [15]. Figure 2.2 shows the C60, C70 and C80 molecules
Figure 2.2 Schematic diagrams of C60, C70 and C80 molecules
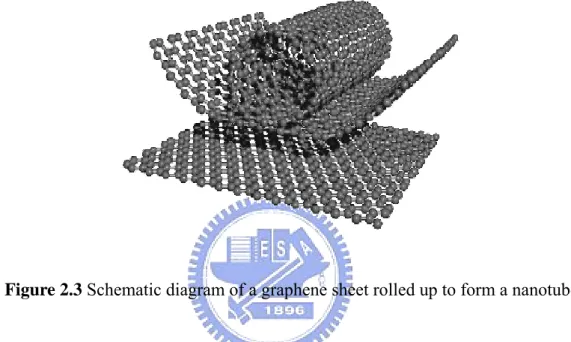
The structure of nanotubes can be considered as a graphene sheet that has been rolled up to form a cylinder with axial symmetry along the long axis of the tube.
Diameter of nanotubes can range from 0.3 nm to around 10 nm. By comparison, the length of the cylinder can reach into a millimeter-scale, and thus having an aspect ratios of 105~106. Many research scientists use SWNTs to approximate one-dimensional systems in dimensionally-constricted experiments [16]. Figure 2.3 shows the schematic diagram of a graphene sheet rolled up to form a nanotube.
Figure 2.3 Schematic diagram of a graphene sheet rolled up to form a nanotube
Multi-walled nanotubes (MWNTs) are another nanotube category. A MWNT consist of several graphene layers which are coaxially arranged around the central axis of the tube, with a constant separation between the layers of 0.339 nm [17-19]. Figure 2.4 shows a schematic diagram of SWNTs and MWNTs.
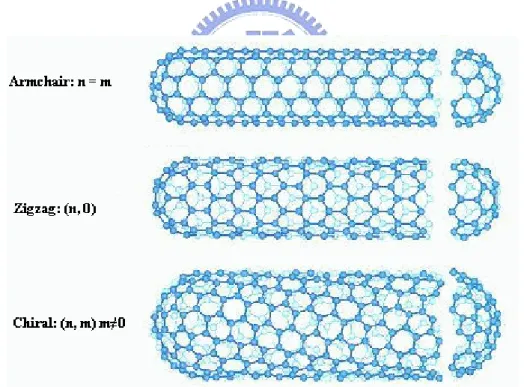
To understand the helical properties of nanotubes further, we can look at the periodic arrangement in structure along the tube axis. A single tube can primarily be classified as achiral (symmorphic) or chiral (non-symmorphic) [20-21]. An achiral CNT is defined by a CNT whose mirror image has an identical structure to the original one. Only two kinds of achiral nanotubes have been found to exist—“armchair” and ‘zigzag’ tubes. The names refer to the arrangement of hexagons around the circumference of the tube, as illustrated in Figure 2.5 (a) and (b), respectively. Chiral CNTs exhibit a spiral symmetry whose mirror image cannot be superposed on to the original, as illustrated in Figure 2.5 (c). It is the inherent chirality of the nanotubes which leads to such a range of geometries; and thus, a wide-range of properties of the individual tubes and the composites they make up.
Figure 2.5 Classification of carbon nanotubes: (a) armchair, (b) zigzag, and (c) chiral nanotubes
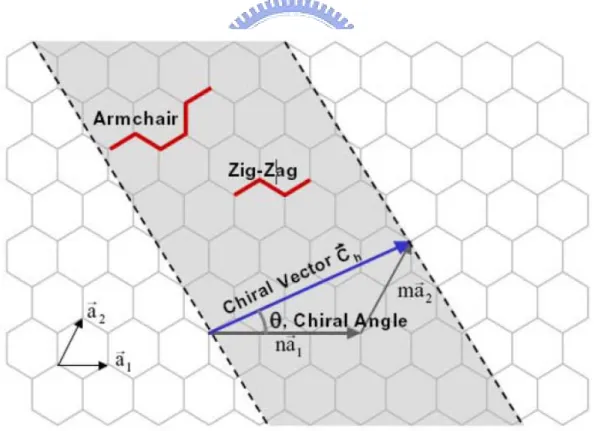
Figure 2.6 shows how a hexagonal sheet of graphite is “rolled” to form a carbon nanotube. The tubes are uniquely determined by their lattice vectors, h. The chiral
angle is denoted by θ as the angle between h and the zigzag direction, and the lattice vector h often known as the roll-up or chiral vector, which can be described by the following equation:
(1) where n, m are integers, and , are the unit vectors of graphite. As shown in Figure 2.6, connects two crystallographically equivalent sites, A and A’, on a two-dimensional graphene structure. The graphene cylinder is formed by connecting the points A and A’. The cylinder joint is made along the lightly dotted lines perpendicular to According to this formula above, the diameter of the nanotube could be determined once the chiral properties are measured.
Figure 2.6 Schematic diagram of a chiral vector rolling up to form a SWNT with different lattice vectors
the tubes. In general, nanotubes could be specified based on the tube diameter d, and the chiral angle θ. In terms of the roll-up vector, the zigzag nanotube is (n, 0) with chiral angle θ = 0, while the armchair nanotubes are defined as the chiral angle θ = 30 and the translation indices is (n,n). All other types of nanotubes could be defined as a pair of indices (n,m), where n ≠ m.
2.2 Carbon Nanotube Buckypaper
The term “buckypaper” was coined by Smalley and his research group [22]. Buckypaper was a freestanding mat peeled off the membrane of SWNT purifying process. After the raw SWNT material was produced, purification started with a 45 hours reflux in 2-3 M nitric acid. Following the reflux, the black solution was centrifuged, leaving black sediment at the bottom of the centrifuge bottle and supernatant acid, which was decanted. The sediment still contained substantial trapped acid, which required repeated washing/centrifugation cycle processing to clean off the acid. The remaining, nearly neutral solution was completely black, which was made even more stable when centrifugation time was extended. The black coloration of the supernatant solution resulting from the lengthier centrifugations was the fraction of the decomposition product having a very high solubility in the nearly neutral aqueous solution. This solubility provided the means for removal of the bulk of this impurity: filter washing with mildly a basic solution, pH11 NaOH. Triton-X 100 was added as surfactant to prevent the impurity impedes the filtration efficiency.
In the filtration process, solids are dispersed in 1.8 l of pH 10 solution containing 0.5 vol. % Triton-X 100 by ultrasonic agitation (in a bath sonicator) for around 1 hour that is called post-acid treatment. The process used vacuum filtering, which helped the
liquid passing through a PTFE membrane (Millipore LS, 5-µm pore). The post-process, washing SWNT with methanol, was effectively to remove the residual surfactant. Furthermore, a thick SWNT layer is formed and can be peeled off from the membrane, which produces a freestanding mate, “buckypaper”.
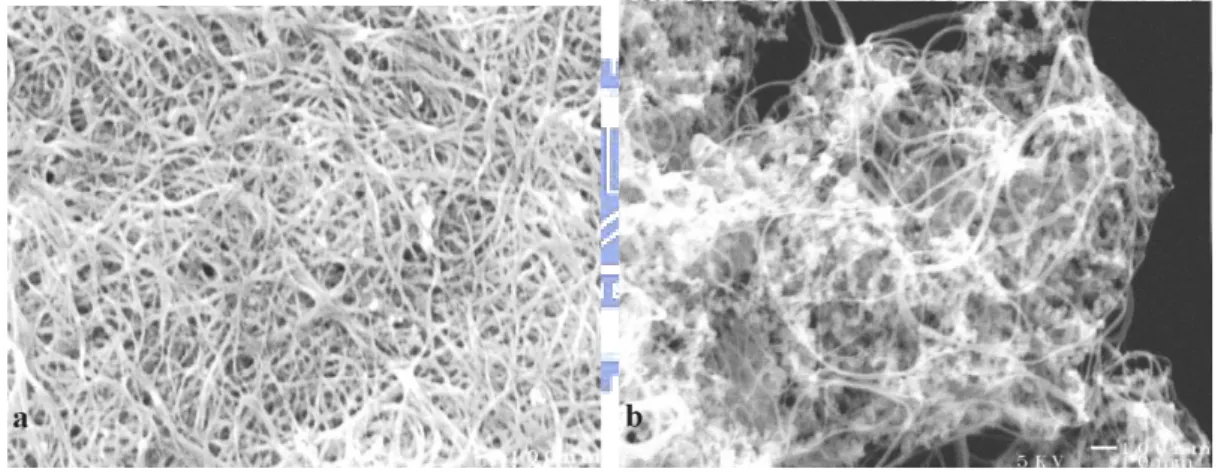
Figure 2.7 (a) and (b) are SEM images comparing the surface of buckypaper with and without purification. The SWNT raw materials with bad quality were used to demonstrate the efficacy of this process. The weight of buckypaper and the volume ratios of the sampled volume to the total solution volume is typically 10%-20%, depending upon the initial raw material quality.
Figure 2.7 a. SEM image of the surface of buckypaper after the first cross-flow filtration step. b. SEM image of the raw SWNT material shown in a prior to
purification
2.3 Characterization of Nanostructure
Carbon nanotubes are expected to exhibit superior mechanical and electrical properties as a direct consequence of the nanometric dimensions of individual tubes. However, the single-wall carbon nanotube (SWNT) aligned parallel to each other and packed into crystalline ropes, due to strong intertube van der Waals attraction.
Aggregation of nanotube acted as an obstacle in most applications, diminishing the excellent mechanical and electrical properties of the composite materials [23]. In other words, tube and rope structures influence the properties of the composite materials a lot. Therefore, characterization of the nanomaterials and their structures is a critical phase. In fact, it is crucial to perform a quantitative evaluation on the characteristics of the nanostructure and develop our fundamental understanding of process-nanostructure-property relationships. The following section summarizes the efforts on the characterization of nanostructures of nanotubes and buckypapers.
2.3.1 Rope Size
The excellent properties usually refer to an individual SWNT in most cases. Nanotubes tend to form into large bundles due to strong inter-tube van der Waals forces which reduce the mechanical properties of nanotube composites. Breaking nanotube bundles through different kinds of dispersion methods is believed to improve the properties of nanotube significantly. For example, the elastic modulus of a nanotube bundle less than 10nm can reach as high as 290 GPa, which is comparable to the conventional IM7 carbon fiber [24]. Researchers have been relating rope size of nanotubes to their excellent properties.
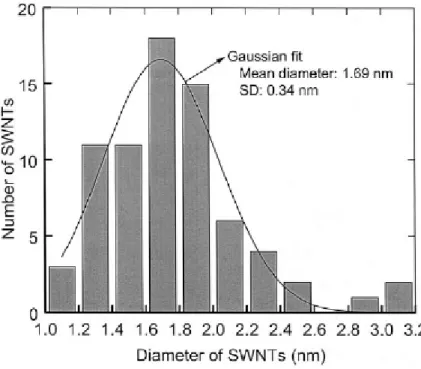
A good example was carried out by Dresselhaus [25] when they characterized the synthesized SWNTs by the catalytic decomposition of hydrocarbon. The SWNTs were observed via high-resolution transmission electron microscope (HRTTM). Their diameters were measured and fitted into a Gaussian distribution, as shown in Figure 2.8. The average diameter of the SWNTs was 1.69nm with standard deviation of 0.34nm.
Figure 2.8 Gaussian fit of SWNT diameter distribution
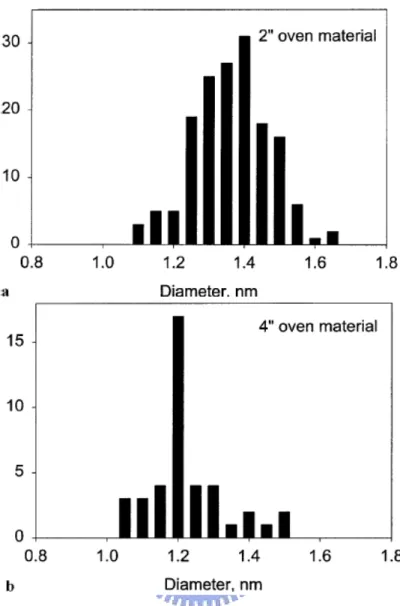
Smalley’s group [26] also characterized purification process of SWNTs using Scanning Electron Microscopy (SEM), Transmission Electron Microscopy (TEM), X-ray Diffraction (XRD), Raman scattering, and Thermal Gravimetric Analysis (TGA). In Figure 2.9, the diameter distribution of SWNTs made in the 2” oven system at 1200 oC was compared with 4” oven system at 1100 oC. The materials made under the distinct conditions encountered in these systems caused a change in the diameter distributions. Those differences are such as the peak in the 4” apparatus material is at around 1.2 nm rather than the 1.4 nm obtains in the 2” apparatus.
Figure 2.9 Shift of SWNT diameter distribution in different apparatuses
2.4 Surface Area of Buckypaper
Nanotubes have large aspect ratios, large surface areas, and are attracting to several new types of nanofluidic devices, absorbents, and catalysis supports in many applications.
The Brunauer-Emmett-Teller (BET) method is widely used to calculate the specific surface areas of nanotubes by the physical adsorption of gas molecules
[27-30]. The BET theory is based on estimating the monolayer capacity from multilayer adsorption data at relative pressures generally ranging from 0.05 to around 0.3 [31]. The pressure increased then decreased incrementally, and the gas adsorption and desorption is measured proportional to the change of equivalent pressure. From the gas sorption isotherm, the surface area can be calculated.
SWNTs have large aspect ratios and the BET surface area of a single SWNT can reach as high as 1300 m2/g [31]. However, the BET surface area decreased as SWNTs
formed into a large bundle, to average of 285 m2/g. The buckypaper also has a high
BET surface area and flexible networks, which can be utilized for applications of energy generation, biochemistry, gas storage and other nanotechnologies.
2.5 Electrical Conductivity of Buckypaper
Electrical conductivity of nanomaterials is another important research issue. SWNTs possess such superior electrical conductivity that their electric current-carrying capacity is 1000 times greater than copper wire [32-36].
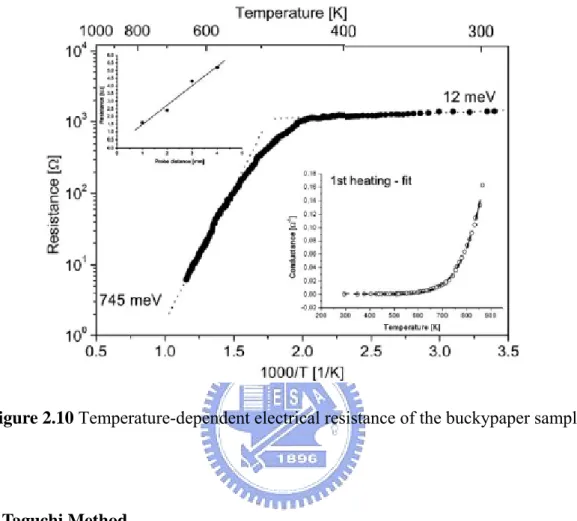
Kulesza [37] measured the active energy of buckypaper from 300 to 800 K. As Figure 2.10 shows, two distinct regimes of the electrical conductivity are observed: 12 meV at moderate temperatures and 745 meV at high-temperatures. Inset is the resistance vs. probe distance plot used to estimate the contribution of the contact resistance to the overall resistance. At moderate temperatures of 300 to 500 K, the activation energy is 90 MeV, and while at high temperatures of 500 to 800 K, the activation energy increases up to 370 MeV. The latter activation energy is consistent with that obtained by using the parallel resistance model (EA = 399 meV, the
asymptotic resistance R ∞ = 0.93 Ω , and the linear resistance coefficient α = 53 Ω / K).
Figure 2.10 Temperature-dependent electrical resistance of the buckypaper sample
2.6 Taguchi Method
Taguchi method is a scientifically disciplined statistical analysis tool for evaluating and implementing improvements in products, processes, materials, equipment, and facilities. These improvements are aimed at improving the desired characteristics and simultaneously reducing the number of defects by studying the key variables, controlling the process, and optimizing the procedures or design to yield the best results.
The method is applicable over a wide range of engineering fields that include processes that manufacture raw materials, sub systems, products for professional and consumer markets. In fact, the method can be utilized to any process be it engineering
fabrication, computer-aided-design, banking and service sectors etc. Taguchi method is useful for tuning a given process for best results.
2.6.1 Principle of Taguchi Method
Taguchi proposed a standard 8-steps procedure for applying his method for optimizing any process, as shown below [38]:
Step-1: Identify the main function, side effects, and failure mode.
Step-2: Identify the noise factors, testing conditions, and quality characteristics. Step-3: Identify the objective function to be optimized.
Step-4: Identify the control factors and their levels. Step-5: Select the orthogonal array matrix experiments. Step-6: Conduct the matrix experiments.
Step-7: Analyze the data, predict the optimum levels and performance. Step-8: Perform the verification experiments and plan the future action.
2.6.2 Application of Taguchi Method
Taguchi robust design method with L9 orthogonal array was implemented to optimize experimental conditions for the preparation of nanosized silver particles
using chemical reduction method [39]. Particle size and the particle size distribution of silver nano-particles are considered as the properties. Molar concentration ratio of
R ([AgNO3]/[reducing agent (hydrazine)]) value, concentration of dispersant (sodium
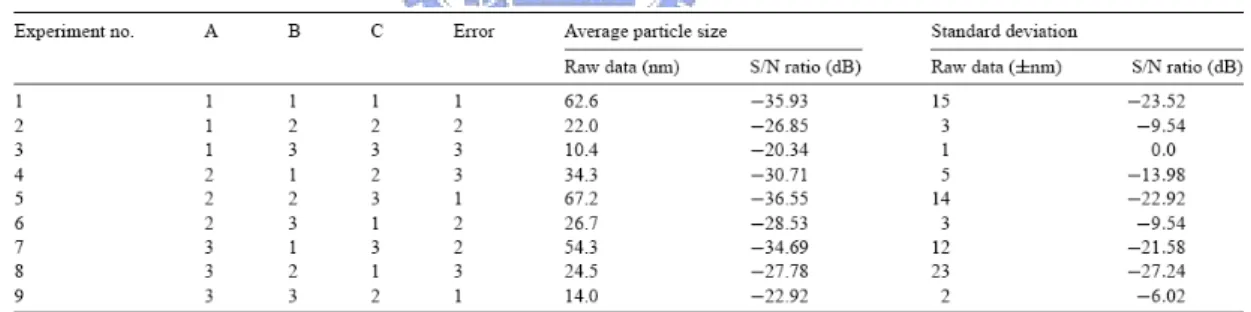
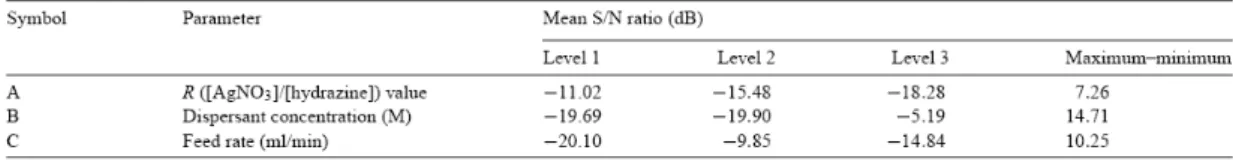
dodecyle sulfate, SDS), and feed rate of reactant were chosen as main parameters. Table 2.1 shows the S/N ratio for particle size and the standard deviation. The concentration of dispersant is the most influencing parameter on the particle size and the size distribution. Moreover, the feed rate of reactant has principal effect on particle size distribution, as illustrated in Table 2.2 and 2.3. The optimal conditions were determined by using Taguchi robust design method, and nano-sized silver particles (~8 nm) were synthesized by applying the optimal conditions, as shown in Table 2.4.
Table 2.1 Experimental measured values for particle size and standard deviation (S.D.) of silver particles and S/N ratio (Taguchi orthogonal array table of L9(34))
Table 2.2 S/N response table for particle size
Table 2.4 Results of the confirmation experiment for particle size and standard deviation
2.7 Summary
Due to the promising physical, electronic and thermal properties, buckypaper is currently being studied and developed into applications by several research groups. According to the literature review, buckypaper is a thin sheet made from aggregation of carbon nanotubes. Therefore, properties of buckypaper are depending on qualities of carbon nanotube and fabrication parameters of buckypaper.
Fabrication parameters optimization of buckypaper such as vacuum pressure, concentration, sonication power, sonication time and surfactant type had been studied by Cherng in HPMI group [40]. However, the research of the relationship between qualities of carbon nanotube and properties of buckypaper is still unavailable. In this project, investigation of this relationship will be brought out, characterized and analyzed by Taguchi method. Furthermore, buckypaper performance and properties can be accurately predicted
CHAPTER 3 EXPERIMENTS
The standard manufacturing process of NBPs can be defined as two procedures: (1) Suspension preparation process: Ultra-sonicated carbon nanotube solution, and (2) NBP filtration process: Filtrated carbon nanotube layers on membrane.
In the first fabrication process, carbon nanotubes are dispersed into distilled water and become a black solution, called suspension by going through the steps in the next section. Furthermore, carbon nanotubes are deposited on the membrane and construct the networking structure as an NBP by filtrating the suspension with vacuum pressure.
3.1. Suspension preparation process
Figure 3.1 shows the standard suspension preparation process; the procedures are listed and detailed below.
1. 80 mg of SWNT particles are ground into a powder with a drop of surfactant (Triton-X) by 3-inch mortars for 10 minutes, and 80 ml of water is added for sonication for 3 minutes with the power set at 30-50 watts.
2. 800 mg of surfactant (Triton-X) is added to 100 ml distilled water in a 200 ml beaker. It is then sonicated for 3 minutes with the power set at 30-50 watts.
3. Pour all of the solution in the mortar into the beaker in procedure 2 and add distilled water to the 200 ml. Sonicate the solution for 10 minutes with the power set at 30-50 watts.
4. Pour all of the solution in procedure 3 into a 500 ml beaker and add the distilled water to the 500 ml. Sonicate the solution for 15 minutes with the power set at 30-50 watts.
water to the 1000 ml. Sonicate the solution for 15 minutes with the power set at 30-50 watts.
6. Pour the 500 ml solution in procedure 5 into another 1000 ml beaker. Both beakers are added distilled water to 1000 ml. Sonicated both solutions for 15 minutes with the power set at 30-50 watts.
7. 2 liters of suspension is produced.
Figure 3.1. Flow chart of suspension preparation process
3.2. NBP filtration process
Figure 3.2 shows the standard NBP filtration process. The procedures are listed and detailed below.
1. Prepare a 90 mm membrane, plastic ring, 1000 ml hollow beaker and filter. 2. Put the membrane on the filter.
3. Put the plastic ring on the membrane in procedure 2. 4. Put the beaker on the plastic ring in procedure 3. 5. Fix the filter and beaker together with a clip.
7. A 90 mm NBP is produced.
Figure 3.2. Flow chart of NBP filtration process
3.3. Orthogonal array and experimental parameters
Taguchi’s orthogonal array table was used by choosing the input parameters that could affect the output properties. In this experiment, the input parameters include the rope diameter, purity and electrical conductivity of CNTs; the output properties include the filtration time, electrical conductivity, surface area, rope diameter and pore size of the NBPs.
For CNT companies, it is hard to produce two same qualities CNTs even the processing parameters are corresponding. That is, the input parameters of making NBPs are uncontrollable, therefore, it is difficult to decide the level value used in this experiment. Hence, carrying out several experiments to define the level value is necessary. Table 3.1 shows the rope diameter, purity and electrical conductivity of six different batches of CNTs. In this research, the orthogonal array of the L4 type was
used and is represented in Table 3.2. L with the subscript 4 is a Latin square and the number of the experiment, respectively. Each experiment was carried out three times. Three, 2-level parameters can be positioned in an L4 orthogonal array table. The numbers 1 and 2 in Table 3.2indicate the low and high levels of a factor, respectively.
Table 3.1
Rope diameter, purity and electrical conductivity of six different batches of CNTs Batches Rope diameter (nm) Purity (%) Electrical conductivity (S/cm) SWNT 69 5.95 92.2% 0.2767 SWNT 75 7.3 92.6% 0.2319 SWNT 79 5.74 90.8% 0.2187 SWNT 81 6.51 91.0% 0.2591 SWNT 86 7.14 90.1% 0.2912 SWNT 91 6.02 90.9% 0.2271 Table 3.2
Taguchi orthogonal array table of L4
Experimental trial Parameter A Parameter B Parameter C
1 1 1 1 2 1 2 2 3 2 1 2 4 2 2 1
According to Tables 3.1 and 3.2, table 3.3 shows the four batches (SWNT 69, SWNT 75, SWNT 86 and SWNT 91) were chosen to fit Taguchi orthogonal array
table of L4. Table 3.4 shows the parameters and levels used in this experiment. Table 3.3
The four batches fitted Taguchi orthogonal array
Batches Rope diameter (nm) Purity (%) Electrical conductivity (S/cm) SWNT 91 6.02 90.9% 0.2271
SWNT 69 5.95 92.2% 0.2767 SWNT 86 7.14 90.1% 0.2912 SWNT 75 7.3 92.6% 0.2319 Table 3.4
Parameters and levels used in this experiment
Levels Low (1) High (2)
A Rope diameter (nm) Beyond 6.5 Above 6.5 B Purity (%) Beyond 91.5% Above 91.5% C Electrical conductivity (S/cm) Beyond 0.25 Above 0.25
CHAPTER 4 RESULTS AND DISCUSSION
4.1. CNTs’ electrical conductivity measurement methodology
The measurements methodology of the rope diameter and purity of CNTs; filtration time, electrical conductivity, surface area, rope diameter and pore size of NBPs were widely used, except for the electrical conductivity of CNTs. Table 4.1 shows the measurements methodology. It is difficult to examine the powder of the CNT raw material. In this experimental process, a designed mold has been fabricated to press the CNT powder into a thick CNT film. Figure 4.1 shows the schematic diagram of the copper mold. CNT powder was placed in the square hole of G10 layer. A thick, compact CNT film was created by pressing the upper and lower copper planks using hot press equipment. The upper and lower copper planks were connected to a power supply. Figure 4.2 shows an image of the copper module with the connected power supply. The module of electrical resistance was conducted through the voltage difference by applying Ohm’s law (V = IR).
Table 4.1
The measurement methodology
Parameters Measurement methodology Rope diameter of CNTs SEM (Scan Electronic Microscopy) and
SIMAGIS (Smart Imaging Spreadsheet) Purity of CNTs TGA (Thermal Gravimetric Analysis) Filtration time of NBPs Timekeeper
Electrical conductivity of NBPs Four-probe method
Surface area of NBPs Gas absorption analyzer – Tristar 3000 Rope diameter of NBPs SEM and SIMAGIS
Pore size of NBPs Gas absorption analyzer – Tristar 3000
Figure 4.1. Schematic diagram of copper mold
Figure 4.2. Picture of copper module with connected power supply
4.2.Taguchi array design and analysis of variance
In this experiment, a Taguchi orthogonal array design was used to identify the optimal conditions and select the parameters having the most important influence on the filtration time, electrical conductivity, surface area, rope diameter and pore size of the NBPs. Tables 4.2, 4.3, 4.4, 4.5 and 4.6show the results of the measurements. The analysis of variance of the filtration time, electrical conductivity, surface area, rope diameter and pore size in Tables 4.2, 4.3, 4.4, 4.5 and 4.6 were calculated; the results
are shown in Tables 4.7, 4.8, 4.9, 4.10 and 4.11, respectively. The purpose of the analysis of variance (ANOVA) is to investigate which parameters significantly affect the quality characteristic. In the tables, S represents the sum of the square of each column, and V represents the mean square of the factor. The significance of the parameters on characteristics can be estimated by the results of the ANOVA process. The significance refer to the extent of a parameter’s effect on the characteristics and can be determined using the F values of the F-distribution. The F values are used to determine whether a parameter can be pooled to an error term or not. In general, the results of the experiments have a small degree of freedom. Therefore, a pooling method was used to increase the freedom of error.
Table 4.2
Experimental measured values for filtration time of NBPs and S/N ratio Exp. No. A B C Filtration time (hrs) y1 y2 y3 S/N ratio(dB) 1 1 1 1 9.5 7.5 10.5 -19.32 2 1 2 2 11 5.25 12 -19.89 3 2 1 2 6.25 7.25 9 -17.60 4 2 2 1 9 5 6.25 -16.84 Table 4.3
Experimental measured values for electrical conductivity of NBPs and S/N ratio Exp. No. A B C Electrical conductivity (S/cm) y1 y2 y3 S/N ratio(dB) 1 1 1 1 46.42 64.13 44.27 33.92 2 1 2 2 55.34 55.64 67.34 35.38
3 2 1 2 52.11 60.23 41.15 33.86 4 2 2 1 40.13 49.41 47.21 33.07
Table 4.4
Experimental measured values for surface area of NBPs and S/N ratio Exp. No. A B C Surface area (m2/g) y1 y2 y3 S/N ratio(dB) 1 1 1 1 571.18 537.17 492.15 54.49 2 1 2 2 592.13 550.31 490.12 54.21 3 2 1 2 514.92 491.45 537.26 54.27 4 2 2 1 532.32 476.32 551.23 54.40 Table 4.5
Experimental measured values for rope diameter of NBPs and S/N ratio Exp. No. A B C Rope diameter (nm) y1 y2 y3 S/N ratio(dB) 1 1 1 1 6.51 4.83 4.98 -14.80 2 1 2 2 4.11 5.1 7.52 -15.20 3 2 1 2 6.41 8.64 6.53 -17.22 4 2 2 1 5.59 7.42 5.92 -16.07 Table 4.6
Experimental measured values for pore size of NBPs and S/N ratio Exp.
No.
A B C Pore size (nm)
1 1 1 1 4.46 4.72 5.98 -14.15
2 1 2 2 4.52 4.74 5.45 -13.83
3 2 1 2 4.98 5.14 4.8 -13.94
4 2 2 1 4.83 6.14 4.78 -14.47
Table 4.7
The ANOVA table of filtration time for the pooling method
Factor Sum of square (S) Degree of freedom Mean square (V) F
A 14.08 1 14.08 3.17*
Error 44.40 10 4.44
Total 58.48 11
* Most significant parameter
In Table 4.7, factors B and C were deleted, implying that the lower F value (FB=0.04, FC=0.17) was combined with the error term. Therefore, factor A had an effect on the filtration time, but B and C had no significance. At 10% significance, the value of F0.1 with 1 and 10 degrees of freedom is 3.28. The calculated F values for A (3.17) are closed to the identification value F implied that factor A had a partial influence on the results of the experiment.
Table 4.8
The ANOVA table of electrical conductivity for the pooling method
Factor Sum of square (S) Degree of freedom Mean square (V) F
A 153.37 1 153.37 2.44*
C 134.94 1 134.94 2.15*
Total 853.73 11 * Most significant parameter
Table 4.8 shows the results of ANOVA for the electrical conductivity of NBPs. In the analysis of variance, the F value of factor B was 0.06, which was significantly lower than FA and FC. This difference of value indicates that parameter B has a smaller effect on the electrical conductivity of NBPs. Therefore, factor B was combined with the error term. Table 4.8 shows that, after recalculating the values in the analysis of error variance, the values of FA and FC were 2.44 and 2.15, respectively. Although all of these F-values are smaller than the F0.1 which is 3.28 with 1 and 10 degrees of freedom, they are large enough to believe that they are relative to the electrical conductivity of NBPs. Therefore, the rope diameter and electrical conductivity of CNTs are the parameters for affecting the electrical conductivity of NBPs.
Table 4.9
The ANOVA table of surface area for the pooling method
Factor Sum of square (S) Degree of freedom Mean square (V) F
A 1398.82 1 1398.82 1.10
Error 12702.12 10 1270.21 Total 14100.94 11
* Most significant parameter
Table 4.9shows the results of the ANOVA for the surface area. In the analysis of variance, the FB and FC are 0.15 and 0.02, respectively, combined with the error term. Table 4.9 shows that, after recalculating the values in the analysis of error variance,
the values of FA are 1.1. The F-value of factor A was smaller than the F0.1 which is 3.28 with 1 and 10 degrees of freedom. Therefore, all of the factors A, B and C were not significant parameters for the surface area of NBPs.
Table 4.10
The ANOVA table of rope diameter for the pooling method
Factor Sum of square (S) Degree of freedom Mean square (V) F
A 4.64 1 4.64 3.29*
Error 14.13 10 1.41
Total 18.77 11
* Most significant parameter
Table 4.10 shows the results of the ANOVA for the rope diameter of NBPs. In the analysis of variance, the F value of factors B and C were 0.3 and 0.55, respectively, significantly lower than FA. Therefore, factors B and C were combined with the error term. After recalculating the values in the analysis of error variance, the value of FA was 3.29, which is larger than the F0.1 which is 3.28 with 1 and 10 degrees of freedom. Consequently, the rope diameter of the CNTs proved to be the most significant parameter for influencing the rope diameter of NBPs.
Table 4.11
The ANOVA table of pore size for the pooling method
Factor Sum of square (S) Degree of freedom Mean square (V) F
A 0.05 1 0.05 0.14
C 0.14 1 0.14 0.36
Error 3.04 8 0.38
Total 3.24 11
Table 4.11shows the results of the ANOVA for the pore size of NBPs. In the analysis of variance, the F value of factors A, B and C were 0.14, 0.03 and 0.36, respectively. All of these factors much smaller than the F0.1 which is 3.28 with 1 and 10 degrees of freedom. Therefore, all of the factors A, B and C were not the influencing parameters for the pore size of NBPs.
4.3. Determination of optimal conditions using Taguchi method
In Taguchi method, the terms ‘signal’ and ‘noise’ represent the desirable and undesirable values for the output characteristics, respectively. Taguchi method uses the S/N ratio to measure the quality characteristic deviating from the desired value. The S/N ratio is defined as [9]
(1) where MSD is the mean squared deviation from the target value of the output characteristic. Consistent with its application in engineering and science, the value of S/N is intended to be large; hence the value of MSD should be small. Thus MSD is defined differently for each of the three quality characteristics considered, i.e. the-smaller-the-better, the-larger-the-better, and the-nominal-the-better [8–10]. For the-smaller-the-better characteristic,
(2) For the-larger-the-better characteristic,
(3) where yi are the results of experiments; n is the number of repetitions. To achieve optimal conditions, the-smaller-the-better quality characteristic for the filtration time, rope diameter and pore size must be taken; conversely, the electrical conductivity and surface area belong to the-larger-the-better characteristic. Tables 4.2, 4.3, 4.4, 4.5 and 4.6 show the S/N ratio for the filtration time, electrical conductivity, surface area, rope diameter and pore size using Eqs. (1), (2) and (3). Since the experimental design is orthogonal, it is possible to separate the effects of each parameter at different levels. For example, the mean S/N ratio for the purity at levels 1 and 2 can be calculated by averaging the S/N ratios for the experiments (1, 3) and (2, 4), respectively. The mean S/N ratio for each level of the other parameters can be computed in a similar manner.
As mentioned in Section 4.2, rope diameter, purity and electrical conductivity of the CNTs were not significant to the surface area and pore size of NBPs. Therefore, the determination of optimal conditions of filtration time, electrical conductivity and rope diameter was followed. The mean S/N ratio for each level of the parameters was summarized. Table 4.12 shows the S/N response table for the filtration time of the NBPs. As shown in Table 4.12, the Max–Min value of the rope diameter was the highest value. Therefore, it can be determined that the rope diameter was the significant parameter for affecting the filtration time of the NBPs; the optimum condition was A2. Since factors B and C were not significant parameters, the determination of their levels was unnecessary.
Table 4.12
S/N response table for filtration time of NBPs
Symbol Parameter Mean S/N ratio (dB)
A Rope diameter -19.61 -17.22 2.39
B Purity -18.46 -18.37 0.09
C Electrical conductivity
-18.08 -18.75 0.67
Table 4.13 shows the S/N response for the electrical conductivity of the NBPs. The optimal conditions for the electrical conductivity of NBPs were A1 and C2. It was also found that the values (Max–Min) of the rope diameter and electrical conductivity of the CNTs were higher than the purity of the CNTs, implying that these two parameters had the most significant influence on the electrical conductivity of NBPs. Since factor B was insignificant, it is unnecessary to control the specification of the purity of the CNTs.
Table 4.13
S/N response table for electrical conductivity of NBPs Symbol Parameter Mean S/N ratio (dB)
Level 1 Level 2 Max-Min
A Rope diameter 34.65 33.46 1.18
B Purity 33.89 34.22 0.33
C Electrical conductivity
33.49 34.61 1.12
Table 4.14 shows the S/N response for the rope diameter of NBPs; the optimal condition was A1. The value (Max–Min) of the rope diameter of the CNTs was higher than the purity and electrical conductivity of the CNTs, indicating that the rope diameter of the CNTs was the most significant influencing parameter. Because factors
B and C were not an influence on the rope diameter of NBPs, controlling the specifications of the purity and electrical conductivity of CNTs was unnecessary. Table 4.14
S/N response table for rope diameter of NBPs
Symbol Parameter Mean S/N ratio (dB)
Level 1 Level 2 Max-Min
A Rope diameter -15 -16.65 1.65
B Purity -16.01 -15.64 0.37
C Electrical conductivity
-15.43 -16.21 0.78
Table 4.15 shows the rope diameter, purity and electrical conductivity of three CNT batches (SWNT 70, SWNT 75 and SWNT 101) which are verifies the results of electrical conductivity, filtration time and rope diameter of NBPs, respectively. Table 4.16 shows the comparison of the predicted electrical conductivity, filtration time and rope diameter of the NBPs, with the experimental results using the optimal conditions. There is good agreement between the predicted and experimental particle size that was observed. Consequently, the filtration time, electrical conductivity and rope diameter of NBPs can be improved by controlling the specification on CNTs through Taguchi method approach.
Table 4.15
Level values of three batches
Batches Rope diameter (nm) Purity (%) Electrical conductivity (S/cm) SWNT 70 5.72 (1) 92.1% (2) 0.2672 (2)
SWNT 101 6.23 (1) 90.6% (1) 0.2953 (2) 1: low level, 2: high level
Table 4.16
Results of the confirmation experiment for electrical conductivity, filtration time and rope diameter of NBPs
Batch: SWNT 70 Electrical conductivity (S/cm)
Level Electrical conductivity (S/cm)
S/N ratio (dB)
Prediction A1C2 57.59 35.207 Experiment A1C2 57.98 35.27 Batch: SWNT 75 Filtration time (hrs)
Level Filtration time (hrs) S/N ratio (dB)
Prediction A2 7.26 -17.22
Experiment A2 8 -18.06
Batch: SWNT 101 Rope diameter (nm)
Level Rope diameter (nm) S/N ratio (dB)
Prediction A1 5.62 -15
CHAPTER 5 CONCLUSION AND FUTURE WORKS
NBPs were fabricated from CNTs through a series of sonication and filtration processes. In this study, Taguchi method was used to optimize the parameter values for obtaining the desired characteristics. Various factors affecting the filtration time, electrical conductivity and rope diameter were analyzed and optimized. The rope diameter of the CNTs was the parameter that had major effects on the filtration time, electrical conductivity and rope diameter of the NBPs. In addition, it has been determined that the electrical conductivity of CNTs is the most significant factor affecting the electrical conductivity of NBPs. Under optimal conditions using Taguchi method, these results are in good agreement with the data that was verified and analyzed by Taguchi method. Consequently, the desired NBPs can be fabricated using Taguchi method and ANOVA to realize what the significant parameters of CNTs are and to obtain the correct specification of CNTs from a CNT company.
In this thesis, although there are several parameters had been investigated, some factors which were not chosen in this experiment might be significant, such as rope length. Moreover, different CNT company’s products might result in different quality NBPs even though manufactured by the same specification of CNTs. In conclusion, in order to further realize CNTs and NBPs, there are lots of experiments and efforts need to implement.
Reference
[1] Reich S, Thomsen C and Maultzsch J 2004 Carbon SWNTs (New York: Wiley-VCH)
[2] Wong E W, Sheehan P E and Lieber C M 1997 Nanobeam mechanics: elasticity, strength, and toughness of nanorods and SWNTs Science 277 1971-5
[3] A. Thess, R. Lee, P. Nikolaev, H. Dai, P. Petit, J. Robert, C. Xu, Y.H. Lee, S.G. Kim, D.T. Colbert, G. Scuseria, D. Tománek, J.E. Fischer and R.E. Smalley 1996 Crystalline ropes of metallic carbon nanotubes Science 273 483-487
[4] T.V. Sreekumar, T. Liu, S. Kumar, L.M. Ericson, R.H. Hauge, and R.E. Smalley 2003 Single-wall nanotube film Chemical Material 15 175-178
[5] Z. Wang, Z. Liang, B. Wang, C. Zhang and L. Kramer 2004 Processing and property investigation of single-walled carbon nanotube (SWNT) buckypaper/epoxy resin matrix nanocomposites Composites Part A: Applied Science and Manufacturing 35 10 1225-1232
[6] A.G. Rinzler, J. Liu, H. Dai, P. Nikolaev, C.B. Huffman, F.J. Rodriguez-Macias, P.J. Boul, A.H. Lu, D. Heymann, D.T. Colbert, R.S. Lee, J.E. Fischer, A.M. Rao, P.C. Eklund and R.E. Smalley 1998 Large-scale purification of single-wall carbon nanotubes: process, product, and characterization Apply Physics A 67 29-37 [7] G. Gruner 2007 Carbon Nanonets Spark New Electronics Scientific American
Reports
[8] R. Roy 1990 A Primer on the Taguchi Method Van Nostrand Reinhold, New York [9] G. Taguchi 1990 Introduction to Quality Engineering Asian Productivity
Organization, Tokyo
[10] P.J. Ross, G. Taguchi 1988 Techniques for Quality Engineering McGraw-Hill, New York
[11] Collins PG, Avouris P, “Nanotubes for electronics.” Scientific American 2000;283(6):62–9.
[12] Rueckes T, Kim K, Joselevich E, Tseng GY, Cheung C-L, Lieber CM, “Carbon nanotube-based nonvolatile random access memory for molecular computing.” Science 2000;289:94–7.
[13] Yao Z, Postma HWC, Balents L, Dekker C, “Carbon nanotube intramolecular junctions.” Nature 1999;402:273–6.
[14] Kroto HW, Heath JR, O’Brien SC, Curl RF, Smalley RE. C60: Buckminsterfullerene. Nature 1985;318:162–3.
[15] Iijima S., “Helical microtubles of graphitic carbon.” Nature. 1991; 354 : 56 (1991).
[16] E. Mendoza, S.J. Henley, C.H.P. Poa, V. Stolojan, G.Y. Chen, C.E. Giusca, J.D. Carey, S.R.P. Silva, “Dendrimer assisted catalytic growth of mats of multiwall carbon nanofibers”, Carbon, 43, 2215-2234, 2005.
[17] R. Saito, G. Dresselhaus, and M. S. Dresselhaus, “Physical properties of carbon nanotubes.” Imperial College Press, London, 1998.
[18] P. M. Ajayany and T. W. Ebbesenz, “Nanometre-size tubes of carbon,” Report on Progress in Physics., 60, 1025 (1997).
[19] S. Iijima, "Helical microtubules of graphitic carbon", Nature 354, 56 (1991). [20] J. C. Charlier and J. P. Michenaud, “Energetics of multilayered carbon
tubules”, Physics Review Letter, 70, 1858 (1993).
[21] A. B. Harris, Randall D. Kamien, and T. C. Lubensky, “Molecular chirality and chiral parameters”, Review of Modern Physics, 71, 5, 1745, (1999).
[22] A. G. Rinzler, J. Liu, H. Dai, P. Nikolaev, C. B. Huffman, F. J. Rodriguez-Macias, P. J. Boul, A. H. Lu, D. Heymann, D. T. Colbert, R. S. Lee, J. E. Fischer, A. M. Rao, P. C. Eklund, R.E. Smalley, ”Large-scale purification
of single-wall carbon nanotubes: process, product, and characterization”. Appl. Phys. A 67, 29-37 (1998).
[23] T. V. Sreekumar, T. Liu, S. Kumar, L. M. Ericson, R. H. Hauge, and R. E. Smalley, “Single-Wall Nanotube Film.” Chem. Mater. 2003, 15, 175-178. [24] J-P. S, G. Andrew, D. Briggs, J-M Bonard, R.R. Bacsa, A.J. Kulik, T. Stöckli, N.
A. Burnham, and L. Forró, “Elastic and shear Moduli of Single-Walled Carbon Nanotube Ropes”, Physical Review Letters, 82, 5, 944-947, 1999.
[25] H.M. Cheng, F. Li, X. Sun, S.D.M. Brown, M.A. Pimenta, A. Marucci, G. Dresselhaus, M.S. Dresselhaus, “Bulk morphology and diameter distribution of singlewalled carbon nanotubes synthesized by catalytic decomposition of hydrocarbons”, Chemical Physics Letters, 289, 602-610, 1998.
[26] A.G. Rinzler, J. Liu, H.Dai, P. Nikolaev, C.B. Huffman, F.J. Rodr´ıguez-Mac´ıas, P.J. Boul, A.H. Lu, D.Heymann, D.T. Colbert, R.S. Lee, J.E. Fischer, A.M.Rao, P.C. Eklund, R.E. Smalley, “Large-scale purification of single-wall carbon nanotubes: process, product, and characterization”, Applied Physics A, 67, 29-37, 1998.
[27] E.P.Barrett, L.G. Joyner, and P.P. Halenda, “The determination of pore volume and area distribution in porous substances. I. Computions from nitrogen isotherm”, 73, 1951.
[28] IUPAC Recommendations, Pure Applied Chemistry, 57, 603, 1985.
[29] S. Brunauer, P. H. Emmett and E. Teller, “Adsorption of gases in multi-molecular layers”, J. Am. Chem. Soc., 1938, 60, 309.
[30] Irving Langmuir, “The constitution and fundamental properties of solids and liquids,” Journal of the American Chemical Society, 38, 2221, 1916.
[31] Y. Ye, C.C. Ahn, C. Witham, B. Fultz, J. Liu, A.G. Rinzler, D. Colbert, K.A. Smith, and R.E. Smalley, “Hydrogen adsorption and cohesive energy of
single-walled carbon nanotubes”, Applied Physics Letters, 74, 16, 2307-2309, 1999
[32] M. M. J. Treacy, T. W. Ebbesen, T. M. Gibson “ Exceptionally high Young’s modulus observed for individual nanotubes”, Nature, 381, 678 (1996).
[33] Carbon Nanotubes, S.Reich, C. Thomsen, J. Maultzsch, WILEY-VCH Verlag GmbH& Co. KGaA, 2004, ISBN 3-527-40386-8.
[34] R. Saito, M. Fujita, G. Dresselhaus, M. S Dresselhaus, “Electronic structure of chiral graphene tubules” Applied Physics Letters, 60, 2204 (1992).
[35] R. Krupke, F. Hennrich, H. v. Lohneysen, and M. M. Kappes, “Separation of metallic from semiconducting single-walled carbon nanotubes”, Science 301, 344 (2003).
[36] R. Saito, M. Fujita, G. Dresselhaus, and M.S. Dresselhaus, Appl. Phys. Lett., 60, 2204, 1992.
[37] S. Kulesza, P. Szroeder, J.K. Patyk, J. Szatkowski, M. Kozanecki, “Hightemperature electrical transport properties of buckypapers composed of doped singlewalled carbon nanotubes”, Carbon, 44, 2178-2183, 2006.
[38] Retrieved from http://www.ee.iitb.ac.in/~apte/CV_PRA_TAGUCHI_INTRO.htm, Feb 18, 2008.
[39] Ki Do Kim, Dae Nam Han, Hee Taik Kim “Optimization of experimental conditions based on the Taguchi robust design for the formation of nano-sized silver particles by chemical reduction method.” Chemical Engineering Journal 104, 55-61, 2004.
[40] Cherng-Shii Yeh “Characterization of nanotube buckypaper manufacturing process” College of Engineering, Florida State University, 2004.