321
Seismic Quiescence before the 1999 Chi-Chi, Taiwan, M
w7.6 Earthquake
by Yih-Min Wu and Ling-Yun Chiao
Abstract
The Chi-Chi, Taiwan, earthquake of 20 September 1999 was preceded
by a notable decrease of the regional seismicity rate. The anomalous period started
in January 1999 and lasted about 9 months, up to the occurrence of the mainshock,
as revealed from analyzing the Taiwan catalog data from 1 January 1994 to 20
September 1999. Our results indicate that the mean seismicity rate is 435 events per
month with a standard deviation of 78 events for earthquakes with magnitude above
2.0. During the anomalous period, seismicity rates fell outside the range of one
standard deviation with a mean value of 314 events per month. There was also a
consistent trend of decreasing regional b-value as well as notable increases of seismic
activity in areas surrounding the Chi-Chi earthquake source region via the Z-test map
(
ZMAP) analysis.
Introduction
Seismic precursors are an important but controversial topic. Among most of the reported precursors, seismic qui-escence, which is defined as a significant decrease of the mean seismicity compared to the preceding background rate, is one that has received considerable attentions (Mogi, 1979; Wyss and Habermann, 1988; Wiemer and Wyss, 1994; Huang et al., 2001; Huang and Nagao, 2002; Huang, 2004). We wish to examine whether there had been significant seis-mic quiescence as an observable precursor prior to the cat-astrophic Chi-Chi earthquake.
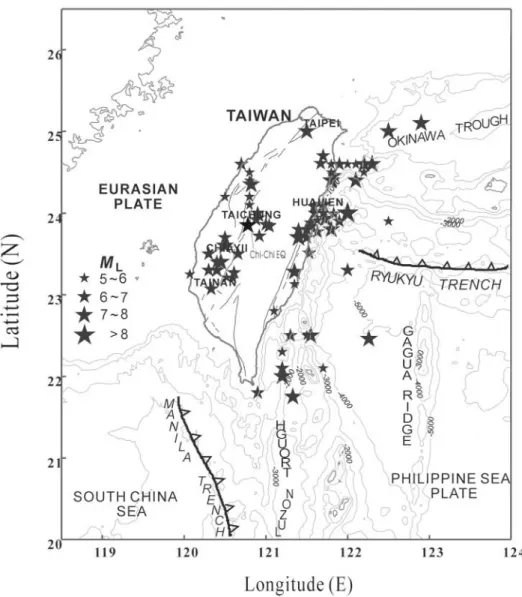
Taiwan is located on the western Circum-Pacific seis-mic belt. In the vicinity of Taiwan, the Philippine Sea plate subducts northward under the Eurasia plate along the Ryu-kyu trench to the northeast of Taiwan, whereas the Eurasia plate subducts eastward under the Philippine Sea plate off the southern tip of Taiwan. Tectonically, most of the Taiwan region is under northwest–southeast compression with a measured convergence rate of about 8 cm/year. Many disas-trous earthquakes have occurred in the past, and those that have occurred from 1900 to 1999 are usually well docu-mented (Fig. 1). These docudocu-mented earthquakes may be grouped into two general categories: the earthquakes asso-ciated with the subduction of the Philippine Sea plate north-ward under the Eurasia plate (e.g., near and offshore of Hua-lien), and the ones associated with active faults in western Taiwan.
The 1999 Mw 7.6 Chi-Chi earthquake (Fig. 2) is the
largest event on the Taiwan island in the last century (Shin
et al., 2000; Wu et al., 2000). It caused 2456 casualties,
11,306 injuries, and about $4 billion in property damage. There was not any early warning reported before the occur-rence of the Chi-Chi earthquake. However, a detailed post-examination of the seismicity reveals an interesting anomaly that occurred about 9 months prior to the mainshock, that is,
the seismic activity had been significantly subdued for the Taiwan region. The regional b-value of the Gutenberg– Richter law of the same period is also consistently lower. We report, in this study, the monthly changes of seismicity,
b-values, and Z-test map (ZMAP) analysis (Wiemer and Wyss, 1994) before the Chi-Chi earthquake to highlight the anomalies that might shed light on the study of precursors of large events.
Data
We analyze the catalog data from the Central Weather Bureau Seismic Network (CWBSN) in this study. The
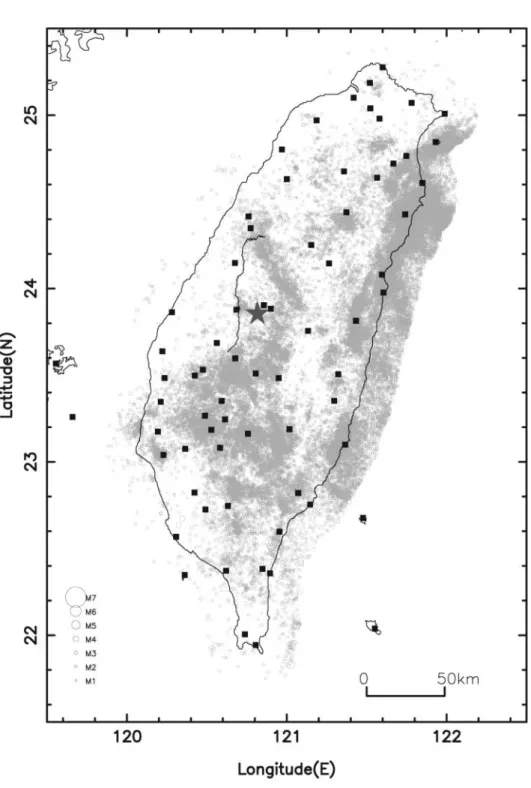
CWBSNconsists of a central recording system with 73 tele-metered stations (Fig. 2, solid squares) that are equipped with three-component S13 seismometers. Seismic signals digitized at 12 bits and 100 samples per second from each station are transmitted via dedicated telephone lines to the center station located in Taipei. Seismic signals are exam-ined to manually pick the P and S arrivals for earthquake location and to determine the magnitude ML(Shin, 1993).
TheCWBSNsystem was operated in triggered-recording mode before the end of 1993. Since then, operation has changed to continuous-recording mode and manual identi-fications of earthquake events. This has greatly enhanced the sensitivity of earthquake detection. We screened the catalog data during the period from 1994 to the occurrence of the Chi-Chi earthquake, and picked those epicenters located on land or within 20 km of the coastlines of Taiwan and with a focal depth less than 40 km. As a result, there were 66,069 events selected in this study (Fig. 2). For these events, dis-tributed within the region well and uniformly covered by the
mag-322 Short Notes
Figure
1.
Epicenter distribution of disastrous earthquakes during 1900–1999 in the Taiwan area. These earthquakes may be divided into two general classes: the earth-quakes associated with the subduction of the Philippine Sea plate northward under the Eurasia plate, and the ones associated with active faults in western Taiwan.nitude completeness (MC) is about 2.0. Furthermore, the
study region is believed to be located well within the critical region of the Chi-Chi earthquake based on Bowman et al.’s (1998) discussion that the critical radius of the affected seis-micity prior to an M 7.5 earthquake is more than 300 km.
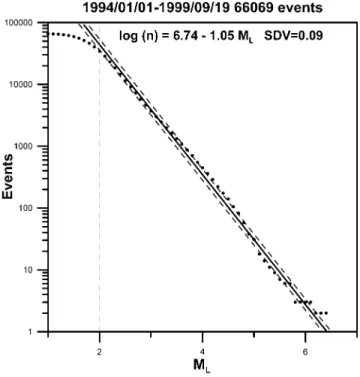
We first derive the regional Gutenberg–Richter distri-bution and generate the frequency-magnitude plot (Fig. 3) of these selected events. Least-square regression results in the following distribution:
Log N ⳱ 6.74 ⳮ 1.05 M ,L (1) where N is the number of events with a magnitude equal or larger than ML, and the b-value is thus 1.05 for this data set.
The minimum magnitude of completeness, MC, is about 2.0.
Temporal Variations of the Earthquake Number
and the b-value
Aftershock activity generally masks temporal variations of the earthquake numbers and the related statistics. We chose to eliminate the aftershock sequences from our data set following other previous studies (e.g., Huang, 2004). We applied the time and spatial double-link cluster-analysis method to eliminate the aftershocks. This method is similar to the single-link cluster-analysis method proposed by Davis and Frohlich (1991). We removed aftershock sequences for those mainshocks with M ⬎4.5 using 3 days and 5 km as the linking parameters.
The aftershock-elimination procedure took away 8590 events, 14% of the total, from the data set. The monthly occurrence rates from 1994 to the occurrence of the Chi-Chi
Figure
2.
Epicenters of the selected 66,069 events used in this study (open circles). The locations of the seismic stations of the Central Weather Bureau Seismic Network (CWBSN) are marked by solid squares. The epicenter of the Chi-Chi earthquake is depicted by the star, and the solid line marks the surface rupture.earthquake are calculated by counting events with ML⬎2.0
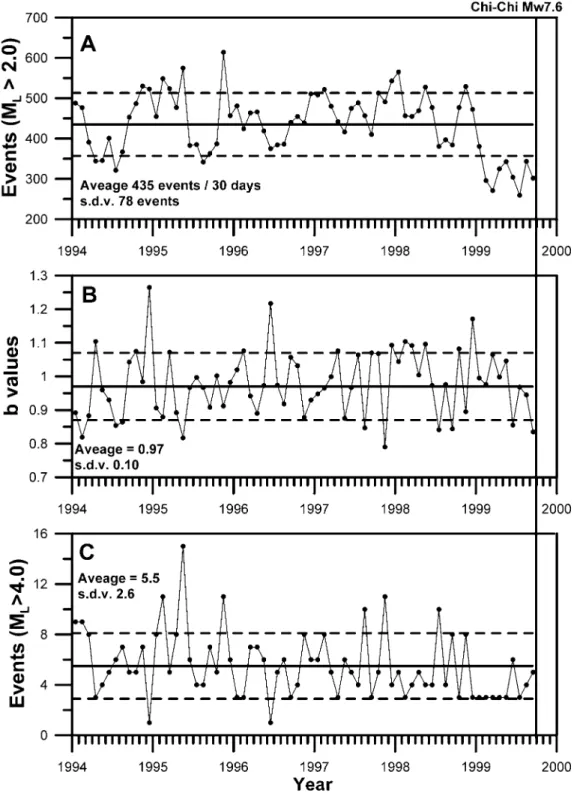
for every month and then normalizing the counts to the du-ration of 30 days. The average occurrence rate is 435 events per 30 days with a standard deviation of 78 events. It is clear that starting in January 1999, 9 months prior to the Chi-Chi
earthquake, a significant low-seismicity period emerged, with monthly event-occurrence rates falling outside the one-standard-deviation range (Fig. 4a).
The regional temporal variation of the b-value is also examined monthly (Fig. 4b) within the same period. The
324 Short Notes
Figure
3.
The log–log plot of the frequency-magnitude distribution of the selected events (dots). The solid line results from the least-squares regres-sion, and the two dashed lines mark the range of one standard deviation. Magnitude completeness is 2.0 for theCWBSN.average amounts to the value of 0.97 with a standard devi-ation of 0.10. Although there are no significant low or high anomalies, it exhibits a consistent decreasing trend during the low-seismicity period before the occurrence of the Chi-Chi earthquake.
To clarify the attribution of the observed seismicity re-duction, we further examined the monthly occurrence rate for larger events with ML ⬎4.0 only, and did not find
sig-nificant reduction in the period from 1 January 1999 to 19 September 1999 (Fig. 4c). In other words, the observed seismicity reduction and the decreasing pattern of the b-value can be attributed essentially to the quiescence of smaller events with ML⬍4.0.
Results from the
ZMAPAnalysis
To establish the spatial distribution of the seismic qui-escence mentioned earlier, we have applied the ZMAP
method (Wiemer and Wyss, 1994) to the data extracted from different segments within the quiescence period. We first calculated the regional Z-values for the period from 1 Jan-uary 1999 to 19 September 1999, a latter period of the seis-mic quiescence (from 1 January 1994 to 19 September 1999), for events with ML⬎2.0, focal depth less than 40 km,
and the region bounded by 21.5⬚ N to 25.5⬚ N and 119.5⬚ E to 122.5⬚ E. The spatial grid spacing is set to 0.05⬚, yielding a resolution radius of about 20 km. The bin length is set to
60 days. For each spatial pixel, the local Z-value is then calculated by the equation
2 2
rall rcal
z(t) ⳱ (R ⳮ R )all cal
冫
冪
Ⳮ , (2)nall ncal
where Ralland Rcalare the mean seismicity rate within that
pixel in the overall period and the considered time window, respectively;rallandrcalare the standard deviations of
seis-micity rate; and nall and ncal are the number of samples in
these periods. A positive Z-value thus indicates a decrease in seismicity, whereas a negative Z-value implies a rise in seismicity.
The calculated Z-value ranges from ⳮ3.37 to 6.75 (Fig. 5a). Most of the Taiwan region is in the high positive
Z-value (blue areas in Fig. 5a). This implies significant
seis-micity reduction, mainly for smaller events as discussed ear-lier, especially for the region of eastern Taiwan, where the
Z-values easily exceed 3.0. Interestingly, it should be
pointed out that there is simultaneously significant seismicity increasing, marked by the negative Z-values, in the areas surrounding the Chi-Chi earthquake rupture regions (star and solid line in Fig. 5a).
We also calculated the regional Z-values for the period from 1 January 1995 to 31 December 1996, a relatively ear-lier segment of the 1 January 1994–19 September 1999 qui-escence period. The calculated Z-value ranges fromⳮ2.42 to 4.92 (Fig. 5b). Most of the eastern Taiwan region is now demarcated by the negative Z-values (red areas in Fig. 5b), and is in general closing to the background seismicity of the Taiwan region as compared to the anomalous period from 1 January 1999 to 19 September 1999.
Summary
Quiescence of seismicity (Ishida and Kanamori, 1977, 1978; Wyss and Martirosyan, 1998; Zhang et al., 1999; Huang et al., 2001; Huang and Nagao, 2002; Huang, 2004) as well as the decreasing b-value (e.g., Zhang et al., 1999) before large earthquakes have been documented previously. We report, in this study, similar observations that last for about 9 months prior to the Chi-Chi earthquake. Most of the previously reported seismic-quiescence periods before the catastrophic events last from 1 to 2.5 years, and the duration of the subsequent seismic activation generally lasted for sev-eral months (Huang, 2004). We did not detect a significant seismic activation period for the Chi-Chi earthquake based on the temporal variation for the Taiwan region. However, there seems to be local seismic activation around the Chi-Chi earthquake rupture region. The raised seismic activity around the Chi-Chi earthquake rupture region as revealed from the ZMAP analysis, along with the general subdued activity in the background, especially to the eastern area where the tectonic compression loading originates, is an in-teresting feature that deserves further attention. Since the
Figure
4.
(A) Monthly event counts for ML⬎2.0; (B) monthly b-value variations;(C) monthly events counts for ML⬎4.0 from 1994 to the occurrence of the Chi-Chi
earthquake. The solid line indicates the least-squares mean, and the two dashed lines show the range of one standard deviation.
seismic quiescence can be attributed mainly to the reduction of smaller events, one bold speculation is that the tectonic stress loading from the east has caused the closure of existing microfractures to the east, which then results in the migration and accumulation of strains to the west and eventually ac-tivates the Chi-Chi earthquake.
Acknowledgments
The authors wish to thank Profs. Hiroo Kanamori, Leon Teng, and Dr. Chien-Hsin Chang for their valuable comments. We also wish to thank Prof. Diane I. Doser for improving this article and one anonymous reviewer for valuable comments. This research was supported by the Central Weather Bureau and National Science Council of the Republic of China.
326 Short Notes
Figure
5.
(a) Distribution of the Z-values from 1 January 1999 to 19 September 1999. Most of the Taiwan region is marked by the high positive Z-values that imply seismicity re-duction. In contrast, areas surrounding the Chi-Chi earthquake source region have negative Z-values that imply increased activity prior to themain event. (continued)
References
Bowman, D. D., G. Ouillon, C. G. Sammis, A. Sornette, and D. Sornette (1998). An observational test of the critical earthquake concept, J.
Geophys. Res. 103, 24,359–24,372.
Chang, C. H. (2004). Application of a dense seismic network data on the study of seismogenic structures of central and eastern Taiwan, Ph.D.
Thesis, Institute of Geophysics, National Central University, 156 pp.
Davis, S. D., and C. Frohlich (1991). Single-link cluster analysis of earth-quake aftershocks: decay laws and regional variations, J. Geophys.
Res. 96, 6336–6350.
Huang, Q. (2004). Seismicity pattern change prior to large earthquakes— an approach of the RTL algorithm, TAO 15, 469–491.
Huang, Q., and T. Nagao (2002). Seismic quiescence before the 2000 M⳱ 7.3 Tottori earthquake, Geophys. Res. Lett. 29, 1578. Huang, Q., G. A. Sobolev, and T. Nagao (2001). Characteristics of the
seismic quiescence and activation patterns before the M⳱ 7.2 Kobe earthquake, January 17, 1995, Tectonophysics 337, 99–116. Ishida, M., and H. Kanamori (1977). The spatio-temporal variation of
seis-micity before the 1971 San Fernando earthquake, California,
Geo-phys. Res. Lett. 4, 345–346.
Ishida, M., and H. Kanamori (1978). The foreshock activity of the 1971 San Fernando earthquake, California, Bull. Seism. Soc. Am. 68, 1265– 1279.
Mogi, K. (1979). Two kinds of seismic gaps, Pure Appl. Geophys. 117, 1172–1186.
Shin, T. C. (1993). The calculation of local magnitude from the simulated Wood-Anderson seismograms of the short-period seismograms, TAO
4, 155–170.
Shin, T. C., K. W. Kuo, W. H. K. Lee, T. L. Teng, and Y. B. Tsai (2000). A preliminary report on the 1999 Chi-Chi (Taiwan) earthquake.
Figure
5.
Continued. (b) Distribution of theZ-values from 1 January 1995 to 31 December
1996 suggests the background seismicity.
Wiemer, S., and M. Wyss (1994). Seismic quiescence before the Landers (M⳱ 7.5) and Big Bear (M ⳱ 6.5) 1992 earthquakes, Bull. Seism.
Soc. Am. 84, 900–916.
Wu, Y. M., W. H. K. Lee, C. C. Chen, T. C. Shin, T. L. Teng, and Y. B. Tsai (2000). Performance of the Taiwan Rapid Earthquake Informa-tion Release System (RTD) during the 1999 Chi-Chi (Taiwan) earth-quake, Seism. Res. Lett. 71, 338–343.
Wyss, M., and R. E. Habermann (1988). Precursory seismic quiescence,
Pure Appl. Geophys. 126, 319–332.
Wyss, M., and A. Martirosyan (1988). Seismic quiescence before the M7, 1988, Spitak earthquake, Armenia, Geophys. J. Int. 134, 329–340. Zhang, G., L. Zhu, X. Song, Z. Li, M. Yang, N. Su, and X. Chen (1999).
Predictions of the 1997 strong earthquakes in Jiashi, Xinjiang, China,
Bull. Seism. Soc. Am. 89, 1171–1283.
Department of Geosciences National Taiwan University No. 1, Sec. 4, Roosevelt Road Taipei 106, Taiwan
[email protected] (Y.-M.W.)
Institute of Oceanography National Taiwan University Taipei, Taiwan
(L.-Y.C.)