The Design and Implementation of a Diagnostic Test
System Based on the Enhanced S-P Model
DENG-JYI CHEN, AH-FUR LAI AND I-CHANG LIU Department of Computer Science and Information Engineering
National Chiao Tung University Hsinchu, 300 Taiwan E-mail: [email protected]
The cognitive diagnostic test can be used to understand the learning effects (such as strengths and weaknesses) of learners for a specific subject area. Based on the evaluation results of the diagnostic test, instructors may suggest or give students additional material on the subject area for students who do not meet the requirements. The S-P (Stu-dent-Problem) model has been used for this purpose for a long time. However, the cur-rent S-P model pays little attention to a student’s response time for each test item or for the entire question set during the test. The student’s response time for each test item can be an important factor for instructors wanting to diagnose each student’s individual abil-ity in problem solving. Also, there are few computerized diagnostic test analysis systems available that are designed to support both text-diagram-based and/or multimedia-based presentation test items.
In this research, we incorporate the response time, difficulty index, and discrimina-tory index of each test item into an S-P model during the analysis. Specifically, we em-ploy two terms: 1) the nimbleness of thinking of a student, which can be measured based on the response time for answering each test item, and 2) the problem solving ability of a student, which can be measured based on the student’s ability to solve adaptive type questions with various difficulty levels and discrimination powers. With the incorpora-tion of these parameters, an enhanced S-P model is presented. It can be used to diagnose both time dependent information and problem solving abilities with respect to test items and test-takers. A web-based computerized system was designed and implemented based on the enhanced S-P model for both text-diagram type presentation test items and mul-timedia type presentation test items. Practical examples were investigated and experi-mental studies conducted using the cognitive diagnostic computerized system to demon-strate the rationality and applicability of the proposed enhanced S-P model.
Keywords: enhanced S-P model, diagnostic test system, nimbleness of thinking, test- item solving ability, response time
1. INTRODUCTION AND LEGEND
1.1 Introduction
In the context of education, one possible purpose of a test is to assess whether an individual learner has attained an educational goal. The outcome of such a test can help instructors analyze problems with his or her instruction and to better understand the learner’s strengths and weaknesses in a given subject. Furthermore, it can be used to fine-tune the instruction environment or method, based on the analytical results, to
im-Received July 4, 2004; revised March 15, 2005; accepted May 10, 2005. Communicated by Robert Lewis.
prove the instructor’s teaching performance. There are currently two methods for con-ducting tests. The traditional method of using paper and pencil tests, including the crea-tion of test items, the grading of students’ test sheets, and the analysis of test-takers’ re-sponses for each test item, is considered to be tedious [1]. The other method, Com-puter-Based Tests (CBT), allows test activities to be carried out in a computer environ-ment. CBTs have several advantages over traditional methods; for example, they provide multimedia test questions and shorten test times. With the widespread use of the personal computers and the Internet, Web-Based Instruction (WBI) has also gained popularity and been adopted in distance learning and teaching. In WBI, assessing and diagnosing a learner’s strengths and weaknesses is an important issue. Currently, the CBT is consid-ered the main approach to evaluating the performance and capabilities of online learners in a WBI environment.
Diagnosis is an important part of the learning process. It helps instructors 1) analyze the abnormal performance of learners, 2) understand the suitableness of given test items for test-takers, 3) evaluate test-takers’ responses to each test item, and 4) pinpoint mis-conceptions of learners with respect to a given test subject. All of these issues must be investigated so that instructors can improve their instruction methods. Most of the current CBT systems support only fundamental diagnosis information, such as difficulty indexes and discrimination indexes, in regard to test items. The S-P chart (Student-Problem chart), which was originally proposed by Sato [6, 7, 10, 12-14], has been used to solve some of the above-mentioned problems. It provides caution indexes for diagnosing the abnormal performance of examinees, and a disparity coefficient for diagnosing test item sheets. However, the current S-P chart neglects time-dependent issues associated with test items and test-takers. In this paper, we propose two indexes, 1) the nimbleness of thinking, which is time dependent, and 2) the problem solving abilities of test-takers, in order to enhance the S-P model. The proposed model was integrated into an existing web-based CBT system. Practical examples were investigated and experimental studies conducted using the proposed cognitive diagnostic computerized tool to demonstrate the rationality and applicability of the proposed enhanced S-P model.
1.2 Legend
To help readers to follow our presentation, the following notations are defined.
S-P score table: the student-problem score table;
D*: the disparity index, which is the ratio of the diverse area of the practical response to the expectation area of the random condition between the S curve and P curve; C: the total numbers of “1’s” and “0’s” in the area surrounded by the S curve and P
curve;
N: the total number of students taking the test; n: the number of test items;
p : the average ratio of correct responses;
DB(M): the constant array that can be accessed by M; M: M = Gussan( Nn+ 0.5);
CSi: the student caution index; CPi: the item caution index;
y: a two-dimensional array that stores test-takers’ response patterns, which are sorted in descending order according to both the percentage of correct responses to test items and the percentage of correct responses of students;
yij: the ith person’s response for item j;
yi.: the number of correct responses of student i on all of the test items; y.j: the number of correct responses for all of test-takers for test item j;
µ: the average score of the students;
µ′: the average number of correct responses for all test items;
Tmax(j): the maximum response time of all test-takers for test-item j; Tmin(j): the minimum response time of all test-takers for test-item j;
Wun(j): the weighted unit value, which is the distance between Tmax(j) and Tmin(j); W(i, j): the weighted nimbleness value of test-taker i for item j;
Tavg(j): the average response time of all test-takers for item j; Tlen(i, j): the response time of test-taker j;
Nim(i): the nimbleness of thinking of test-taker i for all test items (from 1 to N), which can then be defined as the summation of the weighted nimbleness values of all items;
p(j): the difficulty index of test item j;
Wp(j): the weighted value of the difficulty index of test item j; D(j): the discriminative index of test item j;
Wd(j): the weighted value of the discriminative index of test item j; Ws(j): the weighted value of the problem solving ability for test item j; Right(i, j): the vector that records the correct response of item j for test-taker i; Sol(i): the test-item solving ability of test-taker i.
2. RELATED WORKS
The S-P chart was originally proposed by Sato in 1975 [12-14], and it has since been used to diagnose the aberrant performance of students’ and to analyze the suitable-ness of test items by means of an item caution index, a student caution index, and a dis-parity coefficient. The S-P chart does not make any assumptions about the test subject group and is based on a nonparametric statistical approach. It is suitable for application to formative tests used in classrooms. Through the analysis of students’ response patterns, the caution indexes and disparity indexes can be calculated. To help teachers interpret these indexes, diagnostic information can be obtained and used as guidance for providing additional instruction for learners after an examination.
The S-curve shows how students agree with the problems, and the P-curve shows how the problems agree with the students. In an ideal situation, these two curves should coincide, but in a practical situation, these two curves will diverge [9, 11]. The disparity index (D*) is the ratio of the divergence area of the practical response to the expectation area of the random condition between the S curve and P curve. Sato proposed an ap-proximated formulation which is restated below:
* . 4 (1 ) B( ) C D Nn p p D M = −
(1)
Here, C is the dimension between the S curve and P curve, i.e., the total amount of “1’s” and “0’s” in the area surrounded by the S curve and P curve. N is the total number of students, n is the number of test items, p is the average ratio of correct responses, and DB(M) is the constant array, which be accessed by M (where M = Gussan( Nn + 0.5)).
The value range of the caution index is between 0 and 1. The higher the student’s caution index value, the greater is the abnormality of the student’s response. The higher the item caution index, the worse is the suitability of the item. The item caution index and the student caution index are calculated using Eqs. (2) and (3), respectively:
CSi = 1 − . . . 1 . . 1 ( )( ) ( )( ') ( )( ') ij i n j i j i j j y y y y y y µ µ = = − −
∑
∑
= . . . . . 1 1 . . 1 (1 )( ) ( )( ) , ( )( ') i ij ij i i y n j j j j y y j i j y y y y y y µ = = + = − − −∑
∑
∑
(2) CPj = 1 − . . . . . 1 1 ( )( ) ( )( ) ( )( ) ij i j j j i N i y i y y y y y µ µ = = − −∑
∑
= . . . . . . . 1 1 1 (1 )( ) ( )( ) , ( )( ) j ij i ij i j j i j y N i i y y i y y y y y y µ = = + = − − −∑
∑
∑
(3)where y is a two-dimensional array that stores test-takers’ response patterns, which are sorted in descending order according to both the percentage of correct responses to test items and the percentage of correct responses of students (as illustrated in Fig. 1); yij
represents the ith person’s response for item j; yi. represents the number of correct
re-sponses of student i for all test items; y.j represents the number of correct responses of all
test-takers for test item j; µ represents the average score of the students; and µ′ represents the average number of correct responses for all test items.
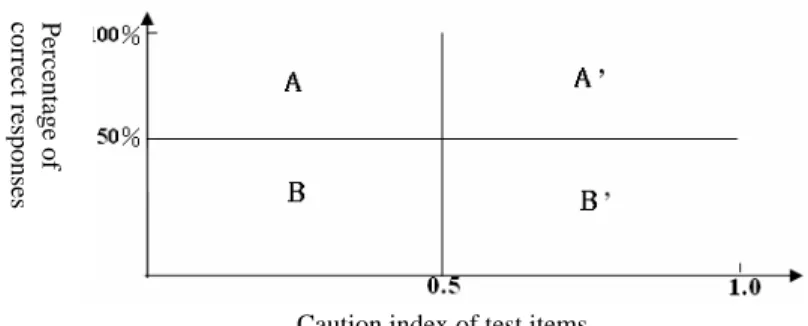
The diagnostic result for each test item is divided into four parts according to the item caution index and the students’ correct response percentage for that test item [10-14]. The four parts (A, A’, B, B’) can be used to explain the possible outcomes of test items from the diagnosis as shown in Fig. 2. Part A shows that the test item is suit-able and can be used to discriminate both the low performance student group and differ-ent types of studdiffer-ent groups. Part B indicates that the item can be used to discriminate the high performance student group and other types of student groups. Part A’ shows that the test item perhaps contains some abnormal components or that the test item includes some inadequate choices. Thus, part of the content of the test item must be modified. Part B’ indicates that the test item is poor or that the semantics of the test item are ambiguous.
The diagnostic results for the student’s learning performance is divided into six parts, based on the student’s caution index and the correct response percentage of the student. These parts are shown in Fig. 3. Part A indicates that the student has good learning performance and high stability in testing. Part B shows the middle stability of the student, indicating that the student should work a bit harder. Part C indicates that the student’s learning capability is poor and that his or her mastery of the content is too low,
or that there is a need for work hard. Part A’ shows that the student has good perform-ance on tests but sometimes gives incorrect responses due to carelessness. Part B’ indi-cates that the student’s mastery of the content is not good, signifying that the student sometimes gives incorrect responses due to carelessness, and that he or she needs to work harder. Part C’ shows that the student has low stability, and that his or her mastery of the content is very poor.
Caution index of test items
Fig. 2. Item categories based on the item caution index and item correct response rate.
Caution index of students
Fig. 3. Student’s learning performance categories based on the student caution index and the stu-dent’s correct response rate.
3. PROBLEM STATEMENTS AND PROPOSED SOLUTIONS
Previously, the S-P score table proposed by Sato did not take time factors into con-sideration. This work incorporates the student’s response time, difficulty index, and dis-criminatory index for each test item. Specifically, we add and employ two terms: 1) the nimbleness of thinking of the student, which can be measured based on the student’s re-sponse time in answering each test question; and 2) the student’s ability to solve each test item, measured based on the student’s ability to answer higher difficulty level questions correctly, and on a discriminatory index. With the incorporation of these parameters, an enhanced S-P model is presented. It can be used to diagnose both time dependent infor-mation and problem solving abilities with respect to test items and test-takers.3.1 The Nimbleness of Thinking
The response time of the test-taker during online testing is an important factor that can be used to understand the speed of thinking of the test-taker for each test item (which is called the nimbleness of thinking, Nim). It is formulated as explained below.
Percentage of
correct responses
Percentage of correct
re
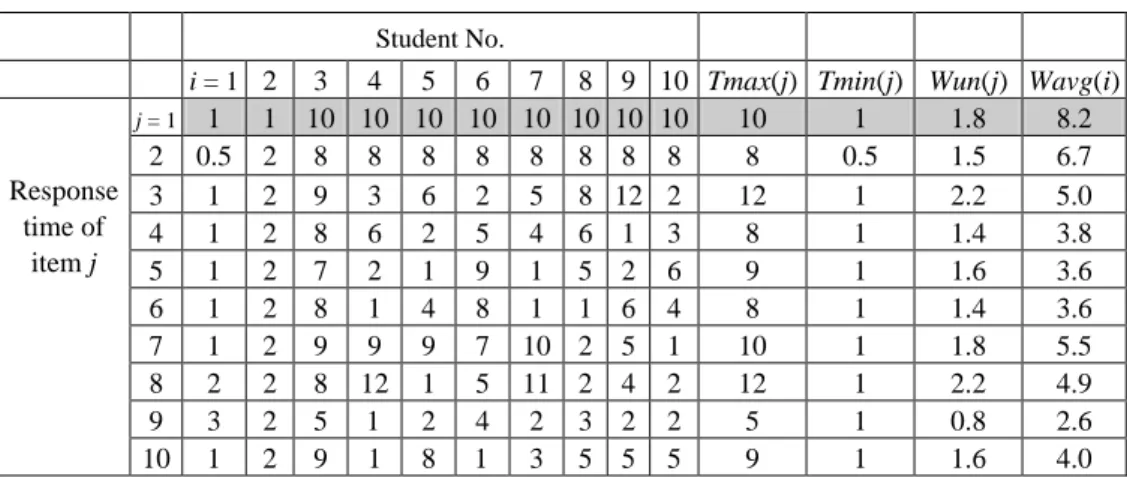
Tmax(j) is defined as the maximum response time of all test-takers for test-item j. Tmin(j) is defined as the minimum response time of all test-takers for test-item j. Wun(j) is defined as the weighted unit value, which is the distance between Tmax(j) and Tmin(j):
Wun(j) = (Tmax(j) (Tmin(j))/5. (4) The weighted nimbleness value of test-taker i for item j, W(i, j), is formulated as in (5), where Tavg(j) is the average response time of all test-takers for item j and Tlen(i, j) is the response time of test-taker j:
W(i, j) = (Tavg(j) − Tlen(i, j))/Wun(j). (5) The nimbleness of thinking of test-taker i for all test items (from 1 to N), Nim(i), can then be defined as the summation of the weighted nimbleness value of each item. Here, the constant values 5 and 0.5 are used to normalize the final value of Nim(i) such that it will fall into the range between 0 to 1:
1 0 ~1 ( , ) ( ) 0.5. * 5 N j W i j Nim i N = =
∑
+(6) Table 1 shows the raw data sets that indicate the response times of 10 test-takers for 10 test items. In this table, the response times for the first test item are shown in the third row. Since Tmax(1) is 10 and Tmin(1) is 1 in this case, the weighted value of the first item is 1.8, and the average response time is 8.2.
Table 1. Example testing data set.
Student No.
i = 1 2 3 4 5 6 7 8 9 10 Tmax(j) Tmin(j) Wun(j) Wavg(i)
j = 1 1 1 10 10 10 10 10 10 10 10 10 1 1.8 8.2 2 0.5 2 8 8 8 8 8 8 8 8 8 0.5 1.5 6.7 3 1 2 9 3 6 2 5 8 12 2 12 1 2.2 5.0 4 1 2 8 6 2 5 4 6 1 3 8 1 1.4 3.8 5 1 2 7 2 1 9 1 5 2 6 9 1 1.6 3.6 6 1 2 8 1 4 8 1 1 6 4 8 1 1.4 3.6 7 1 2 9 9 9 7 10 2 5 1 10 1 1.8 5.5 8 2 2 8 12 1 5 11 2 4 2 12 1 2.2 4.9 9 3 2 5 1 2 4 2 3 2 2 5 1 0.8 2.6 Response time of item j 10 1 2 9 1 8 1 3 5 5 5 9 1 1.6 4.0
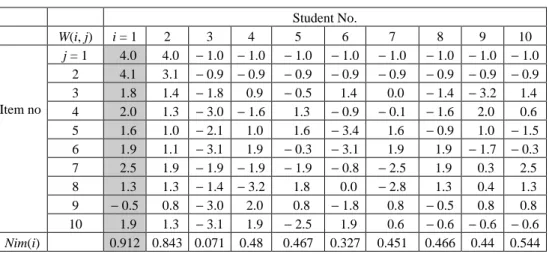
The Nim(i) of test-taker 1 (shaded area) in Table 2 is formulated below. For W(1, 1), the weighted nimbleness value of test-taker 1 for item 1 is computed as follows:
W(1, 1) = (8.2 − 1)/1.8 = 4, (7) where W(1, 2)…W(1, 10) can be computed in the same way. Finally, the nimbleness of thinking of test-taker 1, Nim(1), is formulated as
Nim(1) = (W(1, 1) + W(1, 2) + … + W(1, 10))/(10*5) + 0.5 = 0.912. (8) The nimbleness of thinking of each test-taker can be computed accordingly and is shown in Table 2.
Table 2. Nimbleness of thinking values computed based on Table 1.
Student No. W(i, j) i = 1 2 3 4 5 6 7 8 9 10 j = 1 4.0 4.0 − 1.0 − 1.0 − 1.0 − 1.0 − 1.0 − 1.0 − 1.0 − 1.0 2 4.1 3.1 − 0.9 − 0.9 − 0.9 − 0.9 − 0.9 − 0.9 − 0.9 − 0.9 3 1.8 1.4 − 1.8 0.9 − 0.5 1.4 0.0 − 1.4 − 3.2 1.4 4 2.0 1.3 − 3.0 − 1.6 1.3 − 0.9 − 0.1 − 1.6 2.0 0.6 5 1.6 1.0 − 2.1 1.0 1.6 − 3.4 1.6 − 0.9 1.0 − 1.5 6 1.9 1.1 − 3.1 1.9 − 0.3 − 3.1 1.9 1.9 − 1.7 − 0.3 7 2.5 1.9 − 1.9 − 1.9 − 1.9 − 0.8 − 2.5 1.9 0.3 2.5 8 1.3 1.3 − 1.4 − 3.2 1.8 0.0 − 2.8 1.3 0.4 1.3 9 − 0.5 0.8 − 3.0 2.0 0.8 − 1.8 0.8 − 0.5 0.8 0.8 Item no 10 1.9 1.3 − 3.1 1.9 − 2.5 1.9 0.6 − 0.6 − 0.6 − 0.6 Nim(i) 0.912 0.843 0.071 0.48 0.467 0.327 0.451 0.466 0.44 0.544
3.2 The Test-Item Answering Ability
The difficulty index and discriminative index of a test item are important factors that can be used to evaluate the performance of test-takers. The test-takers who can cor-rectly answer test items with high difficulty indexes and high discriminative indexes are considered to possess better test-item answering ability. In the following, we formulate the test-item answering ability of a test-taker, Sol(i):
Wp(j) = (1 − p(j)) * 5, (9) where p(j) is the difficulty index of test item j and Wp(j) is the weighted value of the dif-ficulty index of test item j. The constant value 5 is used to normalize the final value of Wp(j) such that it will fall into the range between 1 to 5:
Wd(j) = D(j) * 5, (10) where D(j) is the discriminative index of test item j and Wd(j) is the weighted value of the discriminative index of test item j. The weighted value of the problem solving ability for test item j can be formulated as follows:
Ws(j) = Wp(j) + Wd(j). (11) The Right(i, j) vector records the correct response for item j from test-taker i. The test-item answering ability of test-taker i, Sol(i), is formulated as follows:
1 0~1 ( ) * ( , ) ( ) . *5* 2 N j Ws j Right i j Sol i N = =
∑
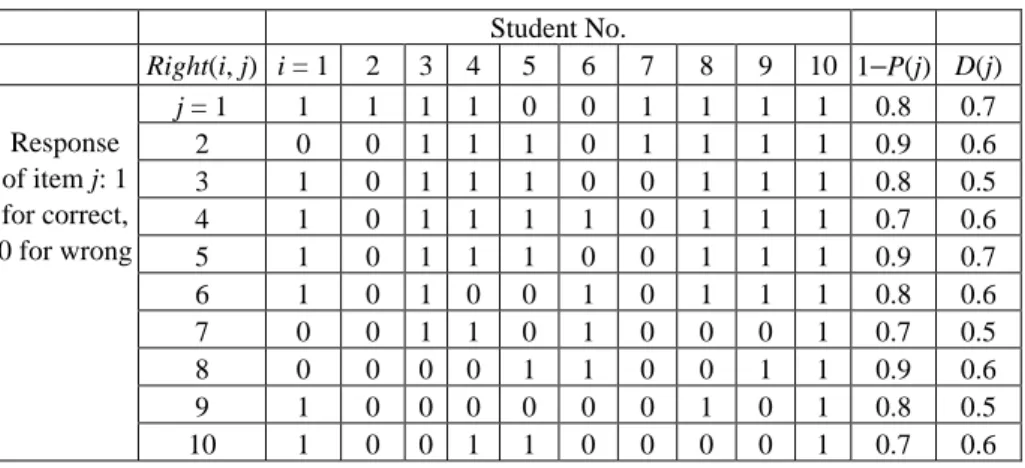
(12)Table 3. The data set for a test example (difficulty index and discrimination index).
Student No. Right(i, j) i = 1 2 3 4 5 6 7 8 9 10 1−P(j) D(j) j = 1 1 1 1 1 0 0 1 1 1 1 0.8 0.7 2 0 0 1 1 1 0 1 1 1 1 0.9 0.6 3 1 0 1 1 1 0 0 1 1 1 0.8 0.5 4 1 0 1 1 1 1 0 1 1 1 0.7 0.6 5 1 0 1 1 1 0 0 1 1 1 0.9 0.7 6 1 0 1 0 0 1 0 1 1 1 0.8 0.6 7 0 0 1 1 0 1 0 0 0 1 0.7 0.5 8 0 0 0 0 1 1 0 0 1 1 0.9 0.6 9 1 0 0 0 0 0 0 1 0 1 0.8 0.5 Response of item j: 1 for correct, 0 for wrong 10 1 0 0 1 1 0 0 0 0 1 0.7 0.6
Table 3 shows the data set for one test which has ten test items.
The item answering ability for the ten-item test for test-taker i, Sol(i), is computed in the following manner. For this data set example, the weighted value of the difficulty index of the 1st item for test-taker 1 is determined to be 4 by means of Eq. (9):
Wp(1) = (1 ( P(1)) * 5 = (1 ( 0.2) * 5 = 4.
The weighted value of the discriminative index of the 1st item for test-taker 1, in this example, is determined to be 3.5 from Eq. (8):
Wd(1) = D(1) * 5 = 0.7 * 5 = 3.5.
Also, the weighted value of the test-item answering ability for test item 1 for test-taker 1 is 7.5 from Eq. (9):
Ws(1) = Wp(1) + Wd(1) = 4 + 3.5 = 7.5.
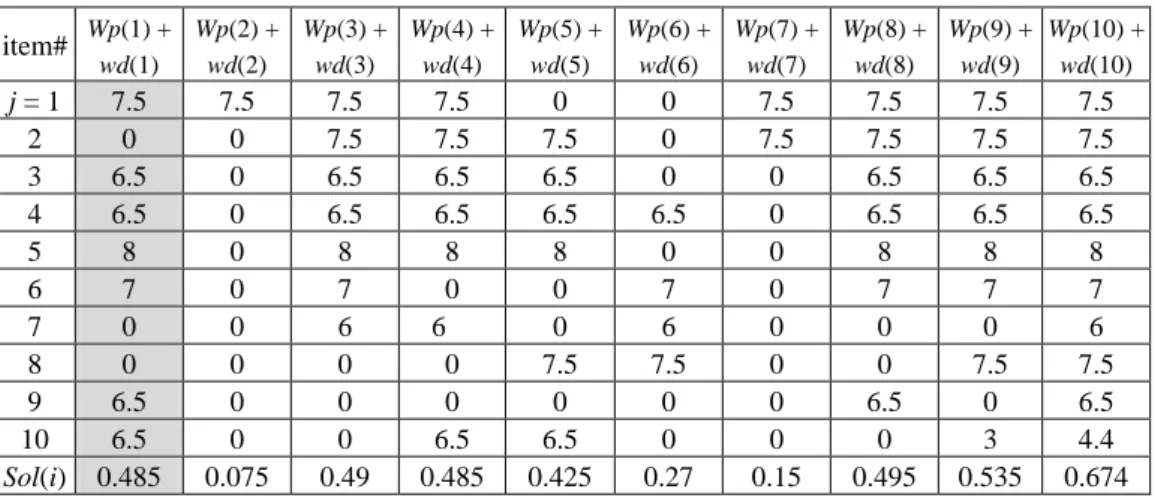
The summation of the weighted value of the test-item answering ability for test-taker 1 is determined to be 48.5 from the numerator of Eq. (10). Finally, Sol(1) is computed as follows: Sol(1) = 48.5/(10 * 5 * 2) = 0.485. Table 4 shows the test-item solving ability results for the test data set shown in Table 3.
Table 4. The ten students’ item solving ability results based on Table 3. item# Wp(1) + wd(1) Wp(2) + wd(2) Wp(3) + wd(3) Wp(4) + wd(4) Wp(5) + wd(5) Wp(6) + wd(6) Wp(7) + wd(7) Wp(8) + wd(8) Wp(9) + wd(9) Wp(10) + wd(10) j = 1 7.5 7.5 7.5 7.5 0 0 7.5 7.5 7.5 7.5 2 0 0 7.5 7.5 7.5 0 7.5 7.5 7.5 7.5 3 6.5 0 6.5 6.5 6.5 0 0 6.5 6.5 6.5 4 6.5 0 6.5 6.5 6.5 6.5 0 6.5 6.5 6.5 5 8 0 8 8 8 0 0 8 8 8 6 7 0 7 0 0 7 0 7 7 7 7 0 0 6 6 0 6 0 0 0 6 8 0 0 0 0 7.5 7.5 0 0 7.5 7.5 9 6.5 0 0 0 0 0 0 6.5 0 6.5 10 6.5 0 0 6.5 6.5 0 0 0 3 4.4 Sol(i) 0.485 0.075 0.49 0.485 0.425 0.27 0.15 0.495 0.535 0.674
4. THE DESIGN AND IMPLEMENTATION OF A DIAGNOSTIC TEST
SYSTEM BASED ON THE ENHANCED S-P MODEL
In this section, we present the design and implementation of a diagnostic test system based on the Enhanced S-P model discussed in section 3. The diagnostic test system based on the Enhanced S-P model is integrated into a web-based CBT system as illus-trated in Fig. 4. It integrates four different subsystems, namely, the item management subsystem, online test subsystem, diagnosis subsystem, and user management subsystem.
4.1 The Item Management Subsystem
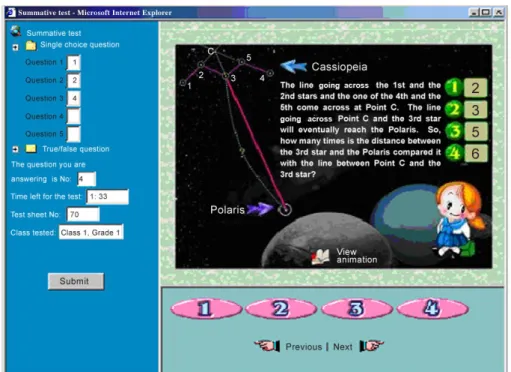
The item management module is in charge of maintaining both the test item bank and the capability index bank. It controls the delivery of test items to the client side (through wired or wireless devices), and the upload of test item files (from the client side) to the test item bank (the server side) through the http or ftp protocol. It also performs the function of online test sheet composition for test-item creators. This system also supports multimedia test items. Fig. 5 shows the user interface (a single choice type test item with a multimedia presentation) as it might appear during a test. Many different types of test items are supported in this system, including single choice, multiple choice, true-false, singular fill-in-the-blank, multiple fill-in-the-blanks, short answer, question-answer matching, and so on. These different types of test items all have rich presentation formats for both test questions and test answers. For example, one can use a video for the test question and expect the test-taker to submit an audio answer with sound, or similarly, one can use images with a text presentation, sound with images, and so on.
The online test sheet construction method supported in the system allows test sheet creators to create test sheets to meet certain curriculum goals; that is, the test items se-lected by the teacher comprise the item metadata, and the system uses the defined meta-data to monitor the testing process and evaluate students online. Thus, to create a test item sheet, the instructor is required to fill in some parameters associated with the test plan and to select the test layout including the test item type, the test item number, and the grade weighting for the test item, and to select a set of test items from the associated test item bank.
4.2 The Online Test Subsystem
The online test subsystem, as shown in Fig. 5 supports many features, such as dif-ferent types of test item selection functions, test item number selection functions, a test-ing trace mechanism, and test item response uploadtest-ing. The test item selection ap-proaches supported in this subsystem include automatic random selection and teacher-defined approaches. When a test is activated, this subsystem allows students to take the test online and records the test-taker’s response time and other parameters useful for the diagnosis test subsystem. Once the test is finished, this subsystem generates feedback and analysis results, such as how many test items were or were not answered, and how much time was spent on the test by a test-taker.
4.3 The Diagnostic Test Subsystem
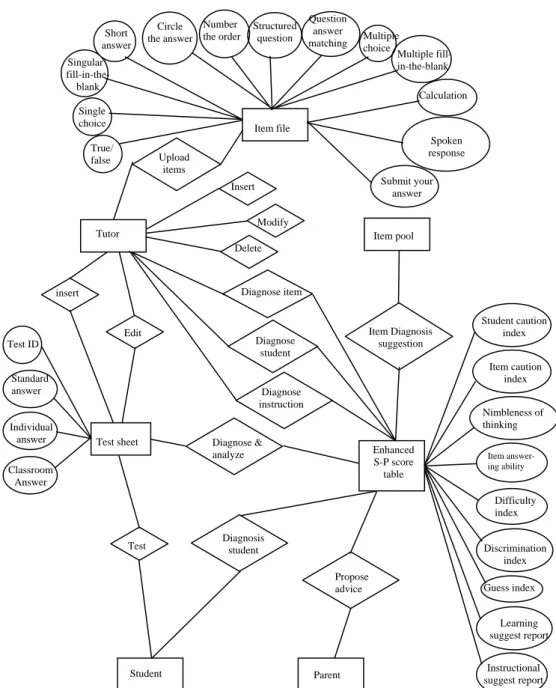
As stated in the previous section, the enhanced S-P model was used to design and implement the diagnostic test subsystem. The Entity Relationship (ER) diagram and the data flow of the diagnosis module are depicted in Figs. 6 and 7, respectively.
Fig. 6 depicts the relationship between the online testing subsystem and diagnostic test subsystem. The data collected from the online test subsystem is analyzed in the di-agnostic test subsystem. The didi-agnostic test subsystem first computes the evaluation in-dexes, such as the student caution index, test item caution index, nimbleness of thinking index, item solving ability index, and so on, based on the data collected from the online test subsystem. Since the original S-P chart is difficult for most users to read, our system allows users to define some common terms based on the correlation with these various indexes obtained through diagnostic analysis. For example, the item prescription needed by teachers to evaluate all of the items and to verify the items’ problems includes the disparity index, item caution indexes, discrimination indexes, difficulty indexes, reliabil-ity index, and text-based diagnostic description. The individual learner prescription in-cludes the student caution index, item solving ability index, nimbleness index, under-stood and not underunder-stood concepts, a hybrid text-based description of the individual’s performance, and suggestions for future learning. The instructional prescription can be used by teachers to improve their pedagogical methods, and it contains the frequency statistics concerning weak performance and suggestions for remedial instruction.
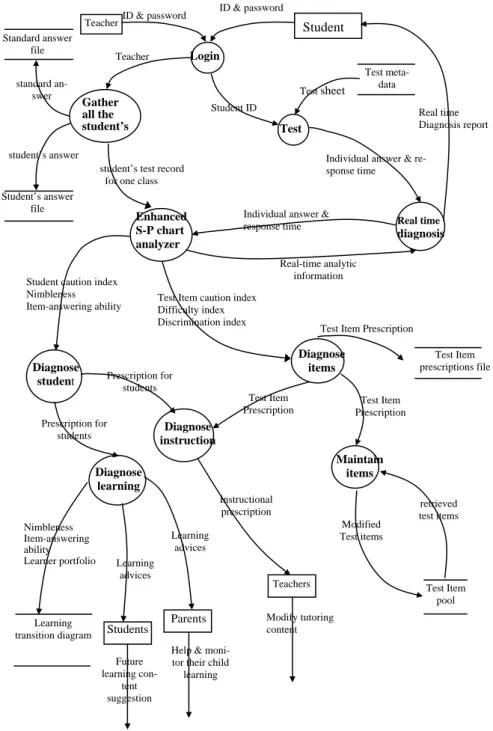
Fig. 7 depicts the Data Flow Diagram (DFD) for diagnosis and statistic analysis in this subsystem.
Basically, the system can be used to diagnose both test items and students with the assistance of the incorporated enhanced S-P model. Through the computation of the various indexes discussed earlier, the system is able to generate 1) some learning advice (prescriptions) for students and parents, and 2) instructional advice (prescriptions) for teachers or instructors.
4.4 The User Management Subsystem
In this subsystem, legal users’ accounts, passwords, and useful management infor-mation are maintained using the supported functionalities.
Fig. 6. The ER diagram of the diagnostic module. Tutor Insert Modify Delete Upload items Item pool Diagnose item Diagnose student Diagnose instruction Item Diagnosis suggestion Enhanced S-P score table insert Edit
Test sheet Diagnose & analyze Item file Test Propose advice Student Parent Diagnosis student Standard answer Individual answer Classroom Answer Single choice True/ false Singular fill-in-the-blank Short answer Calculation Multiple fill- in-the-blank Multiple choice Question answer matching Structured question Number the order Circle the answer Spoken response Submit your answer Test ID Student caution index Learning suggest report Item caution index Nimbleness of thinking Item answer-ing ability Difficulty index Discrimination index Guess index Instructional suggest report
Fig. 7. The DFD of the diagnosis process. Login Student Test Diagnose items Diagnose instruction Diagnose
student Prescription for students
Diagnose learning Maintain items Test Item Prescription Test Item Prescription Test Item Prescription
Test Item prescriptions file Enhanced S-P chart analyzer Teacher Teacher ID Student ID Test sheet Test meta-data file
Individual answer & re-sponse time
Individual answer & response time
Real-time analytic information Test Item caution index
Difficulty index Discrimination index Test Item pool Teachers Parents Students Instructional prescription Student caution index
Nimbleness Item-answering ability Prescription for students Learning advices Learning advices Nimbleness Item-answering ability Learner portfolio Learning transition diagram Modified Test items Future learning con-tent suggestion
Help & moni-tor their child learning Modify tutoring content Real time diagnosis Real time Diagnosis report retrieved test items ID & password ID & password
Gather all the student’s test
re-student’s test record for one class Standard answer file Student’s answer file standard an-swer student’s answer
5. APPLICATION AND EXAMPLES
The integrated CBT system has been applied in research conducted at an elementary school and asenior high school. In the following, we will present some snapshots of the user interface of the proposed CBT system, which was used to collect data in the above-mentioned study.
5.1 Test Item Uploading
A snapshot of the test item uploading module is shown in Fig. 8. The test item up-loader needs to select the type of test item first. Fig. 8 indicates that there are 14 possible types of test items.
Test-items Upload
Single choice type True/False type
Singular-fill-in-the-blank type Calculation type
Short answer type Voice-your-answer type
Submit-your-answer type Question-answer matching type Multiple answers in multiple choice type Multiple-fill-in-the-blanks type Structured Question type Circle the answer type
Numbering-the-order type Mixed type
Fig. 8. Fourteen types of test items supported in the system.
Once a type of test item has been selected, the system asks the test item uploader to fill in the required parameters associated with the test item shown in Fig. 9. These pa-rameters include the subject, item type, test purpose, capability index, and the name of the test.
Question Upload
When the test item uploader fills in the capability index parameters, the system automatically shows the interface for selecting the capability index for the test item as shown in Fig. 10. The uploader is required to select an associated (predefined) capability index for the test item. This capability index table is based on the Ministry of Educa-tion’s Taiwan 9-year mandatory basic education program (grade 1-9 curriculum).
Fig. 10. Interface for selecting the capability index for the item file.
5.2 Online Test Sheet Composition and Management
In the previous section, we explained how a test item is uploaded to the CBT system. In this section, we will explain how a test sheet is composed. The test sheet creator needs to use the test item management system for test sheet composition. Fig. 11 depicts the user interface for the test sheet information that the test sheet creator needs to provide.
Fig. 11. User interface for test sheet creation.
The information that needs to be specified includes the subject of the test, the class name (or grade level), the maximum test time allowed for the test, and a short statement describing the goal of the test. After the above-mentioned basic information is specified and submitted to the server, the test creator is asked by the system to set up the layout and composition of the test sheet as shown in Fig. 12.
The Test Sheet Plan and Layout
Fig. 12. Interface for the test sheet plan and layout.
As indicated in Fig. 12, the test creator has set up the test sheet with 10 single choice test items, 5 true/false test items, 5 single fill-in-the-blank test items, and 4 calculation type test items, with each test item of the calculation type receiving a weighting of 5% of the total test score, and each test item in the rest of the type of test item receiving a weighting of 4% of the total test score. The test sheet’s layout can now be created. To do so, the test sheet creator needs to select test items from the test-item bank according to the layout just created. Fig. 13 shows how test items are retrieved according to the asso-ciated capability index.
As shown in Fig. 13, friendly user interfaces are implemented in the CBT system to assist test sheet creators. Once the test sheet is created and completed, the creator clicks the submit button to deposit the test sheet in the database.
5.3 Online Testing and Diagnosis
To take an online test, the test-taker (student) needs to login to the system with ap-propriate identification such that the system can identify which set of test sheets he or she can use to take the test as shown in Fig. 14. The test-taker then selects a test to take.
Online Testing
Current Database: Science and technology domain/Book 1
Fig. 14. Online test menu.
After all of the online test-takers have finished filling in their predefined test sheets and have submitted them to server, the system begins to diagnose the test sheets. At this point, the diagnosis system is launched. The diagnosis system uses the enhanced S-P model discussed earlier to compute various indexes associated with the test item, test sheet, and test-takers, and then interprets these indexes by producing item prescriptions and instructional advice for test-takers and instructors, respectively, as illustrated in Figs. 15 and 16.
Fig. 15 shows that the caution index, the difficulty index, the discrimination index, and the average response time for the 4th test item are 0.09, 0.55, 0.9, and 23 seconds, respectively. The diagnosis description shows that the item is perfect, and that it does not need to be modified. Also, the difficulty level is medium and suitable for average stu-dents. Fig. 16 shows that 7, 2, and 19 students were unable to achieve a capability index of 1-1-1-1 (the concept of network communication), 1-1-1-2 (the application of a net-work), and 1-1-2-2 (the programming concepts of loop and sort), respectively. The sys-tem shows that the instructor should provide remedial coursework on the programming concept for the students in that class.
Fig. 16. Example of instructional advice.
Fig. 17. Example of a prescription for an individual learner following system diagnosis
The test-takers also can query their individual learning status and get the sugges-tionsafter the test. Fig. 17 shows an example of an individual learner’s prescription. The system gives the diagnosis description for these indexes. In this example, the student caution index, the nimbleness of thinking index, and the test-item answering ability index are 0, 0.67, and 0.23, respectively. The test-taker in this case has attained the curriculum
goal with capability indexes of 1-1-1-1 (network communication), 1-1-1-2 (network ap-plication), and 1-1-2-4 (the format of the picture file). However, test-taker’s understand-ing of the programmunderstand-ing concept is very poor, as indicated by the capability index of 1-1-2-2, the student should accept the remedial course in this subject area.
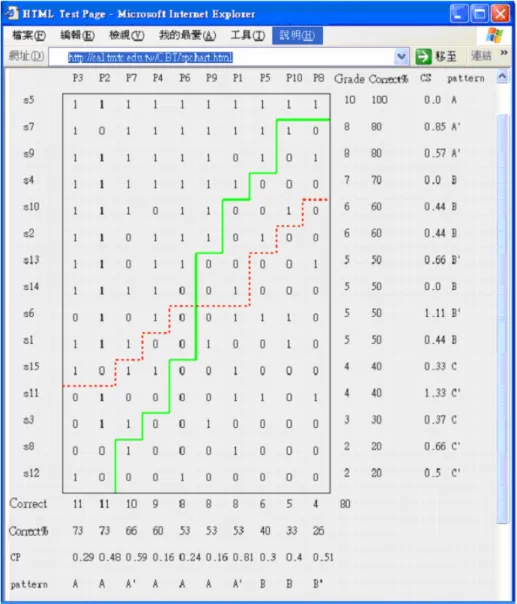
Table 5. Example of an SP score table for students in one senior high school.
5.4 The S-P Score Table and Statistic Diagrams
Table 5 shows an example of an enhanced S-P score table obtained from the diag-nostic test on the 1st year of senior high school in Taiwan (which is equal to the 10th
grade in the U.S. system). This enhanced S-P table provides the entire diagnostic analysis results for the test-takers and test items. The bottom part of the table shows the correct response percentage, the caution index, the difficulty index, and the discrimination index for each test item. The caution indexes for the 5th test item and the 13th test item are both above the normal value, indicating that these two test items should be redesigned or modified. The discrimination indexes of test items 10, 11, 15, 7, 5, 14, 3, and 9 are lower than the normal value, so these test items cannot differentiate the learning performance of the test-takers. The KR-20 coefficient is 0.773, which shows that the test sheet is sta-ble and reliasta-ble. The disparity index for this test is 1.367, which is over 0.6, indicating that some of the test items should be improved and modified. The scatter diagram of the test items’ caution index and the bar chart of item category in one test are illustrated in Fig. 18.
As for student diagnosis, the right side of the Table 5 shows the correct response percentage, the caution index, the nimbleness of thinking index, and the item-answering ability index for students. The caution indexes of students’ number 2, 3, 4, and 6 are all within the normal range. This indicates that these students may have been careless during the test or lacked understanding of the learning contents or unstable during his study. The scatter diagram of students’ caution index and the bar chart of students’ learning catego-ries in one test are illustrated in Fig. 19.
Fig. 18. Scatter diagram of items’ caution index and bar chart of item category in one test.
Fig. 19. Scatter diagram of students’ caution index and bar chart of students’ learning category in one test.
Table 5 also shows that the nimbleness index can be used to tell which students re-sponded quickly to certain test items. A student with higher nimbleness index possesses better mastery of the learning content. For instance, students number 10, 12, and 32 have the same number of correct responses in the test, but their nimbleness indexes are differ-ent. In this case, it is appropriate to conclude that student number 12 has the better mas-tery of the learning content.
In traditional test assessment, all students who have the same number of correct re-sponses get the same score or ranking. In this system, we can further differentiate among students who have the same score or ranking based on their item-answering ability. In this example, both students number 21 and 9 have 14 correct responses (or 70%) in the test, but their item-answering ability is 1.7 and 1.8, respectively.
6. CONCLUSIONS
The diagnostic test system plays an important role in distance learning and web-based instruction because of its functions for assessing learner performance and diagnosing learning problems. As a result, a S-P chart was proposed for this purpose. However, the current S-P model cannot take the test-taker’s response time into consid-eration. In this study, the nimbleness of thinking index has been proposed to enhance the S-P model. It possesses time dependent information and can be used to understand the response speed of test-takers. We have also proposed the test-item answering ability in-dex for analyzing an examinee’s test-item answering capability in a test. In addition, a proposed diagnostic test system based on the Enhanced S-P model has been designed and implemented. This system has been integrated into a web-based CBT system, which has four different subsystems, namely, the item management subsystem, online test subsys-tem, diagnosis test subsyssubsys-tem, and users management subsystem.
This integrated CBT system has been applied in a study conducted at an elementary school and a senior high school. Application examples have been given to demonstrate the applicability of this system. Various useful charts and prescriptions can be generated by the system and used by instructors to diagnose their instructional approaches and by students to diagnose their learning performance. This information can provide guidelines to help instructors improve their pedagogy and supply course remedy advice to students after the test.
ACKNOWLEDGMENTS
This research is supported in part by the Bestwise International Computing Co., CAISER (National Chiao Tung University, Taiwan), and National Science Council (Tai-wan).
REFERENCES
1. A. S. Mcdonald, “The impact of individual differences on the equivalence of com-puter-based and paper-and-pencil educational assessments,” Computers and
Educa-tion, Vol. 39, 2002, pp. 299-312.
2. C. Chien, “Constructing a computer-assisted testing and evaluation system on the world wide web − the CATES experience,” IEEE Transactions on Education, Vol. 43, 2000, pp. 266-272.
3. D. Harnisch and R. L. Linn, “Analysis response patterns: questionable test data and dissimilar curriculum practices,” Journal of Educational Measurement, Vol. 18, 1981, pp. 133-146.
4. D. M. Switzer and M. L. Connell, “Practical applications of student response analy-sis,” Measurement in Education, the annual meeting of the national council of 1989, pp. 53-65.
5. D. W. Johnson and R. T. Johnson, Meaningful Assessment, Allyn and Bacon, 2002. 6. H. Y. Wu, “Software based on S-P chart analysis and its applications,” National
Science Council, NSC-86-2511-S-252-001-CL, 1998.
7. I. Chacko, “S-P chart and instructional decisions in the classroom,” International Journal of Mathematical Education in Science and Technology, Vol. 29, 1998, pp. 445-450.
8. J. Salvia and J. E. Ysseldyke, Assessment, 8th ed., Houghton Mifflin Company, 2001.
9. M. N. Yu, Educational Test and Assessment: Performance Test and Instructional Assessment, Psychological Publishing Co., Ltd., 1987. (in Chinese)
10. S. L. Blixt and T. E. Dinero, “An initial look at the validity of diagnoses based on Sato’s caution index,” Educational and Psychological Measurement, Vol. 45, 1985, pp. 55-61.
11. T. E Dinero and S. L. Blixt, “Information about tests from Sato’s S-P chart,” Col-lege Teaching, Vol. 36, 1988, pp. 123-128.
12. T. Sato, The Construction and Interpretation of the S-P Table − Instructional Analysis and Learning Diagnosis, Tokyo, Japan, Meiji Tosho, 1975. (in Japanese) 13. T. Sato, The S-P Chart and the Caution Index, NEC Educational Information
Bul-letin 80-1, C&C Systems Research Laboratories, Nippon Electric Co., Ltd., Tokyo, Japan, 1980. (in Japanese)
14. T. Sato, Introduction to S-P Curve Theory Analysis and Evaluation, Tokyo, Japan, Meiji Tosho, 1985. (in Japanese)
Deng-Jyi Chen (陳登吉) received the B.S. degree in Com-puter Science from Missouri State University (cape Girardeau), U.S.A., and the M.S. and Ph.D. degrees in Computer Science from the University of Texas (Arlington), U.S.A. in 1983, 1985, and 1988, respectively. He is now a Professor in the Computer Science and Information Engineering Department of National Chiao Tung University (Hsinchu, Taiwan). Prior to joining the faculty of National Chiao Tung University, he was with National Cheng Kung University (Tainan, Taiwan). So far, he has pub-lished more than 130 related papers in the areas of software en-gineering (software reuse, object-oriented systems, and visual requirement representa-tion), multimedia application systems (visual authoring tools), e-learning and e-testing
systems, performance and reliability modeling, the evaluation of distributed systems, and computer networks. Some of his research results have been transferred to the industrial sector and used in product designs. So far, he has been a chief project leader for more than 10 commercial products. Some of these products are widely used around the world. He has received both research and teaching awards from various organizations in Taiwan and has served as a committee member for several academic and industrial organizations.
Ah-Fur Lai (賴阿福) is currently a doctoral candidate in
the Department of Computer Science and Information Engineer-ing at National Chiao Tung University. He is now an Associate Professor in the Department of Mathematics and Computer Sci-ence Education at Taipei Municipal University of Education. His research interests include e-learning, and computer-based testing and assessment.
I-Chang Liu (劉奕樟) received the M.S. degree in e-Learn-ing from National Chiao Tung University in 2003. He is cur-rently the director of academic affairs at National Chung- Li Home Economics and Commercial Vocational High School.