National Chiao Tung University
Department of Transportation and Logistics
Management
Thesis
社會、經濟和基礎設施等因素是否影響國家的物流
能力
Analysis of The Influence of Social, Economic, and Infrastructure
Factors on Country Logistics Performance
Student :
Murboyudo Joyosuyono
Advisor :
Kun Feng Wu, Ph.D
Andi Cakravastia, Ph.D
社會、經濟和基礎設施等因素是否影響國家的物流能力
Analysis of The Influence of Social, Economic, and Infrastructure
Factors on Country Logistics Performance
研究生
: 馬悠拓
Student
: Murboyudo Joyosuyono
指導教授 : 吳昆峰
Andi Cakravastia
Advisor
: Kun Feng Wu
Andi Cakravastia
國立交通大學
運輸與物流管理學系
碩士論文
A Thesis
Submitted to Department of Transportation and Logistics Management College of Management
National Chiao Tung University in partial Fulfillment of the Requirements
for the Degree of Master
in
Logistics Management August 2014
Hsinchu, Taiwan, Republic of China
社會、經濟和基礎設施等因素是否影響國家的物流能力
研究生:馬悠拓 指導教授:吳昆峰
Andi Cakravastia運輸與物流管理學系
國立交通大學
摘
要
一個國家的物流績效攸關國家的競爭力,所以它是衡量與追蹤物流績效的重要關鍵。 世界銀行物流績效指數(LPI)是由世界銀行制定以衡量每一個國家的物流績效指數。然 而,LPI 主要來自調查與專家學者評估,故難以評估 LPI 指標的改善對提昇物流服務品 的影響。本研究基於社會、經濟、實體設施等易被追蹤與評估之因子以提出一個新架 構,進而用以量測一個國家物流的績效。研究結果顯示本研究所提出之評估架構,其 預測結果與世界銀行 LPI 指標所量測的分數一致。因此,本研究所提出之評估架構可 被用來評估一個國家的物流績效,且本研究所確立的影響因子可提供未來相關政府單 位進行政策施行之決策輔助參考。 關鍵字: 物流績效指數、經濟因子、社會因子、物流品質評估 措施、設施因子Analysis of The Influence of Social, Economic, and Infrastructure
Factors on Country Logistics Performance
Student: Murboyudo Joyosuyono Advisor: Kun Feng Wu
Andi Cakravastia
Department of Transportation and Logistics Management National Chiao Tung University
Abstract
The performance of a country’s logistics, is critical to its competitiveness. Therefore, it is of utmost important to measure and track the performance. Logistics Performance Index (LPI) is an index developed by the World Bank to measure a country’s logistics performance worldwide. Nevertheless, because LPI is based on surveys and assessment from experts. It is hard for countries to measure the effect of improvement of LPI indicators in terms to increase their logistics quality. One of the goals of this study is to develop another scheme to measure the quality of a country’s logistics based on social, economic, and infrastructure factors which is geared towards enhancing the performance of logistics that can be tracked and compared more easily. Our results show that the predictions based on the scheme that developed in this study is consistent with the World Bank’s LPI scores and can be used to evaluate country’s logistics performance hence it is promising to develop policy implications based on the factors identified in this study.
Keywords: logistics performance index, economic factors, social factors, logistics quality measures, infrastructure factors
ACKNOWLEDGEMENTS
Alhamdulillah. Foremost, I would like to express my sincere gratitude to my advisor Kun-Feng Wu, Ph.D. and Dr. Andi Cakravastia for the continuous support and guidance of my thesis. Besides my advisor, I would like to thank the rest of committee (Professor Kuan-Cheng, Huang and Ming-Jong, Yao) in supporting my thesis, and also The World Bank for providing the data for my research.
My sincere thanks also goes to National Chiao Tung University (NCTU) in Taiwan, Institut Teknologi Bandung (ITB) in Indonesia and also The Ministry of Industry (MOI) of Indonesia for the support by which this piece of collaborative research could be made.
I would like to thank to all my friends in Master Program students of Supply Chain-ITB for the friendship and support, especially for Double Degree Program students Chain- ITB-NCTU: Ari, Devi, Misbah, Iqbal, and Taufik. I would also like to thank my lab mates Yu-che and Sheng-yin thanks a lot for the nice friendship and help me to deal with administration things. And also all the members of Moslem Student Club (MSC) and Boai Dorm 5 for the friendship and brotherhood in this last one year.
Last but not the least, I would like to thank my family: my parents who supporting me spiritually throughout my life and for everything what I have become; my lovely wife Hesnawariq and my daughter Almaira Syauqia Maheswari for supporting me day by day to be strong undergo any process earned a master degree. Also my brothers and sister for always supporting me to achieve good education. I dedicated this thesis for all of you.
Table of content 摘 要 ... i Abstract ... ii Acknowledgement ... iii Table of Contents ... iv Tables ... v Figures………..……….…………vi 1. Introduction ... 1 1.1 Research Objective ... 2 1.2 Research Position ... 2 1.3 Possible Contribution ... 3 2. Literature Review ... 4
2.1 Logistics on Global Trade ... 4
2.2 Logistics Performance Index ... 4
2.3 Seemingly Unrelated Regression ... 5
2.3.1 SUR Basic Equation ... 6
2.3.2 The advantage of SUR ... 7
3. Methodology and Data ... 9
3.1 Research Framework ... 9
3.2 Factor Identification ... 10
3.3 Data Collection ... 15
4. Estimation Result and Data Analysis... 17
4.1LPI Component Prediction ... 17
4.2 Case Study on “How Indonesia Performs?” ... 21
4.3Logistics Indicator Improvement Tracking ... 28
5. Discussion and Conclusion ... 30
5.1 Discussion ... 30 5.2 Conclusion... 31 References ... 33
Tables
Table 1. Literature related to country logsitics perfromance ... 3
Table 2. Factors and indicators From Study Literature ... 10
Table 3. Indicators that included into the model ... 11
Table 4. SUR model result for LPI component ... 18
Table 5. Comparison between LPI Indicator and relation to LPI component ... 23
Table 6. Indicator improvement scenario and the impact to LPI ... 28
Figures
Figure 1.Research Framework ... 9 Figure 2.Country Included in This Study ... 16 Figure 3 Comparison of Indonesia’s logistics performance and competitor country. ... 22
CHAPTER 1. INTRODUCTION
In this globalization era, where the boundaries between countries become less, the concept of global supply chain is commonly adopted by manufacturing company. In this concept, logistics have an important role to conduct a reliable global supply chain. To produce a product the raw material might be imported from several supplier from different country and then the final product will be exported to another market countries. This condition shows the importance for a country to improve their logistics performance to facilitate the global supply chain that applied in company level.
The performance of a country’s logistics, is critical to its competitiveness (Arvis, et al. 2010). Therefore it is of utmost importance to measure and track the performance upon which identification of the challenges that are to be faced by a country. Logistics Performance Index (LPI) is an index developed by the World Bank to measure a country’s logistics performance worldwide. Because LPI is a subjective index based on surveys and assessment from experts it is hard to measure the effect of improvement of LPI indicators in term to increase their LPI score.
To overcome the challenges, this study adopt the framework from LPI report (2010) where it is measured by six components that are classified into two main categories called the input and the outcomes. The input components are customs, infrastructure and logistics competence while the outcomes component are international shipment, timeliness, tracking and tracing. Seemingly unrelated Regression method applied to conduct a countries logistics quality measurement using surrogate model to measure quality of logistics using objective indicators as the predictors thereby enhancing the relation between LPI components and the indicator from the influencing factors will be analyze.
This study will also discuss about Indonesia’s logistics performance as a study case in terms of the LPI and the key indicators affecting its LPI. Logistics become vital aspect for Indonesia in connecting either domestic or international trading. As a country with huge amount of export and import trading value, there is the need for it to be supported with a good performance logistics sector otherwise will become an obstacle for economic growth. Even though Indonesia knows Logistics Performance Index (LPI) from the World Bank publication, yet still has not measured its logistics performance both in terms of logistics costs and other logistics indicators. At macro level there is the necessity to evaluate the national logistics performance, the effectiveness and efficiency of the implementation of the blueprint of National Logistics System.
This paper constitutes of five sections which includes the following. Section one entails of brief Introductory, research background, objective, contribution and position compare to previous study. The second section describe the literature review about logistics, LPI and the methodology that applied in this research as well. As for section three talks about research methodology and data collection. The fourth section discusses about the estimation results and data analysis. Finally, the fifth is about the discussion, conclusion of the summary of the findings, contribution of the paper, implications and suggestions for further studies.
1.1. Research Objective
One of the goals of this study is to develop another scheme to measure the quality of a country’s logistics based on social, economic and infrastructure factors so that the performance of logistics can be tracked and compared more easily and also to overcome the challenges as mentioned before. After the completion of conducting the measurement model, a suggestion will be given as how to improve the countries logistics performance based on the findings.
1.2. Research Position
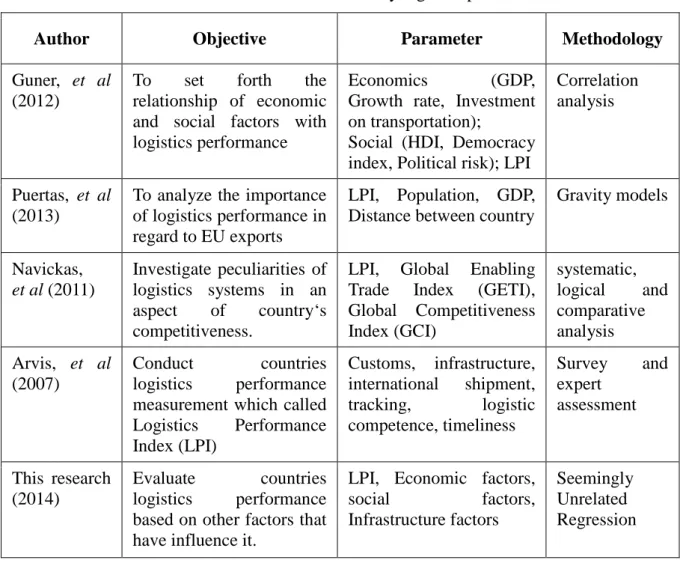
Before this research there have been many research that study about the relation of logistics and other factors like economic, infrastructure also social but there is still no research that apply the SUR approach to determine the relationship between logistics performance and factors affecting it. Gunner, et al. (2012) apply correlation analysis to determine the relation of country logistics performance and some factors that affecting it. Puertas, et al (2013) try to analyze the importance of logistics performance in regards to country export – import in European Union countries. The measurement of countries logistics performance based on survey and expert assessment were conducted by Arvis, et al (2007). While this research is trying to evaluate countries logistics quality by using objective indicators that related to logistics performance and the indicator.
The comparison between this study and the previous studies is shown in table 1 which segmented by research objective, parameter specification, and methodology
Table 1 literature related to country logistics performance
Author Objective Parameter Methodology
Guner, et al (2012)
To set forth the relationship of economic and social factors with logistics performance
Economics (GDP, Growth rate, Investment
on transportation);
Social (HDI, Democracy index, Political risk); LPI
Correlation analysis
Puertas, et al (2013)
To analyze the importance of logistics performance in regard to EU exports
LPI, Population, GDP, Distance between country
Gravity models Navickas, et al (2011) Investigate peculiarities of logistics systems in an aspect of country‘s competitiveness.
LPI, Global Enabling Trade Index (GETI), Global Competitiveness Index (GCI) systematic, logical and comparative analysis Arvis, et al (2007) Conduct countries logistics performance measurement which called Logistics Performance Index (LPI) Customs, infrastructure, international shipment, tracking, logistic competence, timeliness Survey and expert assessment This research (2014) Evaluate countries logistics performance based on other factors that have influence it.
LPI, Economic factors,
social factors, Infrastructure factors Seemingly Unrelated Regression 1.3. Possible contribution
As the expected benefits from this study, the output of this study will contribute in practical and academic issues, there are:
1. Practical: The expected result of this research is the output can be used as a reference in evaluating and improving countries logistics performance quality, particularly Indonesia as a study case country.
2. Academic: In academic terminology, the output of this study will provide knowledge in the field of country logistics performance measurement using the objective dataset as the input.
CHAPTER 2. LITERATURE REVIEW
2.1 Logistics on Global Trade
The definition of Logistics is the activity that manages the flows of goods, cash, information between the point of supply and the point of demand. It includes activities like transportation, warehousing, packaging, and material handling, etc. (Gunner, et al. 2012). In this global world, logistics is becoming more important aspect for companies as well as countries. As Burmaoglu and Sesen (2011) suggested that firm level logistics activities has been affected by national and global environment.
Arvis, et al. (2012) proposed that the most important elements of national competitiveness is the national logistics. The quality of logistics services and infrastructure definitely has impact on the transportation of goods among countries. The definition of efficient delivery in term of logistics services is the ability to move goods immediately, reliably and at low cost mentioned by Hollweg and Wong (2009),while Korinek and Sourdin (2011) shows that inefficient logistics structure will cause additional costs for a company in terms of time and money. This kind of condition will affect the country and company competitiveness in a negative way.
Some empirical studies have revealed the positive impact of logistics performance on international trade flows. Nordas and Piermartini (2004) found that quality of infrastructure has a significant relationship with trade flows and among of all infrastructure indicators shows that port efficiency has the largest relationship with trade flow. Hausman et al. (2005) have demonstrated that the significant relationship between transportation costs and international trade flow indicates that weak logistics performance causes a decrease in trade volumes. Also Limao and Venables (2001) proved the significant relationship between transportation costs, the quality of transportation infrastructure and countries trade volumes.
2.2 Logistics Performance Index (LPI)
Logistics Performance Index (LPI) is an index developed by The World Bank. It is a comprehensive index which is created to help countries identify the challenges and opportunities they face in trade logistics performance. Arvis, et al. (2012), this is a survey based index that is assessed by the logistics expert and conducted every two years. The first LPI survey was conducted in 2007, updated in 2010, 2012 and the latest edition is in 2014. The LPI survey consists of two major parts offering two different prospective. First is the international LPI that provides qualitative evaluations of a country by its trading partners-logistics professionals working outside of the country and then the domestic LPI which
provides both qualitative and quantitative assessments in the country by logistics professionals works inside the country including detailed information on the logistics environment, core logistics processes, institutions, performance time and cost data.
The LPI can also show countries logistics bottleneck based on its component and the country can identify where their weak aspect from all of the LPI area. Below is the six areas of LPI assessments of a country’s logistics performance:
• Customs: Efficiency of the customs clearance process.
• Infrastructure: Quality of trade and transport-related infrastructure.
• International Shipments: Ease of arranging competitively priced shipments. • Logistics Competence: Competence and quality of logistics services.
• Tracking & Tracing: Ability to track and trace consignments.
• Timeliness: Frequency with which shipments reach consignee within the scheduled or expected time.
The LPI is constructed from these six indicators using principal component analysis (PCA), a standard statistical technique used to reduce the dimensionality of a dataset. The result is a single indicator the LPI that is a weighted average of those scores. The weights are chosen to maximize the percentage of variation in the LPI’s original six indicators.
According to Arvis, et al. (2012) on survey respondent data collection as described in the LPI report on how to measure the international LPI. They described in the LPI report that to measure the international LPI, each survey respondent rates eight oversea markets on six core components of logistics performance. The eight countries are chosen based on the most important export, import markets of the country where the respondent is located, on random selection, and for landlocked countries on neighboring countries that form part of the land bridge connecting them with international markets. The method used to select the group of countries rated by each respondent varies by the characteristics of the country where the respondent is located.
The 2009 respondent demographics of the LPI survey constitutes of one thousand professionals from various international companies in 130 countries who participated in the survey. 69 out of the 130 countries participated in the 2009 LPI survey in Canada.
2.3 Seemingly Unrelated Regression
Regression analysis is a statistical analysis that plays a major role in helping to model many economic phenomenon in the form of mathematical equations: y = Xβ + ε. This model is a linear form. When the variables in X values is determined earlier (pre-determined) as
variables that can be measured or assessed. β is an unknown parameter and its value will predicted, and ε which represents the error.
Based on these assumptions, the β parameter estimation methods are often used is the least squares method. This method can only be used to estimate the model parameters in a single regression equation. However, in certain cases there is a model that consists of multiple regression equations or systems that are simultaneously, thus forming a system of equations. In this model, the equations were related to each other where there is a relationship between the dependent variable, resulting in a correlation between the errors between equations. The system of the equation is called the Seemingly Unrelated regressions (SUR).
Even though based on the literature review there has been no research that apply SUR in logistic performance measurement area. This approach is already used in some research to analyze multivariate case. Budiwinarto (2013) applies SUR to linear demand system model to analyze the food demand model in Indonesia where the case is the food demand of a household related to others. Again Wilde, et al. (1999) apply SUR to identify the effect of income and food programs on dietary quality. Both cases are multivariate problems where the model is consist of more than one equation.
2.3.1 SUR Basic Equation
The SUR procedure was originally developed by Zellner (1962). SUR equation system contains a set of interrelated equations. The relationship between equations can be seen from the error correlations between equations (contemporaneous correlation). Basic SUR model is defined as: Yj = ßiXi + êi , i= 1,…, m (1) Or � Y1 Y2 : Yj � = � X1 0 ⋯ 0 0 X2 ⋯ 0 ⋯ ⋯ ⋯ ⋯ 0 0 ⋯ X𝑚𝑚 � � β1 β2 : β𝑚𝑚 � + � ε1 ε2 : ε𝑚𝑚 � (2)
Since it is a multivariate approach then the equation (1) could be expand into a matrix as equation (2). Where Y1,Y2,…,Yj is represent the dependent variables where in this study is the LPI input indicators, and X1, X2, …, Xm is the set of predictor for each equation where in this study is the social, economic, and infrastructure factors, while β1, β2,…, βm are the coefficient for each predictors and ε1, ε2,…, εm is the error for each equations.
For SUR model, the assumptions are the errors are uncorrelated and that the error for any individual model have constant variance but that the errors in different models are
correlated. Where it can be describe mathematically by these equation below: E(εi εj’)= � σij 0 ⋯ 0 0 σij ⋯ 0 ⋯ ⋯ ⋯ ⋯ 0 0 ⋯ σij � = σij I, (3)
Where I is the identity matrix m x m. Value above shows the covariance of two equations in the system with the m equation. In general:σ11
Ω = E(εi ε’j ) = � σ11I σ12I ⋯ σ1𝑚𝑚I σ21I σ22I ⋯ σ2𝑚𝑚I ⋯ ⋯ ⋯ ⋯ σ𝑚𝑚1I σ𝑚𝑚2I ⋯ σ𝑚𝑚𝑚𝑚I � (4)
All information about the error covariance is in Ω matrix. The most efficient estimator from Equation (2) is Generalized Least-Square estimation, (GLS) Pindyck and Rubinfeld (1991), Greene (1991):
β′= (X′Ω−1 X)−1 (X′Ω−1 Y) (5)
Because Ω elements is unknown, then the element must be alleged. This estimation conducted by using any residual from each equations obtained and applying the least squares method,
σ′
ii= s
ii=
ei′ .ei 𝑁𝑁−𝐾𝐾𝐾𝐾σ′
ij= s
ij=
ei ′ .e i �(𝑁𝑁−𝐾𝐾𝐾𝐾)(𝑁𝑁−𝐾𝐾𝐾𝐾)e
i= Y
i− X
iβ′iIn the SUR equation, it can be seen that between one equation and other are interrelated. This is indicated by the correlation between the errors of each equations.
2.3.2 The advantage of SUR
As already proposed in previous chapter that in this research the measurement of countries logistics performance is using six main criteria from LPI component. Thus the prediction model is a multivariate model with six dependent variable which related one and another. According to this specification the SUR model is the most suitable approach to model this logistics performance measurement. Compared to other approaches like multiple regression or multivariate regression, SUR approach is more advance because it has different sets of predictors that can be used as independent variables for every dependent variables.
Unlike the multivariate regression where the model use same set of predictors to explain dependent variables. This characteristics makes the approach suitable to be applied in the study, since the framework shows that the problem is a multivariate where the model is
consist of more than one dependent variables that related to one and another. Moreover each dependent variables are unique so it is necessary to use different sets of predictors to model this logistics performance measurement problem.
CHAPTER 3. METHODOLOGY AND DATA
3.1 Research Framework
By adopting the LPI measurement framework from World Bank LPI report where the components of LPI measurement were chosen based on recent theoretical, empirical research and on the practical experience of logistics professionals involved in international freight forwarding (Arvis, et al. 2012). Korpela and Tuominen (1996) stated that benchmarking company logistics operations is based on five logistic critical success factors such as Reliability, Flexibility, Lead time, cost effectiveness, and value added. Goh and Ling (2003) also describe in their research that transportation, telecommunication infrastructure, customs regulation, and warehousing are vital aspect to logistics development in China.
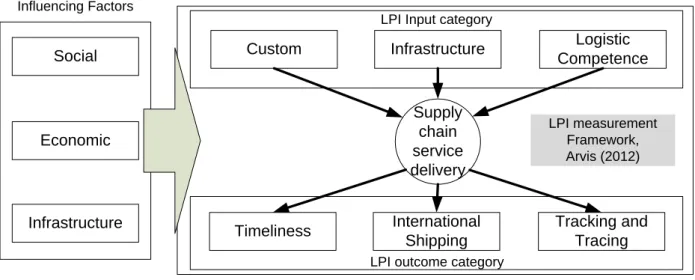
The figure below maps the six LPI indicators into two main categories namely input and outcomes category. The first category called input category is the area for policy regulations indicating main inputs to the supply chain which consist of customs, infrastructure and quality of logistics services. The second category is a service delivery performance to indicate the outcomes which is represented by the timeliness, international shipments, tracking and tracing. This represents the three main indicators for logistics performance which is time, cost, and reliability. Custom Logistic Competence Infrastructure Supply chain service delivery
Timeliness Tracking and Tracing International Shipping Social Infrastructure Economic LPI measurement Framework, Arvis (2012) Influencing Factors
LPI Input category
LPI outcome category
Figure 1 Research Framework
In this study, first, all the indicator from three influencing factors that already filtered based on theory, previous study, and also the completeness of the dataset are used to predict six LPI components (customs, infrastructure, and logistics competence, international shipping, timeliness, and tracking and tracing), beside to predict the value of LPI, this also to analyze
the relation between the indicators from influencing factors to LPI components. After all of the indicators for all LPI component identified, and also the relation between indicators and LPI components, then a study case analysis were conduct to further analyze the effect of each indicators to country logistics performance and to improve the logistics quality based on the indicators.
3.2 Factors identification
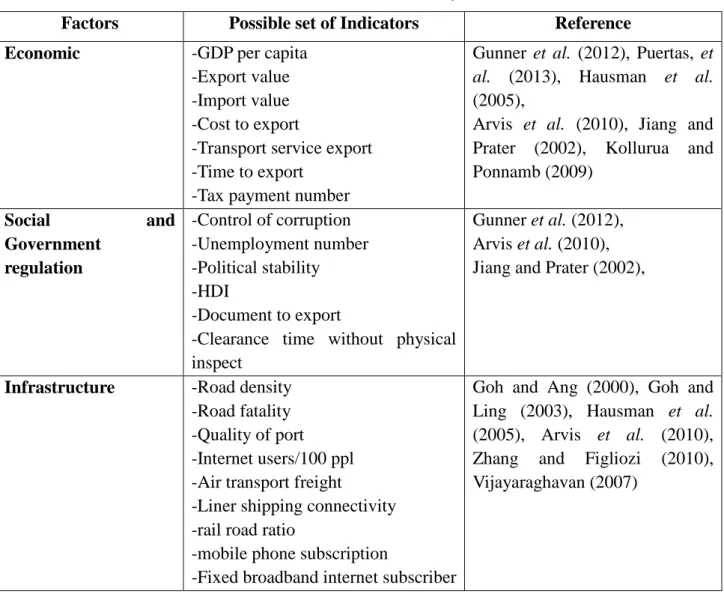
The factors that indicates has relation to logistics performance by referring to any related literature from previous study are proposed. All Factors and their reference in detail are shown in Table 2 then Table 3 describes the indicators that are selected in the model.
Table 2 Factors and indicators From Study Literature
Factors Possible set of Indicators Reference
Economic -GDP per capita
-Export value -Import value -Cost to export
-Transport service export -Time to export
-Tax payment number
Gunner et al. (2012), Puertas, et
al. (2013), Hausman et al.
(2005),
Arvis et al. (2010), Jiang and Prater (2002), Kollurua and Ponnamb (2009) Social and Government regulation -Control of corruption -Unemployment number -Political stability -HDI -Document to export
-Clearance time without physical inspect
Gunner et al. (2012), Arvis et al. (2010), Jiang and Prater (2002),
Infrastructure -Road density -Road fatality -Quality of port -Internet users/100 ppl -Air transport freight
-Liner shipping connectivity -rail road ratio
-mobile phone subscription
-Fixed broadband internet subscriber
Goh and Ang (2000), Goh and Ling (2003), Hausman et al. (2005), Arvis et al. (2010), Zhang and Figliozi (2010), Vijayaraghavan (2007)
The factors above are the indicators from the previous study that used to predicts the countries logistics. But, several of these indicators turned out to be highly correlated with one another and some of them have very sparse data. Based on a preliminary assessment of the indicators, a smaller subset was selected for inclusion in the analysis and in line with the SUR
model framework. These indicators from three factors that are used as independent variables are rationally related to the logistics in a country. Further discussion on the rational and reasons of these factors chosen are described below:
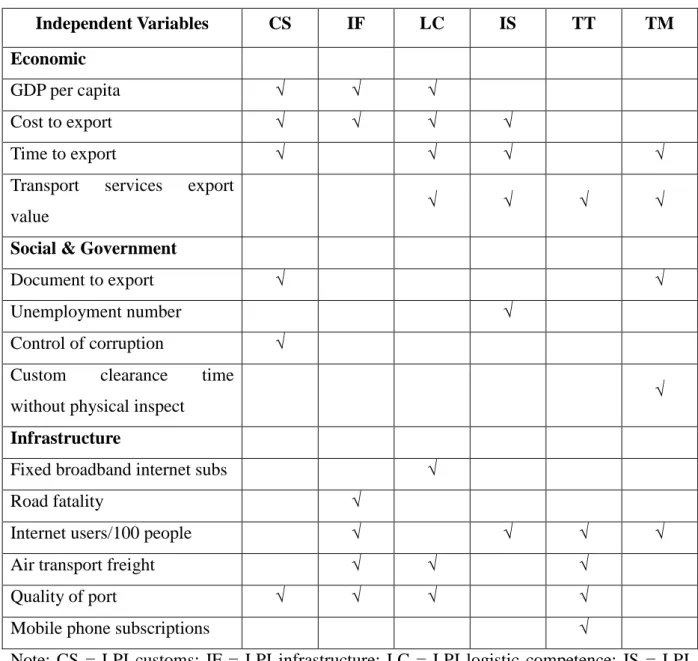
Table 3 Indicators that included into the model
Independent Variables CS IF LC IS TT TM
Economic
GDP per capita √ √ √
Cost to export √ √ √ √
Time to export √ √ √ √
Transport services export
value √ √ √ √
Social & Government
Document to export √ √
Unemployment number √
Control of corruption √
Custom clearance time
without physical inspect √
Infrastructure
Fixed broadband internet subs √
Road fatality √
Internet users/100 people √ √ √ √
Air transport freight √ √ √
Quality of port √ √ √ √
Mobile phone subscriptions √
Note: CS = LPI customs; IF = LPI infrastructure; LC = LPI logistic competence; IS = LPI International Shipment; TT= LPI tracking & Tracing; TM = LPI Timeliness
Comprehensive description on the motive behind choosing these indicators and their relation to logistics performance are explained below:
Economic Factors • GDP per capita
In Gunner, et al. (2012) and Puertas, et al. (2013) study, GDP is used as a parameter in some study about Logistics. Gunner, et al. (2012) shows that GDP as one of the components of economic factor is significantly correlated with logistics performance
even though the coefficient of correlation is small. Puertas, et al. (2013) use GDP as one of the parameters along with LPI and others as factors affecting a countries trade flows. The rational reason to explain this variable is GDP which represent the investment, trade flow and consumption of the country. High GDP is as a result of some factor such as high investment, high consumption, high government spending and high surplus trade balance. The first and fourth factors are related to the country logistics. The investment on logistic sector will improve the countries logistics performance while the high value of trade between countries indicates the goodness of logistics quality of a country
• Time to Export
Time to export is the time needed to export goods measure in days. The time calculation for a procedure starts from the moment it is initiated and runs until it is completed. The relation between this variable to logistics performance is clear if a country have less time to export value. This means that the ease and the efficiency of that country are better and vice versa. Arvis et al. (2010) shows that time is one of the key element to measure logistics performance by proposing timeliness as the measurement indicator of service time.
• Cost to Export per Container
Cost to export represents all the fees associated with completing the procedures to export or import the goods. These include costs for documents, administrative fees for customs clearance, technical control, customs broker fees, terminal handling charges and inland transport. Hausman et al. (2005) states that the outcome on the use of cost as an indicator to measure logistics index shows the relations between cost and logistics performance appearing to be negative. This means that the lower the cost to export the more efficient the logistics performance.
• Transport service export value
This indicator represents the transport service exported in a country, reflects on how the logistics company works in the transportation services. Lai, et al (2002) measure the supply chain performance in transport logistics which focus on the efficiency and effectiveness of logistics or transport service providers. The logistics performance will be positive when this indicator has higher export value and high LPI score as well.
Social Factors
• Control of Corruption
Gunner, et al. (2012) shows that political risk being one of the indicators to represent social factor has a strong correlation to logistics performance which is represented by LPI. This study shows that not only economic and infrastructure factor affects countries LPI but also the social factor. Control of corruption is one of the indicators of political risk index. As a rational reason, the control of corruption in a country represents how well conducive the business environment and the ease of business regulation in that country would become. A good score of this indicator means the government supports it and therefore will ease the smooth running of an efficient logistics activity.
• Document to export
This indicator shows that all the number of documents required per shipment to export goods are recorded. This indicator reflect the ease of regulation and also the efficiency of customs in that country. The more the number of document required for export, the more inefficient the logistics performance become thus the relation between these indicators with logistics performance becomes negative. Arvis et al. (2010) in their research used this indicator as one of the assessment criteria to measure the effectiveness of customs policy in a country.
• Unemployment number of total labor
This indicator represents the number of unemployment compared to total labor in a country. The number of unemployment might be represented as the socio - economic condition of a country. The higher number of unemployment indicates that the business environment is not conducive because people will tend to get a job from anywhere especially in the informal sector and this can trigger illegal charges in the business activity in terms of logistics and as well might increase the cost. Kaliba et al. (2012) show that unconducive macro business environment acts as a negative input to the business process and logistics is one of the main activity in doing business.
• Customs clearance time without physical inspection
This indicator measures the average time to pass goods through customs so that they can enter or leave the country. A document given by customs to a shipper shows that the customs duty has been paid and the goods can be shipped without physically inspecting the goods. Arvis et al. (2010) in their research used this indicator as one of the assessment criteria to customs efficiency and logistics service time.
Infrastructure Factors • Road fatalities
The road fatalities is one of the indicators for logistics infrastructure as it shows the number of road accidents which ends up with fatal injury or death of the victims. Even though the number only represents a small percentage of total road accident, but yet still this data can be used as surrogate to represent that. When accident happens, it will cause congestion in the road where the congestion will extend the time and cost of travel thereby affecting the countries LPI as a domino effect. Therefore, high rate of road fatalities in a country shows that it has a poor infrastructure and regulation, hence leads to congestion, uncertainty and an increase of travel time. It is also mentioned by Goh and Ang, (2000) who made a study about the reality of logistics in Indochina area that for least developed and developing country, one of the greatest obstacle to logistics growth is the poor state of their basic infrastructure. There are several aspects which represent logistics infrastructure like airport, port, and road transportation. • Quality of port
Quality of port represents the country’s port infrastructure quality level and it is clear that the quality of port infrastructure indication is determined by its logistics performance. Port as one of a component of logistics infrastructure as Goh and Ang (2000) mentioned in their research that it is a vital aspect to logistics developments. As for the least and developing countries, their main obstacles to logistic developments is the basic infrastructure. The rationale behind this reasoning is the about 90% shipment of goods in the world uses ships and therefore the better the quality of the port infrastructure, the more efficient and faster the logistics activity becomes. The quality of Port infrastructure therefore is an important entity for a country if it wants to improve its logistic performance.
• Air transport freight
Based on Goh and Ling (2003) who describe that air transport is one of the factors to country logistics development. This indicator shows the volume of freight, express, and diplomatic bags carried on each flight stage (operation of an aircraft from takeoff to its next landing), measured in metric tons by kilometers traveled. It reflects the air transportation of a country and the higher number of this indicator shows that the air transport performance of that country is good.
• Internet users/100 people
In this information and technology era, the role of internet becomes vital for economic development in general and logistics performance in particular in terms of global supply chain where the logistics activity is done and connected from different countries around the world. The indicator reflects the quality of telecommunication infrastructure. Higher ratio of internet users in one country is an indication of a good telecommunication infrastructure and logistics performance. Goh and Ling (2003) also describe that telecommunication infrastructure has a role to play in logistics developments in China.
• Fixed broadband internet subscriber
Similar with internet user, this indicators also represents the quality of telecommunication infrastructure but tends to be more specific to fixed broadband service for logistics activity especially in global supply chain for connectivity purpose. It is necessary to have a broadband connection to build a reliable connectivity. Based on Goh and Ang (2000) telecommunication infrastructure is necessary to logistics development in developing country in south china region. The relation between this indicator and the logistics performance is positive meaning more number of this indicators will affect the increment of logistics performance.
• Mobile telephone subscriptions/100ppl
This indicator also reflects the telecommunication infrastructure by supporting logistics activities especially in global supply chain in order to have a reliable connectivity. Both studies from Goh and Ang (2000) and Goh and Ling (2003) emphasize the role of telecommunication infrastructure in logistics sector development. The relation between this indicator and the logistics performance is positive, meaning the more number of this indicators will affect the increment of logistics performance. 3.3 Data Collection
The data used in this study is a secondary data and obtained indirectly through an intermediary medium. Secondary data is usually in the form of historical reports that have been arranged in the archives as (documentary data) either published or unpublished. This study only uses secondary data which can be either the index or the value of certain aspects that describes the condition of a country.
In order to build a comprehensive dataset to identify the factors that will be used to predict the LPI score would require a data collection of several sources such as:
LPI score from year 2007, 2010, 2012, and 2014
World development index (WDI) developed by the World Bank − Economic sector (GDP, Growth rate, Export-Import volume, etc)
− Infrastructure sector (Road density, Road fatalities, internet users, quality of port, etc.)
− Private sector (lead-time to export/import, number of document, number of tax payment, etc.)
Political Risks Index (PRS)
Global Competitiveness Index (GCI)
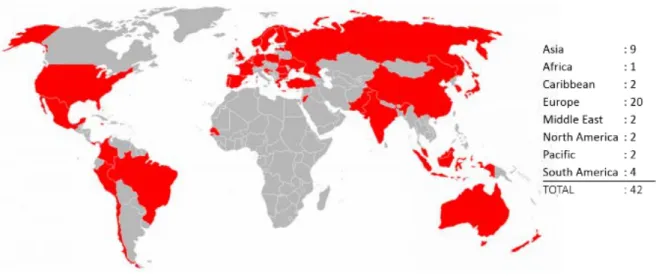
Figure 2 Country included in this study
The population in this study is the country which has LPI score and the total population consist of around 150 countries (see Figure 2). The picture of figure 2 below depicts the countries included in the research marked in area as red. Data is key to the determine the inclusion of a country in the study and for most of the African countries and the underdeveloped ones are being excluded due to lack of the availability of data. This also applies to countries in conflicts in order to avoid the outlier dataset being included in the model. As a result, a complete dataset consisting of selected 42 countries representing developing and developed countries from each continent is proposed.
CHAPTER 4. ESTIMATION RESULT AND DATA ANALYSIS
4.1 LPI Component Prediction
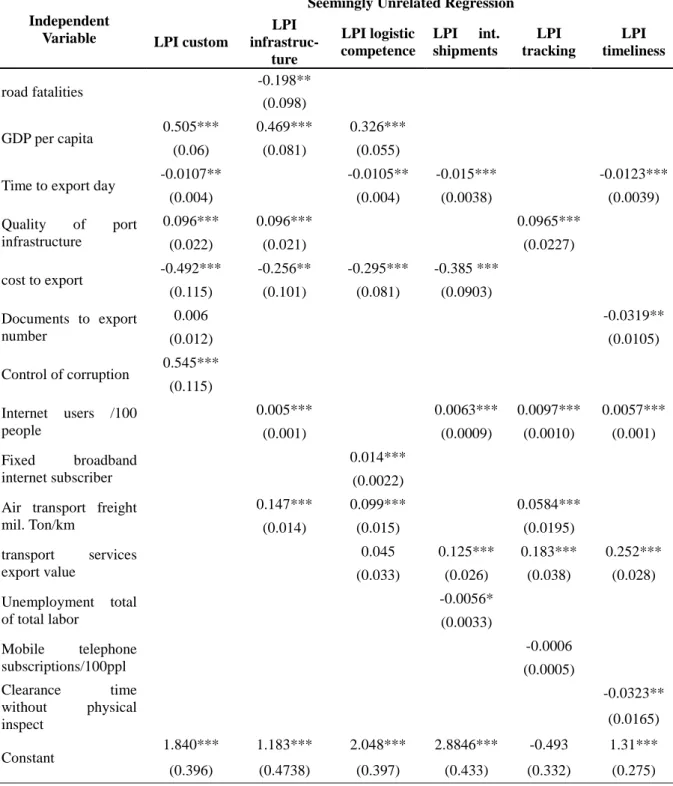
As proposed in the previous chapter that once the indicators have been identified, and the model to predict LPI component are conducted, the result of this SUR model is showed in Table 3. Each equation in this model have 168 observation from 42 country sample multiply with four years of observation data. The table below shows that almost all of the indicators are statistically significant to their dependent variables, the un-significant indicators are document to export on LPI customs, transport service export value on LPI logistic competence, and mobile phone subscription on LPI tracking and tracing.
There is some assumption need to fulfill when apply SUR model, one of the assumption is, there should be no autocorrelation in the equation, therefore the Durbin-Watson test is conduct and the result shows there is no autocorrelation in the equations Taking from Durbin Watsons test results which was conducted earlier on reveals the nonexistence of autocorrelation in the equation. This is because the D-W value for LPI customs, LPI Infrastructure and LPI logistics competence are 2.135, 2.025, and 1.903 respectively. The value of upper bond (du) and lower bond (dl) for n=168 and k=6 are 1.550 and 1.803 respectively. Therefore, there is no autocorrelation in these three models and the correlation residuals for each models also shows that error correlation between equations are exist.
GDP per capita and cost to export are two indicator that includes in all of three LPI input category, GDP per capita have a quite constant coefficient for each dependent variables which means that the effect of this indicator is slightly the same to LPI input category components. Meanwhile, cost to export have a quite different coefficient value as shown in Table 3. This indicator affecting LPI customs more than the other dependent variables, with coefficient (-0.492), it indicates the cost reduction or improvement on policy might affect more to LPI customs, than infrastructure and logistics competence.
Table 4 SUR model result for LPI component
Independent Variable
Seemingly Unrelated Regression LPI custom LPI infrastruc-ture LPI logistic competence LPI int. shipments LPI tracking LPI timeliness road fatalities -0.198** (0.098) GDP per capita 0.505*** 0.469*** 0.326*** (0.06) (0.081) (0.055)
Time to export day -0.0107** -0.0105** -0.015*** -0.0123***
(0.004) (0.004) (0.0038) (0.0039) Quality of port infrastructure 0.096*** 0.096*** 0.0965*** (0.022) (0.021) (0.0227) cost to export -0.492*** -0.256** -0.295*** -0.385 *** (0.115) (0.101) (0.081) (0.0903) Documents to export number 0.006 -0.0319** (0.012) (0.0105) Control of corruption 0.545*** (0.115) Internet users /100 people 0.005*** 0.0063*** 0.0097*** 0.0057*** (0.001) (0.0009) (0.0010) (0.001) Fixed broadband internet subscriber 0.014*** (0.0022) Air transport freight
mil. Ton/km 0.147*** 0.099*** 0.0584*** (0.014) (0.015) (0.0195) transport services export value 0.045 0.125*** 0.183*** 0.252*** (0.033) (0.026) (0.038) (0.028) Unemployment total of total labor -0.0056* (0.0033) Mobile telephone subscriptions/100ppl -0.0006 (0.0005) Clearance time without physical inspect -0.0323** (0.0165) Constant 1.840*** 1.183*** 2.048*** 2.8846*** -0.493 1.31*** (0.396) (0.4738) (0.397) (0.433) (0.332) (0.275) Note: Standard error are shown in parentheses.
LPI custom: observation = 168; log likelihood = -4.919 ; D-W = 2.135; LPI Infrastructure: observation = 168; log likelihood = 1.6821; D-W = 2.025. LPI logistics comp: observation = 168; log likelihood = 7.846; D-W = 1.903.
LPI int. shipping: observation = 168; log likelihood = 21.662; ; D-W = 1.7367 *** p < 0.01 LPI tracking: observation = 168; log likelihood = -5.9088; ; D-W = 1.8018 ** p < 0.05 LPI timeliness: observation = 168; log likelihood = 9.5920; D-W = 1.7645; * p < 0.1
Transport service export value and internet users are two indicator that includes in all of three LPI outcomes category, it is can be explained because LPI outcomes category represents logistics service performance and transport service export is the indicator that reflect the logistics service in that country because the main activity of logistics is transferring goods. This indicators is affecting each LPI component in positive sign and tend to have same coefficient. While internet users is affecting LPI tracking more than the other LPI component, this explain that the better internet network coverage will help country to increase their logistics quality in terms of tracking and tracing quality.
The comprehensive analysis of each LPI component and how the indicators affecting it is described below, while the detail information about the coefficient and standard error for each indicator can be seen on Table 4. The descriptions are:
• LPI customs
Indicators that affecting this LPI component are GDP per capita, time to export, quality of port infrastructure, and control of corruption. GDP per capita represent the average income. In terms of customs quality, high GDP shows the goodness of the trade flow in the country supported by an efficient custom policy. Time to export indicator measures the time from which an export procedure starts from the moment it is initiated and runs until it is completed including the time related to customs procedures. The indicator might as well reflects the efficiency of customs procedures.
Quality of port deals with the port infrastructure quality which is also necessary to support the customs regulation and a well develop infrastructure will enhance the possibility of applying an efficient and flexible custom regulations. Cost to export indicator (cost in the indicator) includes all of the cost related to custom administration and therefore time and cost are key factors that represents the customs efficiency. For social aspect, control of corruption is also highly related. In many developing countries and for which their customs efficiency is hampered by widespread corruption thereby creating a major obstacle to trade expansion and logistics performance.
• LPI Infrastructure,
The indicators that affecting it are road fatalities, GDP per capita, quality of port, cost to export, internet users/100 people, and air transport freight. Road fatalities indicator represents the land transport infrastructure quality. Quality of port infrastructure is measure to logistics infrastructure quality for sea port where most of the international trading activities are conducted, while air transport freight might reflect the air transport infrastructure quality, and Internet users/100 people shows the information and communication technology
infrastructure development as one of supporting aspect of logistics activities. GDP per capita represents the income of a country and the financial capability to develop their logistics infrastructure.
• LPI logistic competence
This measures competence and quality of logistics services which affecting by transport service export value, time to export, cost to export, fixed broadband internet user, and air transport freight. Transport service export value is represent the quality of logistics service provider in a country, where time and cost to export were also measure the time and cost for logistics service providers company to do export procedure. Fixed broadband internet
• LPI international shipment
Indicators affecting the LPI international shipment are time to export, the number of unemployment, internet user per 100 people, cost to export and transport service export value. Cost to export is an indicator that is highly related to LPI international shipping where it’s (i.e. the LPI) component is used for arranging competitively priced shipment and hence cost to export indicator enhances the measurement the components. Time to export is also related to the LPI component. This is because time and cost are related in the positive way and the longer the time, the more cost will increase.
• LPI tracking and tracing
The variable affecting the LPI tracking and tracing are Internet users, mobile subscribers, transport service export value and quality of port. Mobile subscribers and Internet users represents the Telecommunication infrastructure which is an important factor for tracking and tracing quality. Quality of port is related to tracking and tracing at some point in terms ability as a well-developed port should have a real time monitoring system so that tracking of shipments can be easily handled.
• LPI timeliness,
This LPI component is affected by time to export, clearance time without physical inspection, internet users, transport service export value and documents for exportation. The time to export and clearance time without physical inspection are both indicators of time in which their LPI component measures the expected and frequency that the shipment will arrive as scheduled. Document to export represents the time of the export activity and each of the component are directly proportional to each other (i.e. document and time). This depicts that if more documents is need for the exportation process, then it will also affect the time factors as it will also increase.
4.2 Case Study on “How Indonesia Performs?”
As witnessed from the earlier discussions, from the SUR model indicators affecting the LPI are been identified, Relations between LPI components and indicators were also discussed. Next is the Case study analysis about Indonesia was conducted using the result from SUR model. The logic behind choosing Indonesia as the suitable case for this study is that it is one of the biggest archipelagic country in the world that is strategically located which crossed by the international shipment track. Although is a developing country affected with the lack of certain inputs to meet the logistic standard as compared to develop nations. It is therefore important for Indonesia to improve its logistics to connect both domestic and international trading as in line with the international standards. A comparison analysis with competitor countries will also be conducted to analyze Indonesia’s logistic performance.
Overall, Indonesia’s performance based on the indicators is not good compared to its competitor countries as this is reflected in Figure 3 that compares the six LPI components performance. It shows that Indonesia has the lowest score in almost all the six LPI components. It is a challenge that Indonesia have to overcome in order to improve its logistics quality and be an active competitor to other countries. Countries like India, Malaysia and China were chosen to be the best developing nations of quality logistic service providers for their logistic sectors and they can be used as good examples of success stories to develop a logistic sector.
A head to head comparison is conducted to identify the strengths and weaknesses of Indonesia’s logistics quality using results from the SUR model. An explanation about performance of each LPI component is conducted as well as the comparisons of indicators that affecting the LPI components between Indonesia and other competitor countries such as India, Malaysia and China.
Figure 3 Comparison of Indonesia’s logistics performance and competitor country, Source:lpi.worldbank.org
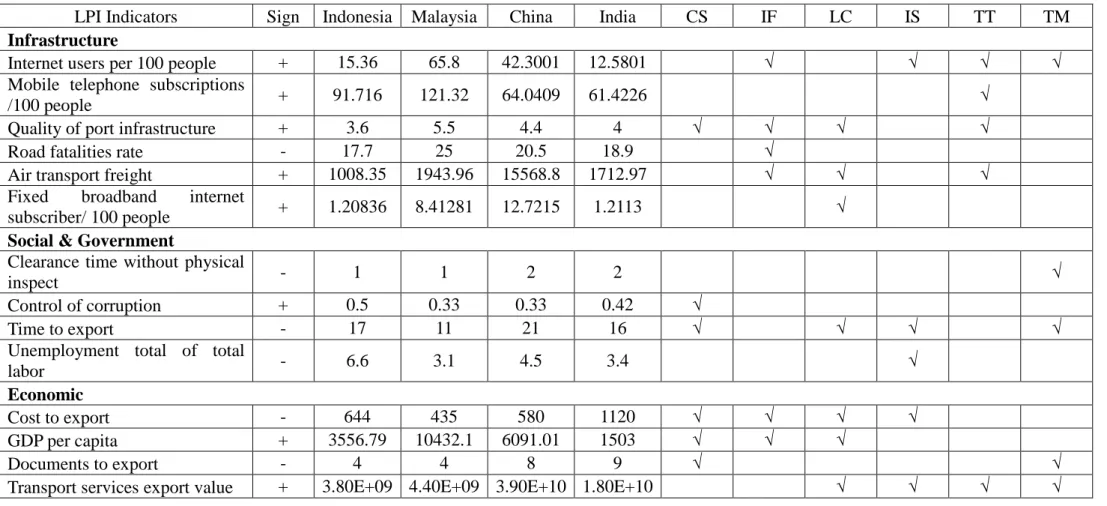
Table 5 describe the indicator comparisons of Indonesia against China, Malaysia and India. The table also describes which LPI components are affected by the indicators. The indicators were mapped into three categories namely Infrastructure, Economy, Social and Government. Unlike the LPI component where Indonesia is outperformed in every aspect, but there are some cases where it might have performed better than the competitor. This can be based on the indicator where head to head comparison is conducted, Indonesia might have some indicators better than its competitor even though in overall the competitors are still better.
Table 5 Comparison between LPI Indicator and relation to LPI component
CS = LPI customs; IF = LPI infrastructure; LC = LPI logistic competence; IS = LPI International Shipment; TT= LPI tracking & Tracing; TM = LPI Timeliness
LPI Indicators Sign Indonesia Malaysia China India CS IF LC IS TT TM
Infrastructure
Internet users per 100 people + 15.36 65.8 42.3001 12.5801 √ √ √ √
Mobile telephone subscriptions
/100 people + 91.716 121.32 64.0409 61.4226 √
Quality of port infrastructure + 3.6 5.5 4.4 4 √ √ √ √
Road fatalities rate - 17.7 25 20.5 18.9 √
Air transport freight + 1008.35 1943.96 15568.8 1712.97 √ √ √
Fixed broadband internet
subscriber/ 100 people + 1.20836 8.41281 12.7215 1.2113 √
Social & Government
Clearance time without physical
inspect - 1 1 2 2 √
Control of corruption + 0.5 0.33 0.33 0.42 √
Time to export - 17 11 21 16 √ √ √ √
Unemployment total of total
labor - 6.6 3.1 4.5 3.4 √
Economic
Cost to export - 644 435 580 1120 √ √ √ √
GDP per capita + 3556.79 10432.1 6091.01 1503 √ √ √
Documents to export - 4 4 8 9 √ √
• Indonesia – China
As shown from the figure 3 highlights that the performance gap between Indonesia and China is significant especially in the LPI infrastructure and using of the indicators as well. This could be one of the reasons why China performed better than Indonesia. From the indicator comparison in Table 5, it is clear that China on the overall outperform Indonesia in infrastructure indicators and Indonesia is only better at road fatalities, one of possible reason is because the large number of registered vehicles in China. According to China Ministry of Public Security, China had 120 million car registrations in 2012, compared to Indonesia that only had 10.5 million unit. Like any other developing country, the behavior of a driver is still not fully aware of the safety specifically motorcycle riders and a high number of traffic regulation violations due to the light traffic fines. The outcome of these factors results in high rate of road fatalities in China.
The logistics development in China is pushed by three main forces that are changing and advancing China’s distribution and logistics system. These are the booming economy, entering the WTO and e-commerce. The common characteristic of all these forces are tearing down of the walls facing distribution and logistics, this idea is proposed by Jiang and Prater (2002). One of the indicator is the average economic growth that reaches 10% per year while that of Indonesia is at 5-6% per year. This condition enhances the government of China to massively generate a lot of money to develop its logistic infrastructure. During the five-year plan 2001-2005 significant transport infrastructure has been built including 250,000 kilometer highways and 24,700 kilometer expressways (Waters, 2007). The average increase in length of new roads in china is 7000 kilometers per year while that of Indonesia is 70 kilometers per year, and thus left a huge gap which shows that china is more capable to develop logistics infrastructure than Indonesia.
In others LPI components such as LPI customs indicates that Indonesia is better than China in terms of control of corruption, time to export and document to export. Although these variables might not be that significant compared to other predictors like cost to export, GDP per capita and quality of the port of which China outperformed Indonesia.
For outcome category measures the performance of country’s logistics quality in terms of time, cost, and its reliability and for the case of China which have policy in
place to protect its national companies. Even though they have liberalize their policy but the international third party logistics companies are pushed to cooperate with the local ones. So this policy make logistics companies in china to grow and this will create competition among logistic companies on the other hand thereby pushing them to reduce the cost and provide a reliable service. Meanwhile for timeliness, there is not much difference between Indonesia and china even though Indonesia is better in time to export, number of document, and clearance time without physical inspection but yet still lags far behind China in the transport service export value where china’s export is ten times more than that of Indonesia’s export value. This indicator represents the number of transport service companies in a country.
• Indonesia – India
India in terms of logistics performance is the closest competitor to Indonesia as shown on figure 3 illustration. Indonesia is slightly below India in some LPI components especially in LPI input categories like customs, infrastructure and logistics competence. For the infrastructural aspect, Indonesia is slightly better at internet user ratio, cost to export, and road fatalities while India performs better on port infrastructure quality and air transport freight. In terms of international trade, most of the export import activity were done at the sea port and some via airport and for comparison in that case India edges Indonesia overall. It can be seen from the economic aspect in terms of infrastructure development, both country have similar state and also in terms of investment on infrastructure compared to GDP, both country have a 5-6% ratio. Indonesia despite of its high GDP per capita compared to India, still falls short almost four times below that of India’s GDP(i.e four times more than that of Indonesia). This phenomena is as a result of India’s larger population. The difference in GDP value is that of the investment on infrastructure value is high on the side of India than Indonesia and therefore India performs better in LPI infrastructure than Indonesia.
For LPI customs overall Indonesia is outperformed by India based on the indicator performance. From the six affected LPI customs, Indonesia is better at four of the indicators (i.e. Cost to export, GDP per capita, document to export, and control of corruption) while India is better at time to export and port infrastructure quality. Based on LPI customs performance, India is slightly better than Indonesia. This is subject to explanation that there might be some error on LPI measurement. As mentioned in
Arvis, et al (2010) LPI report that measurement average of confidence interval on the scale 1–5 is 0.22 or about 7.5 percent of the average country’s LPI score or equivalent to 10 places in the LPI ranking. They therefore suggest that it is necessary to be cautious in interpreting small differences in LPI scores and rankings and this might be the reason why India performs better than Indonesia of the LPI customs. But on the other hand, the indicators affecting the LPI customs displays the opposite even though the differences shows that Indonesia is only slightly better India.
In terms of logistics competence where measures the logistics service quality and competence, India is better than Indonesia in almost indicator except cost to export and GDP per capita. This consistent with the LPI survey where India performs better. The other factors which affecting logistics competence where India performs better are port infrastructure quality, air transport freight, fixed broadband internet subscriber, and transport service export value. The biggest gap is on transport service export value where India export value is four times Indonesia, and next indicator that have a wide gap is air transport freight where India almost double the value of Indonesia air transport freight.
India and Indonesia in terms of LPI outcomes category are quite the same. Based on LPI survey for outcome components as can be seen in figure 3 that there is no significant difference between India and Indonesia. For LPI international shipment, timeliness, and tracking and tracing where the outcomes of logistics service quality were measured, Indonesia is better in cost to export while India is better in time to export. In India, it is required of 9 procedures to export while Indonesia is only 4 but overall its only 1 day difference between times needed to export in India and Indonesia. This shows that Indonesia’s procedure is easier but does not significantly reduce the time required to perform the export process. This condition may happen because of the international trade in Indonesia is concentrated in Tanjung Priok sea port where reach its maximum capacity based on Indonesia ministry of transportation. For tracking and tracing where telecommunication infrastructure plays an important role as supporting aspect of logistics service, both countries are still in the development phase to improve their coverage and quality.
• Indonesia – Malaysia
Compared to the LPI of Malaysia and Indonesia, Malaysia still outperform Indonesia in every LPI components. Malaysia’s performance is equal with china where
the logistics infrastructure is quite well developed, easier customs procedure and more reliable logistics service. For LPI input category like LPI infrastructure, customs, and logistics competence, this is the area where the biggest gap occurs between these two countries as shown in figure 3. Based on the indicator from Table 5, it is clear that for the indicators affecting LPI infrastructure, Malaysia beats Indonesia in every variable except road fatalities. This exception is most likely because Indonesia might have not recorded the accidents as detailed as Malaysia did. Take for instance an accidents that occurs in remote areas in Indonesia which were probably missed from being recorded. The other indicator that represents the air and water transport also shows that Malaysia is better than Indonesia.
From the economic and social indicators, it also shows that Malaysia outperform Indonesia in most of the indicators. GDP per capita and cost to export were affecting most of LPI input category shows Malaysia on the better side and transport service export value which affects most of LPI outcome category also shows that Malaysia is better than Indonesia. For LPI customs, the indicators affecting it shows that Malaysia also outperform Indonesia except in control of corruption for which the indicator alone cannot make Indonesia’s performance better than that of Malaysia as its customs procedure is more efficient compared to that of Indonesia Economic development which might have been represented by high GDP per capita in Malaysia is also one of the affecting factors of the logistics infrastructure to become well developed.
It is clearly shown in the LPI outcome category that Indonesia is still below Malaysia in terms of Cost, time and reliability of logistic services that is represented by the LPI outcome category. (i.e International shipment, timeliness, and tracking and tracing). Some of the key indicators that affects the LPI outcome components like time, cost to export, transport service export value and internet users ratio have shown that Malaysia performs better than Indonesia.
Based on Malaysia’s industrial master plan which recognizes the significance of logistic sectors towards the enhancement of Malaysia’s progress in industrialization and international trade. The role and importance of the logistics industry has been officially mentioned and highlighted in the Third Industrial Master Plan (2006-2020). The targets underlined by the government includes the achievement of overall growth of 8.6% by the year 2020. Indonesia on the other hand also have similar policy to stimulate the logistics development which is stated in the National Logistics Systems
(SISLOGNAS) enacted in 2007 and also a Master Plan for the Acceleration and Expansion of Economic Development of Indonesia (MP3EI) has been developed where one of the aim of the master plan is to improve the connectivity within the country as well as to develop and utilize the alternative international port to facilitate international trading in Indonesia.
4.3 Logistics Indicator Improvement Tracking
As mentioned in previous chapter that this research were done to overcome some problem about countries logistics performance index which conducted by the World Bank. One of the reason it is necessary to evaluate the measurement that conducted by World Bank is because it is subjective, need huge effort, and it is difficult to track the impact of improvement in logistics indicator to LPI score. The first two points are already overcome by this model where logistics quality is measured by objective predictor from several resources. Thus this section will discuss about the third point where this research has to be able to track the impact of indicator improvement to country logistics performance score.
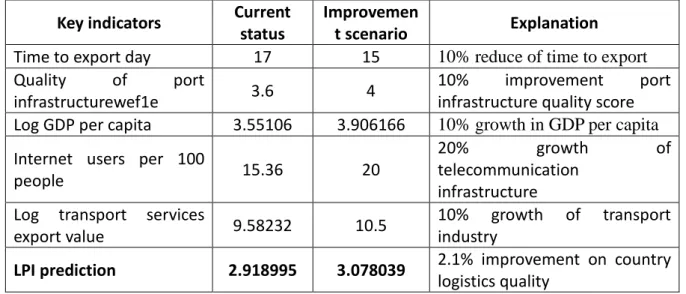
Table 6 Indicators improvement scenario and the impact to LPI Key indicators Current status Improvement scenario Explanation
Time to export day 17 15 10% reduce of time to export
Quality of port
infrastructurewef1e 3.6 4 10% improvement port infrastructure quality score Log GDP per capita 3.55106 3.906166 10% growth in GDP per capita Internet users per 100
people 15.36 20
20% growth of telecommunication
infrastructure Log transport services
export value 9.58232 10.5 10% growth of transport industry
LPI prediction 2.918995 3.078039 2.1% improvement on country logistics quality To track the effect of improvement on logistics indicators, some key indicators were choose based on the result of SUR model from the previous chapter. Time to export, quality of port, GDP per capita, internet users, and transport service export value are the indicators that chosen in the scenario, and also because these indicator include in government authority so government can encourage an improvement in these area. Based on the improvement scenario in Table 6, it shows that developing these indicators might
CHAPTER 5. DISCUSSION AND CONCLUSION
5.1 Discussion
Logistics is termed as one of the most important factor for country’s competitiveness factors and the LPI is represented as the quality of logistics in a country. Analysis have shown that the social, economic, and infrastructure factor are related to a country’s logistics performance and the indicator from each factors can be used to measure the LPI components. The indicators from social and government factors are control of corruption and number of documents to export. As for the economic aspect, the indicators are GDP per capita, cost to export, time to export, and transport service export value and the infrastructure indicators are road fatalities, internet user/100 people, fixed broadband internet subscriber, air transport freight, and quality of port. These indicator are used to predict a country’s logistics performance.
LPI measures countries logistics quality thereby it is necessary to discuss about the role of government to improve logistics performance. From the result of SUR model it can be seen that some of the indicators are the areas where the government has the authority to make improvements whether it is direct or indirect. For infrastructure factors road fatalities and quality of port are the indicators where government has direct authority to do improvement while for telecommunication infrastructure indicators and air transport freight government can encourage the improvement trough their state-owned companies that engaged in that area. In social and government aspect custom clearance time, control of corruption, time to export, and number of unemployment. Lastly in economic aspect the indicator that include in government authority is document to export and cost to export, for the second indicator government has indirect role to improve it. Since the infrastructure and economic indicators appear to be the most significant to countries logistics performance thus the improvement in these area is recommended to boost the logistics quality.
Indonesia did some effort to improve some of these indicators, from enact the blue print of national logistics development as stated in SISLOGNAS and also in the master plan to accelerate economy in Indonesia (MP3EI). One of the improvement is to reduce their time to export, Indonesia in 2011, try to reduce dwell time on Tanjung Priok’s port which is the busiest port in Indonesia where almost 70% of export-import activity happen, by raised storage fees (to discourage shippers from leaving containers for long periods) and
introduced a new information technology system (to better monitor and direct port traffic). Beside that they also scheduled expansion of the port is expected to double its container capacity by 2017.
5.2 Conclusion
From LPI measurement framework, LPI component were map into two main categories namely the input and the outcome. The input components are LPI customs, infrastructure, and logistics competence where the quality of port, air transport freight and GDP per capita. Cost and time to export appears to be critical indicators for input category affecting at least two LPI components. On the other hand LPI outcome categories such as international shipment, timeliness, tracking and tracing the critical indicators affecting these categories are internet users, time to export, and transport service export value. From the results above it can be conclude that infrastructure and economic factors play an important role to a country logistics performance because the indicator from these factors were significantly affecting logistics performance.
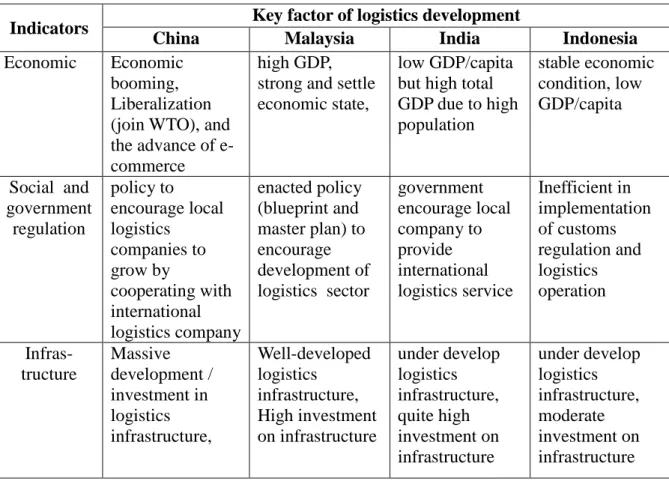
Table 7 Summary of countries logistics performance factors
Indicators Key factor of logistics development
China Malaysia India Indonesia
Economic Economic booming, Liberalization (join WTO), and the advance of e-commerce
high GDP, strong and settle economic state,
low GDP/capita but high total GDP due to high population stable economic condition, low GDP/capita Social and government regulation policy to encourage local logistics companies to grow by cooperating with international logistics company enacted policy (blueprint and master plan) to encourage development of logistics sector government encourage local company to provide international logistics service Inefficient in implementation of customs regulation and logistics operation Infras-tructure Massive development / investment in logistics infrastructure, Well-developed logistics infrastructure, High investment on infrastructure under develop logistics infrastructure, quite high investment on infrastructure under develop logistics infrastructure, moderate investment on infrastructure
Indonesia compared to other neighboring competitor countries is still behind in terms of LPI score and critical factors affecting it. Take for instance the case of China