DOI: 10.1002/adfm.200500901
Orange and Red Organic Light-Emitting Devices Employing
Neutral Ru(
II
) Emitters: Rational Design and Prospects for Color
Tuning**
By Yung-Liang Tung, Li-Shiuan Chen, Yun Chi,* Pi-Tai Chou,* Yi-Ming Cheng, Elise Y. Li,
Gene-Hsiang Lee, Ching-Fong Shu,* Fang-Iy Wu, and Arthur J. Carty*
1. Introduction
The development of new light-emitting materials has at-tracted great attention ever since the seminal study on organic
electroluminescent (EL) devices by Tang and Vanslyke.[1] Re-searchers have been quite optimistic that organic light-emitting devices (OLEDs) will eventually provide an alternative to inor-ganic light-emitting diodes (LEDs) and liquid crystal displays (LCDs), perhaps affording brighter and more flexible displays at a lower cost.[2] In this context, the fabrication of OLEDs with efficient and saturated red emission is quite essential.[3] This has been achieved in part by using third-row phosphores-cent dopant emitters, such as Os(II),[4] Ir(III),[5] and Pt(II),[6]
where the strong spin-orbit coupling effectively promotes sin-glet-to-triplet intersystem crossing, as well as enhances the sub-sequent transition from the triplet to the ground state. Theore-tically, OLEDs with 100 % internal quantum efficiencies could possibly be obtained by harnessing both the triplet and singlet excitons.[7]Despite these advantages, a major obstacle to the
commercialization of phosphorescent OLED technologies lies in the prohibitive cost of the noble metals. From a technologi-cal perspective, there is an urgent need to develop phosphores-cent emitting materials from less expensive precursors.
Amongst the numerous possible alternatives to precious metals that have been evaluated, the cationic tris-substituted Ru(II) bipyridine complex, [Ru(bpy)3]X2(where X is a
coun-terion such as ClO4–or BF4–, bpy: 2,2′-bipyridine), and its
func-tionalized derivatives have attracted much attention.[8] These Ru(II) complexes have been used in solid-state light-emitting
–
[*] Prof. Y. Chi, Dr. Y.-L. Tung, L.-S. Chen Department of Chemistry
National Tsing Hua University Hsinchu 300 (Taiwan) E-mail: [email protected]
Prof. P.-T. Chou, Dr. Y.-M. Cheng, E. Y. Li, G.-H. Lee Department of Chemistry and Instrumentation Center National Taiwan University
Taipei 106 (Taiwan) E-mail: [email protected] Prof. C.-F. Shu, F.-I. Wu Department of Applied Chemistry National Chiao Tung University Hsinchu 300 (Taiwan) E-mail: [email protected] Prof. A. J. Carty
Steacie Institute for Molecular Sciences National Research Council
Ottawa, ON K1A 0R6 (Canada) E-mail: [email protected]
[**] We acknowledge support from the following grants: 94-EC-17-A-08-S1-042, NSC 93-2113-M-007-012, and NSC 93-ET-7-007-003. Support-ing Information is available online from Wiley InterScience or from the author.
A new series of charge-neutral Ru(II) pyridyl and isoquinoline pyrazolate complexes, [Ru(bppz)2(PPh2Me)2] (bbpz:
3-tert-bu-tyl-5-pyridyl pyrazolate) (1), [Ru(fppz)2(PPh2Me)2] (fppz: 3-trifluoromethyl-5-pyridyl pyrazolate) (2), [Ru(ibpz)2(PPhMe2)2]
(ibpz: 3-tert-butyl-5-(1-isoquinolyl) pyrazolate) (3), [Ru(ibpz)2(PPh2Me)2] (4), [Ru(ifpz)2(PPh2Me)2] (ifpz:
3-trifluoromethyl-5-(1-isoquinolyl) pyrazolate) (5), [Ru(ibpz)2(dpp苷)] (dpp苷 represents cis-1,2-bis-(diphenylphosphino)ethene) (6), and
[Ru(ifpz)2(dpp苷)] (7), have been synthesized, and their structural, electrochemical, and photophysical properties have been
characterized. A comprehensive time-dependant density functional theory (TDDFT) approach has been used to assign the observed electronic transitions to specific frontier orbital configurations. A multilayer organic light-emitting device (OLED) using 24 wt % of 5 as the dopant emitter in a 4,4′-N,N′-dicarbazolyl-1,1′-biphenyl (CBP) host with 4,4′-bis[N-(1-naphthyl)-N-phenylamino]biphenyl (NPB) as the hole-transport layer exhibits saturated red emission with an external quantum efficiency (EQE) of 5.10 %, luminous efficiency of 5.74 cd A–1, and power efficiency of 2.62 lm W–1. The incorporation of a thin layer of poly(styrene sulfonate)-doped poly(3,4-ethylenedioxythiophene) (PEDOT) between indium tin oxide (ITO) and NPB gave anoptimized device with an EQE of 7.03 %, luminous efficiency of 8.02 cd A–1, and power efficiency of 2.74 lm W–1 at
20 mA cm–2. These values represent a breakthrough in the field of OLEDs using less expensive Ru(II) metal complexes. The
nonionic nature of the complexes as well as their high emission quantum efficiencies and short radiative lifetimes are believed to be the key factors enabling this unprecedented achievement. The prospects for color tuning based on Ru(II) complexes are
also discussed in light of some theoretical calculations.
P
electrochemical cells (LECs),[9]where the emissive layer con-tains an excess of mobile counterions and the charge injection is relatively independent of the nature of the contacts. As a re-sult, light emission occurs through electrochemical redox pro-cesses, but requires a relatively long response time to reach the steady-state radiance.[9]In contrast, the fabrication of related
polymer light-emitting devices (PLEDs) containing cationic Ru(II) dopant emitters has also been attempted,[10]and these
are characterized by instantaneous light output, as compared to the LECs. Unfortunately, these cationic Ru(II) complexes
are quite unsuitable for the fabrication of high-efficiency OLEDs using versatile vacuum deposition techniques. This can be mainly attributed to the poor volatility of these compounds, caused by their ionic nature, which leads to severe thermal deg-radation during evaporation. Furthermore, the ion-pair struc-ture hampers the charge-transport efficiency. As a result, these Ru(II)-based PLEDs show a significantly inferior
perfor-mance,[11] as compared to OLEDs doped with Os(II), Pt(II), and Ir(III) heavy-metal compounds.
This current situation makes the design and preparation of highly efficient Ru(II)-based emitters a daunting research
chal-lenge. In a recent short communication, we have unveiled our preliminary experimental data on the feasibility of fabricating an OLED based on a Ru(II) isoquinoline pyrazolate complex,
[Ru(ifpz)2(PPh2Me)2] (ifpz: 3-trifluoromethyl-5-(1-isoquinolyl)
pyrazolate).[12] However, identifying suitable analogues that
can be used for the fabrication of Ru(II) OLEDs is non trivial.
From a rational design perspective, the key to a suitable Ru(II) complex lies in the complete optimization of several crucial factors. A first requirement is that only charge-neutral Ru(II)
complexes can be used; this is because of the stringent volatility and charge mobility criteria that need to be fulfilled for fabri-cating OLEDs. Secondly, the weaker ligand field strength for the second row congeners leads inevitably to the use of strongly bonding bidentate ligands, so that both the stability and the spin-orbit coupling can be greatly enhanced for the Ru(II) complexes (as discussed later). Thirdly, strong-field
ancillary ligands, such as phosphines, are required to increase the energy gap of the metal centered d–d transition, so that the
radiationless deactivation associated with metal–metal and/or metal–ligand stretching vibrations can be significantly sup-pressed.[13]Last but not least, the relatively high oxidation po-tential of Ru(II) necessitates the strategic design of ligand
chro-mophores, particularly for color tuning, which is significantly different from established strategies for designing ligands for third-row transition metals (as discussed below).
In this study, we report the first comprehensive synthesis of seven charge-neutral Ru(II) pyridyl and isoquinoline
pyrazolate complexes, [Ru(bppz)2(PPh2Me)2] (bppz:
3-tert-bu-tyl-5-pyridyl pyrazolate) (1), [Ru(fppz)2(PPh2Me)2] (fppz:
3-trifluoromethyl-5-pyridyl pyrazolate) (2), [Ru(ibpz)2
(PPh-Me2)2] (ibpz: 3-tert-butyl-5-(1-isoquinolyl) pyrazolate) (3),
[Ru(ibpz)2(PPh2Me)2] (4), [Ru(ifpz)2(PPh2Me)2] (5),
[Ru(ibpz)2(dpp苷)] (dpp苷 represents
cis-1,2-bis-(diphenyl-phosphino)ethene (6), and [Ru(ifpz)2(dpp苷)] (7), the
struc-tures of which are depicted in Scheme 1.
We have investigated the basic electrochemical and photo-physical properties of these molecules and explored their feasi-bility for OLED applications. Moreover, we have carried out theoretical studies of these Ru(II) complexes, which provide
additional insight into their electronic transitions and the fron-tier orbital configurations involves in these transitions. The re-sults suggest a method for generating red light emission and uncover a surprising electronic aspect of the relative ligand ori-entation. Accordingly, we also discuss the fundamental basis for color tuning in OLEDs based on these Ru(II) complexes.
2. Results and Discussion
2.1. Synthesis and Structural Characterization
2-Pyridyl pyrazole-type ((pypz)H) chelate ligands can read-ily react with main group metal[14] and transition metal re-agents,[15] affording the corresponding chelate complexes in
high yields. A similar synthetic strategy has been utilized to prepare osmium-based complexes, such as [Os(CO)2(pypz)2],
by the direct treatment of the free ligand with Os3(CO)12in a
R' Ph R' Ph Ru P N N N R P N N N R R =tBu, (6) R = CF3, (7) Ru P N N N R P N N N R R =tBu, R' = Me, (3) R =tBu, R' = Ph, (4) R = CF3, R' = Ph, (5) Ru P P N N N R N N N R Ph2 Ph2 Ph Ph Ph Ph R =tBu, (1) R = CF3, (2)
Scheme 1. Relevant structural drawings for ruthenium complexes 1–7.
FULL
P
stainless-steel autoclave at high temperature.[16] The overall transformation can be written as
6 (pypz)H + Os3(CO)12→ 3 [Os(CO)2(pypz)2] + 3H2+ 6 CO (1)
Moreover, simply treating the formed complex with a decar-bonylation reagent, Me3NO, followed by the addition of
p-ac-cepting phosphorus donors, leads to the isolation of related metal complexes [Os(pypz)2L2] (L= PPh2Me and PPhMe2) in
moderate yields.[17]It is notable that these osmium complexes exhibit bright and tunable orange-red to red phosphorescence both in solution and in the solid state at room temperature. Ac-cordingly, these molecules can potentially be used as dopant emitters for practical OLED applications.
Attempts have been made to synthesize the second-row ru-thenium analogues of 1–7, the structures of which are shown in Scheme 1. The target Ru(II) emitting complexes have been
prepared by the reaction of Ru3(CO)12with 2-pyridyl or
1-iso-quinolyl pyrazoles, followed by treatment with a phosphine in the presence of Me3NO, giving complexes 1–5 in high
yields (> 60 %). Alternatively, a second approach involves the heating of the pyrazole ligand with the phosphine complex [Ru(CO)3(dpp苷)] in the presence of Me3NO, affording the
dpp苷-substituted light-emitting complexes 6 and 7 in good yields (ca. 60 %).
From a molecular design perspective, the introduction of dual pyrazolate anions neutralizes the 2+ charge on the central Ru(II) cation. Moreover, owing to the strong nucleophilic nature of the pyrazolate nitrogen, strong coordination to the ruthenium metal center is expected. It is notable that in the present work, the 2-pyridyl substituents in complexes 1 and 2 have been deliberately replaced by 1-isoquinolyl substituents, forming complexes 3–7, in an attempt to raise the typically low highest occupied molecular orbital (HOMO) energy level at the Ru(II) metal center, thereby generating the required
satu-rated red emission. Moreover, since the Franck–Condon fac-tors for nonradiative transitions are qualitatively proportional to the square of the bond displacement,[18]the enlarged
p-con-jugation of the isoquinoline motif (vs. that of the pyridyl group) should lead to minimal structural deformation between the ground and excited states, as well as reduce the thermal popu-lation of the upper d–d excited states that generally dominate the nonradiative deactivation. Such ligand modifications should thus improve the emission quantum yields.
These ruthenium metal complexes exhibit good solubility and thermal stability in typical organic solvents, as evidenced by the negligible degradation in both the solid and solution phase over a period of several weeks. The only exception is complex 1, which is originally orange in color, but turns dark green in CHCl3 solution after 1–2 h in air. Nevertheless, the
chemical stability of 1 could be enhanced by switching from chlorinated to nonchlorinated solvents. As a result, all NMR characterizations have been carried out in nonchlorinated sol-vents, such as deuterated benzene or acetone. Moreover, com-plexes 3 and 6 have been further characterized using single-crystal X-ray diffraction analysis to establish their exact 3D molecular architectures (Table 1).
Figure 1 shows the molecular structure of the prototypical complex 3. It is clear that the PPhMe2 ligands lie in the
ex-pected trans configuration, with the isoquinolyl pyrazolate che-lates occupying the remaining four planar positions around the central ruthenium atom. The Ru–N distances for these chelat-ing bonds are similar to those observed for related cationic Ru(II) diimine complexes (2.042–2.079 Å).[19] Conversely, the
Oak Ridge thermal ellipsoid plot (ORTEP) diagram of 6 re-veals a cis arrangement, as prescribed by the dpp苷 chelate (Fig. 2). The ibpz chromophores adopt an eclipsed orientation
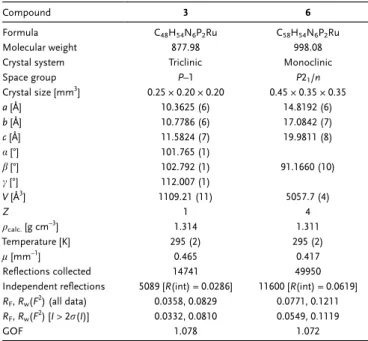
Table 1. Crystal data and refinement parameters for complexes 3 and 6.
Compound 3 6
Formula C48H54N6P2Ru C58H54N6P2Ru
Molecular weight 877.98 998.08
Crystal system Triclinic Monoclinic
Space group P–1 P21/n Crystal size [mm3] 0.25 × 0.20 × 0.20 0.45 × 0.35 × 0.35 a [Å] 10.3625 (6) 14.8192 (6) b [Å] 10.7786 (6) 17.0842 (7) c [Å] 11.5824 (7) 19.9811 (8) a[°] 101.765 (1) b[°] 102.792 (1) 91.1660 (10) c[°] 112.007 (1) V [Å3 ] 1109.21 (11) 5057.7 (4) Z 1 4 qcalc.[g cm–3] 1.314 1.311 Temperature [K] 295 (2) 295 (2) l[mm–1] 0.465 0.417 Reflections collected 14741 49950
Independent reflections 5089 [R(int) = 0.0286] 11600 [R(int) = 0.0619] RF,Rw(F2) (all data) 0.0358, 0.0829 0.0771, 0.1211
RF,Rw(F2) [I > 2r(I)] 0.0332, 0.0810 0.0549, 0.1119
GOF 1.078 1.072
Figure 1. Oak Ridge thermal ellipsoid plot (ORTEP) diagram of 3 with
thermal ellipsoids shown at the 25 % probability level; selected distances: Ru–N(1) = 2.0803(15) Å, Ru–N(2) = 2.0461(15) Å, and Ru–P(1) = 2.3240(5) Å; selected angles: N(1)–Ru–N(2) = 76.20(6)°, N(2)–Ru–P(1) = 89.88(5)°, and N(1)–Ru–P(1) = 89.21(4)°.
P
with both the pyrazolate nitrogen atoms N(2) and N(5) aligned trans to each other, and with the isoquinolyl nitrogen atoms N(1) and N(4) located trans to the chelating phosphorus atoms. This change of coordination geometry notably improves the Ru–P bonding, leading to a reduction of the average Ru–P dis-tance from 2.324 Å in 3 to 2.275 Å in 6; this also causes an in-crease of the Ru–N(isoquinoline) bond distance from
2.080 Å in 3 to a much greater value of 2.132 Å in 6, while leaving the trans-Ru–N(pyrazolate) distances essentially unaltered; 2.046 Å in 3 versus 2.059 Å in 6. This variation in bonding is presumably caused by the much greater trans effect of the p-accepting phos-phines. The weakened Ru–N(isoquinoline) bonding in 6 may induce relatively faster radiationless deacti-vation, as compared to the trans analogues described above, leading to a reduced phosphorescence quan-tum yield for the cis complexes.
2.2. Photophysical Measurements
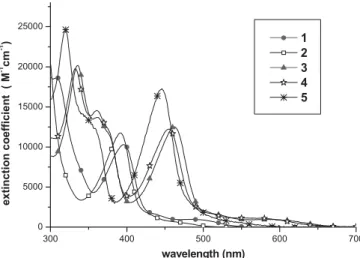
The photophysical properties of these ruthenium complexes can be systematically tuned by modifica-tion of the pyrazolate chromophores and the ancil-lary phosphine ligands; the relevant data is shown in Table 2. In the UV-vis spectrum of 1, the high-energy absorption bands at k≤ 360 nm arise from intraligand p–p* transitions (Fig. 3). The next lower energy band, with kmaxat 395 nm, can be assigned to singlet
metal–ligand charge transfer (MLCT), while the weak absorptions extending into the 443–493 nm re-gion are associated with spin-forbidden triplet p–p*
and MLCT transitions. The p–p* and MLCT transitions of 2 can be analogously assigned, showing a blue-shift because of the introduction of electron-withdrawing CF3substituents. For
the trans isoquinolyl complexes 3–5, the UV-vis spectra reveal strong absorption bands (e > 104M–1cm–1) in the≤ 380 nm re-gion, which can be reasonably assigned to spin-allowed1p–p* transitions in the ibpz (or ifpz) ligands. The next lower energy
1MLCT absorption band appears around 450 nm, while the
weak absorptions centered at 580 nm (e = 900 M–1cm–1), 566 nm (e = 1100 M–1cm–1), and 523 nm (e = 1000 M–1cm–1) for complexes 3–5, respectively, can reasonably be assigned to a mixed state involving both spin-orbit coupling enhanced3p–p* and3MLCT transitions. It is also notable that the CF3
substitu-ents in 5 not only cause a spectral blue-shift for the1p–p* and
1MLCT absorptions but also increase the transition moment.
At room temperature, in the solution phase, independent of the solvents used, these complexes show rather poor emission quantum yields, ranging from the nonemissive behavior of 2 and a very low value of 0.1 % for 1 to a highest value of 1 % for 5 (Table 2). This behavior is in sharp contrast to osmium(II)
an-alogues of these complexes, where bright phosphorescence emission can be clearly observed in the solution phase at room temperature.[17] This difference may arise from the lower ex-cited-state energy gap. Thus, rapid quenching may occur in so-lution, possibly incorporating internal conversions through large amplitude motions and collisional deactivation. In addi-tion, one should not neglect the relatively weaker bonding of the ligands to Ru(II), as compared to corresponding neutral Os(II) or Ir(III) complexes, which may result in a shallow
potential energy surface along the stretching motions of the Ru–ligand bond, and thus may trigger a fast radiationless
tran-Figure 2. ORTEP diagram of 6 with thermal ellipsoids shown at the 30 %
probability level with the phenyl substituents of the dpp苷 ligand repre-sented by their ipso-carbon for clarity; selected distances: Ru–N(1) = 2.136(2) Å, Ru–N(2) = 2.047(2) Å, Ru–N(4) = 2.128(2) Å, Ru–N(5) = 2.071(2) Å, Ru–P(1) = 2.2927(8) Å, and Ru–P(2) = 2.2575(9) Å; selected angles: N(1)–Ru–N(2) = 76.43(9)°, N(4)–Ru–N(5) = 75.79(9)°, N(2)–Ru– N(5) = 161.81(10)°, N(1)–Ru–P(2) = 173.27(7)°, N(4)–Ru–P(1) = 173.55(7)°, and P(2)–Ru–P(1) = 83.15(3)°.
Table 2. Photophysical and electrochemical properties for complexes 1–7.
UV-vis absorption; in CH2Cl2; [nm] (e) [a]
PL [a] kmax[nm]
U[a] sobs[ls] E1/2°x E1/2red
1 309 (18 600), 395 (10 300), 443 (1400),∼493 (900, br) — (568) — (0.001) — (0.16) 0.24 [b] 2 297 (21 800), 392 (11 700), ∼460 (700, br) — — [522, 650 (sh)] — — — — — [20.8] 0.19 [b] 3 336 (20 200), 363 (13 700), 462 (12 500),∼580 (900, br) 718 (709) — (0.02) — (1.06) 0.38 2.67 4 332 (19 800), 361 (14 600), 455 (12 200),∼566 (1100, br) 700 (683) [665] — (0.02) — — (0.64) [18.7] 0.33 2.64 5 320 (24 600), 353 (12 900), 446 (17 300),∼523 (1000, br) 636 (632) [620] 0.01 (0.24) — 0.10 (1.82) [6.5] 0.13 2.50 6 316 (23 200), 356 (19 700), 368 (20 000), 408 (9000), ∼470 (3900, br) 637 (609) [600] 0.08 (0.21) — 0.06 (2.1) [19.6] 0.23 2.60 7 307 (22 200), 345 (15 800), 359 (18 000), 390 (9600), ∼445 (3100, br) 596 (571, 589) [563, 594] 0.002 (0.02) — 0.02 (0.56) [37.8] 0.36 2.40
[a] Samples were degassed and measured in CH2Cl2solution at room temperature
with e inM–1cm–1. Data in parentheses are measured in the solid state at room
tem-perature while the data in square brackets has been measured in a frozen CH2Cl2
ma-trix at 77 K. [b] Data recorded in THF solution.
FULL
P
sition via the intercept (e.g., a conical interception) with the ground-state energy surface.[16]As for complexes 1 and 2, the reduction of p-conjugation on the pyridyl motif not only causes a large structural deformation between the ground and excited states, but also possibly increases the thermal population of the upper d–d excited states which dominate the nonradiative de-activation processes. The details are discussed in a subsequent section on theoretical calculations.
In sharp contrast, moderate to highly intense luminescence is observed for the isoquniolyl complexes when they are vacuum deposited as thin solid films; the kmaxfor the emission peak is
located at 709, 683, and 632 nm, respectively for complexes 3–5 (Fig. 4). The partial overlap between these emission signals and the lowest energy absorption bands, along with the ob-served broad, structureless spectral features, leads us to con-clude that the phosphorescence originates primarily from the
3MLCT state.[20]Moreover, in comparison to the PPhMe 2
an-chored complex 3, the PPh2Me derivative 4 exhibits an
ap-proximately 27 nm hypsochromic shift in kmax, which can be
qualitatively rationalized by the lowering of the Ru(II) dp
ener-gy level due to an increase in the p-accepting strength. For the ifpz complex 5, an even more notable hypsochromic shift of 50 nm is observed. This is apparently caused by the electron-withdrawing effect of the CF3substituents on the pyrazolate
li-gand, which further lowers the electron charge density on the Ru(II) metal center, consequently raising the MLCT energy
level. It is also noteworthy that the radiative lifetime of ap-proximately 7.58 ls deduced for 5 from the observed lifetime (1.82 ls) and the phosphorescence quantum yield (0.24, Table 2) is similar in magnitude to values previously reported for efficient red-emitting Ir(III) complexes.[21]This result
mani-fests the importance of using ibpz and ifpz ligands, which are able to greatly enhance the spin-orbit coupling, possibly due to the closer proximity between Ru(II) and the pyrazolate
chro-mophores.
To obtain additional insights, the UV-vis spectra of the cis complexes 6 and 7 have been recorded and are depicted in Figure 5. It is worth noting that although the higher energy in-traligand 1p–p absorptions at≤ 408 nm have almost the same intensity, the lower lying1MLCT transitions at 470 and 445 nm
for 6 and 7, respectively, show a significant decrease in signal intensity and also exhibit extensive spectral overlaps with the triplet p–p* and MLCT transitions. The reduction of the
1MLCT transition moment is tentatively ascribed to the
cis-ar-ranged, stronger p-accepting dpp苷 ligand, which significantly lowers the relative electron density at the central Ru(II) atom.
The excitation of solid films of 6 and 7 at room temperature gives long-lived orange-red to red luminescence (see Table 2). For complex 7, the blue-shift of the emission peak wavelength to 571 nm, as opposed to the 609 nm peak observed for 6, is due to the electron-withdrawing CF3substituent on the ifpz
li-gands. Another notable feature of 7 is the gradual emergence of an intraligand3p–p* contribution, which is supported by the
300 400 500 600 700 0 5000 10000 15000 20000 25000 1 2 3 4 5 ex tinct io n c o effi cie n t ( M -1 cm -1 ) wavelength (nm)
Figure 3. UV-vis absorption spectra of complexes 1–5 in CH2Cl2at room
temperature. 500 600 700 800 900 0.0 0.2 0.4 0.6 0.8 1.0 1 3 4 5 re la tiv e in ten si ty wavelength (nm)
Figure 4. Normalized emission spectra of 1 (–䊉 –), 3 (– ~ –), 4 (– 夹 –),
and 5 (–& –) as thin solid films at room temperature.
300 400 500 600 700 800 0 5000 10000 15000 20000 25000 wavelength (nm) ex ti n cti on c o effc ie nt ( M -1 cm -1 )
Figure 5. UV-vis absorption spectra of 6 (–& –) and 7 (– 夹 –) in CH2Cl2at
room temperature and normalized emission spectra obtained for thin sol-id films of 6 and 7 (kex= 450 nm).
P
occurrence of a second emission peak at kmax= 589 nm, arising
from the vibronic coupling.
Finally, in comparison to the data obtained at room tempera-ture, a much longer phosphorescence lifetime, and thus an in-creased phosphorescence quantum yield, has been measured for complexes 4–7 in a frozen CH2Cl2matrix at 77 K. These
re-sults indicate a dominant thermally activated radiationless pro-cess for all the complexes studied.
2.3. Electrochemistry
The redox potentials of the Ru(II) complexes have been
de-termined from cyclic voltammograms, and the data are summa-rized in Table 2. It is believed that oxidation occurs mainly at the metal site, along with minor contributions from the pyrazo-late chepyrazo-lates and phosphine ligands. This hypothesis is further corroborated by theoretical studies presented in a subsequent section. Accordingly, the bppz complex 1 shows an oxidation potential of –0.24 V, while the fppz complex 2 exhibits a higher oxidation potential of 0.19 V due to the presence of CF3
sub-stituents, which reduce the electron density at the metal atom. Similarly, replacing the electron-withdrawing CF3group on the
chelate chromophores with an electron-donating tert-butyl moiety leads to a decrease of the oxidation potential, as dem-onstrated by the higher oxidation potential of 5 (0.13 V) versus that of 4 (–0.33 V), as well as by the decrease of the oxidation potential of 6 (–0.23 V) versus that of 7 (0.36 V). Moreover, comparing the oxidation potentials of a pair of complexes, 4 (–0.33 V) versus 6 (–0.23 V), and for another pair of complex-es, 5 (0.13 V) versus 7 (0.36 V), reveals that a cis orientation induces a higher oxidation potential as compared to a trans ori-entation, assuming that the electronic effects of PPh2Me are
comparable to that of the chelating dpp苷 ligand. Finally, a comparison of the oxidation potentials of the two trans complexes 3 and 4 indicates that the p-accepting character of the phosphine ligands is slightly increased in the order PPhMe2< PPh2Me.
As for the reduction behavior, except for the pyridyl pyrazo-late complexes 1 and 2, neither of which gives a visible reduc-tion peak in tetrahydrofuran (THF) solureduc-tion, the isoquinolyl complexes 3–7 exhibit reversible reduction signals in a narrow range between –2.40 and –2.67 V. The similar behavior of these complexes leads us to believe that the observed reduction is mainly associated with the isoquniolyl groups, while the ancil-lary phosphine p-acceptors and the substituents on the pyrazo-late segments likely influence the electrochemical potential of the central metal atom. The reduction potentials shown in Ta-ble 2 are fully consistent with this delineation; however, the variation of the data is far less significant than that seen for the oxidative potentials. The lowest reduction potential (–2.40 V) observed for 7 is due to its electron-withdrawing CF3
substitu-ents and the more efficient p-accepting character of the dpp苷 ligand. It is worth noting that the redox cycle for com-pounds 3–7 is fully reversible even after > 10 scans, indicating the superior redox stability of these complexes, which is a key requirement for OLED applications.
2.4. Fabrication of OLED Devices
Remarkably high emission efficiencies in the red have been obtained for OLED devices fabricated using vacuum deposi-tion. Multilayer devices have been fabricated containing in-dium tin oxide (ITO), 4,4′-bis[N-(1-naphthyl)-N-phenylamino]-biphenyl (NPB), 4,4′-N,N′-dicarbazolyl-1,1′-4,4′-bis[N-(1-naphthyl)-N-phenylamino]-biphenyl (CBP), 2,9-dimethyl-4,7-diphenyl-1,10-phenanthroline (BCP), and tris(8-hydroxyquinolinato) aluminum(III) (AlQ3). The
multi-layer devices with a configuration of ITO/NPB (40 nm)/CBP:5 (30 nm)/BCP (10 nm)/AlQ3 (30 nm)/Mg:Ag (10:1) (50 nm)
have been fabricated using various doping concentrations of 5: 6, 12, 24, 50, and 100 %. The configuration used here is based on devices previously reported by Adachi et al.[22]The crucial device performance characteristics are summarized in Table 3.
Bright red emission is observed for all of the concentrations used, even when using a nondoped architecture. The current– voltage–luminance (I–V–L) curves plotted in Figure 6a reveal a trend of decreasing drive voltage with increasing doping lev-els, implying that the dopant may also serve to transport charge.[23]The EL spectra are depicted in Figure 6b; a small
emission peak is seen at approximately 450 nm at low dopant concentrations of 6 and 12 %, and can be identified to origi-nate from NPB. The NPB emission diminishes and became negligible upon increasing the doping concentration to 24 % and higher. Concurrently, a small red-shift of the EL spectra is observed with increasing dopant concentrations, kmax is at
approximately 624 nm for the 5 % device and shifts to 630 nm for the neat film device (Fig. 6b), presumably due to the change in the polarity of the medium.[24]Further optimization can be achieved by the incorporation of a thin layer of poly(styrene sulfonate)-doped poly(3,4-ethylenedioxythio-phene) (PEDOT) to improve the surface smoothness and to serve as a hole injection layer.[25]The best results, with an ex-ternal quantum efficiency (EQE) of 7.03 %, luminous efficien-cy of 8.02 cd A–1, and power efficiency of 2.74 lm W–1, have
been obtained using this configuration at a current density of 20 mA cm–2.
The decent performance of this series of devices can be plau-sibly attributed to the remarkably short radiative lifetime (∼ 7.58 ls, as discussed above) for 5, as well as to the existence of the two trans-oriented phosphine ligands, which effectively block the aromatic chromophores from significantly interacting in the solid state, thereby greatly reducing triplet–triplet anni-hilation. This, in combination with the electron deficient nature of the isoquinoline moiety (or its quinoline analogue), allows for more balanced charge injection, transportation, and recom-bination processes in the emissive layer.[26]
Moreover, it is important to note that complex 5 does not crystallize at doping concentrations≤ 50 %, which is revealed by the minor variations in the luminescence efficiencies. Such an observation is consistent with a recent report on an iridi-um(III) emitter, wherein an EQE of 5.5 % was observed for a
device using a 100 % concentration of the dopant,[27] suggest-ing that the films remained smooth and uniform under these conditions. However, for devices prepared using a 100 % con-centration of 5, the EQE drops from 5.1 to 2.1 %, which may
FULL
P
partially be caused by crystallite formation during device fab-rication.
In order to investigate the EL performance versus the emit-ting material, we have fabricated similar OLED devices using the cis-orientated phosphine complex 6, which is quite similar to 5 in terms of its emission wavelength and quantum yield in solution. Unfortunately, for an optimized multilayer device using 12 wt % of 6 as a dopant emitter, we observe a reduced maximum luminescence of 5572 cd m–2at 15.5 V, and an EQE of 2.3 %, luminous efficiency of 4.13 cd A–1, and power effi-ciency of 2.10 lm W–1 at a driving voltage of 20 mA cm–2. Furthermore, the color chromaticity of this device also shifts from saturated red to red-orange with less desirable Commis-sion Internationale de l’Eclairage (CIE) coordinates of (0.60, 0.39), which could be due to the slight blue-shifted emission at 609 nm in the solid state (see Table 2).
2.5. Upper Energy-Gap Limit for Efficient Ru(II) OLEDs
Once we have demonstrated the preparation of highly effi-cient, charge-neutral phosphorescent Ru(II) metal complexes
and their corresponding OLEDs, the next critical challenge is to be able to tune the emission wavelength. The emission wave-length can be tuned by the systematic variation of the ancillary phosphines as well as by derivatization of the pyrazolate chro-mophores. However, given the high oxidation potential and relatively weak ligand-field strength of Ru(II), a fundamental
question that naturally arises is how high in energy can the
3MLCT or3p–p* transitions be tuned in these Ru(
II) complexes
before crossing over to the metal-centered d–d state,[13]which is widely accepted to be the main radiationless deactivation chan-nel in nature due the weakened metal–ligand bond strength and forbidden transitions (from excited to ground states).
To better understand this underlying issue, we have per-formed theoretical calculations (time-dependent density func-tional theory (TDDFT), see experimental section) to model the photophysical properties of the prepared neutral Ru(II)
complexes. Figure 7 depicts the features of selected occupied and unoccupied frontier orbitals primarily involved in the low-er-lying transitions for complexes 2, 3, and 6, while the descrip-tions and the energy gaps for each transition are listed in Table 4. The lowest singlet S0→ S1transitions for 3 and 6 are
calculated to be at 615 and 504 nm, respectively, which is in good agreement with the values observed experimentally in the absorption spectra (3: 580 nm, 6: 470 nm). Likewise, the es-timated S0→ T1transition at 660 nm for 3 is qualitatively
con-sistent with the observed 718 nm phosphorescence. The devia-tion of the current theoretical approach from the experimental results is mainly due to the experimental difficulties in deter-mining the absorption peak frequency. The broad and diffusive nature of the S0→ S1peak causes a large uncertainty in
deter-mining the onset of emission. In addition, these discrepancies may partially be explained by the underestimation of the mix-ing of the high density of low lymix-ing states or the less-extensive basis set used for the Ru(II) atom. On the other hand, it is also
unfair to compare the energy gap calculated for the S0→ T1
transition in the gas phase to values obtained from
phosphores-Table 3. Performance characteristics for the device configuration: ITO/NPB/CBP:X % Ru complexes/BCP/AlQ3/
Mg:Ag. Concentration [%] Maximum luminescence [a] [cd m–2] EQE [b][c] [%] Lum. [b][c] [cd m–2] Luminous efficiency [b][c] [cd A–1] Power efficiency [b][c] [lm W–1] kmax[nm] CIE (x, y) [d] Turn-on voltage [e] [V] complex 5 as dopant emitter
6% 8386 (16.0 V) 4.54 (3.21) 1086 (3845) 5.46 (3.86) 1.97 (1.08) 626/ (0.65, 0.33) 3.7 12% 9935 (16.0 V) 5.06 (3.66) 1174 (4223) 5.87 (4.24) 2.31 (1.29) 627/ (0.67, 0.33) 3.2 24% 10 079 (15.0 V) 5.10 (3.92) 1146 (4398) 5.74 (4.42) 2.62 (1.50) 630/ (0.67, 0.33) 3.0 50% 11 052 (15.0 V) 5.01 (4.46) 1076 (4442) 5.38 (4.45) 2.63 (1.60) 630/ (0.67, 0.33) 2.7 100% 6320 (12.5 V) 2.14 (1.92) 463 (2083) 2.32 (2.09) 1.42 (0.93) 630/ (0.67, 0.33) 2.7 complex 5 as dopant with PEDOT–PSS as the hole injection layer
24% 8822 (16.0 V) 7.03 (4.74) 1592 (5392) 8.02 (5.40) 2.74 (1.34) 628/ (0.67, 0.33) 3.0 50% 11 638 (16.0 V) 5.00 (4.07) 1235 (5023) 6.17 (5.03) 2.85 (1.63) 628/ (0.67, 0.33) 2.6 complex 6 as dopant emitter
12% 5572 (15.5 V) 2.30 (1.52) 820 (2719) 4.13 (2.73) 2.10 (0.99) 614/ (0.60, 0.39)
2.7
[a] Values in parentheses are the applied driving voltages. [b] Data collected using a current density of 20 mA cm–2. [c] Values in parentheses represent data collected at a current density of 100 mA cm–2. [d]
Mea-sured at a driving voltage of 8 V. [e] Data showing a brightness of 1 cd m–2.
P
cence in solution, which is normally subject to a further spec-tral red-shift due to the polarization of the solvent. Never-theless, the calculations qualitatively predict the relative ar-rangement of energy levels for these lower lying excited states.
For complex 3, the lowest triplet state (T1) mainly involves
transitions from the HOMO to the lowest unoccupied molecu-lar orbital (LUMO); the electron densities of the HOMO are located on the central metal atom and on the pyrazolate frag-ment of the chelating ligand, whereas those of the LUMO are essentially distributed over the entire isoquinoline moiety. The results clearly indicate that the lowest electronic S0→ T1
transi-tion is dominated by MLCT in combinatransi-tion with p–p* (intra-li-gand charge transfer (ILCT); pyrazolate site (p)→ isoqunioline
site (p*)) transitions. This behavior is some-what similar to Ir(ppy)3(ppy: 2-phenyl
pyri-dine) and its derivatives, which are dominated primarily by a 3p–p* transition, mixed to a
great extent with3MLCT character.[28] For cis complexes such as complex 6, al-though the S0→ T1transition has a
predomi-nantly (ca. 60 %) MLCT character with some additional contribution from ILCT, there is a small but nonnegligible contribution from metal d–d transitions (see HOMO→ LUMO + 1, Table 4 and Fig. 7), estimated to be around 3 % (Supporting Information). Moreover, formation of complexes 1 and 2 by substituting isoquinolyl pyrazolate with pyri-dyl pyrazolate further increases the S0→ T1
energy gap. One thus expects a greater metal-centered d–d character in the S0→ T1
transi-tions for these two molecules. This viewpoint is firmly supported by both spectral data and TDDFT calculations. As shown by the ab-sorption spectra (Fig. 3), complex 2 appar-ently has the highest energy S0→ T1gap, and
the theoretical peak kmaxis located at 482 nm.
The results of TDDFT calculations (Fig. 7) of 2 also show that the T1state mainly has a
met-al d–d character (ca. 54 %, Supporting Infor-mation), while the typical 3MLCT state has moved up in energy and become the second lowest excited state.
It is believed that the metal-centered d–d state possesses a very shallow potential well, which may undergo a surface crossing (i.e., a conical type of interception) with the S0state,
inducing a dominant nonradiative pathway. Accordingly, this result implies that the deac-tivation of 2 occurs predominantly due to nonradiative processes, such as metal–ligand bond stretching motions. Experimental sup-port for this is provided by the observation of a very weak emission for 2 in solid matrices at 77 K. On the other hand, complex 1, coordi-nated with tert-butyl substituted chelates, ex-hibits weak but observable orange emission at room temperature (Table 2). This behavior arises from the electron-donating ability of the tert-butyl group, which makes the central metal atom more electron rich, resulting in the re-duction of the S0→ T1gap. TDDFT calculations of 1 predict a
S0→ T1 transition at 510 nm, supporting this hypothesis.
Furthermore, the tert-butyl substituents also reduce the metal d–d contribution to the T1state. The d–d contribution in 1 is
approximately 30 %, as opposed to the approximately 54 % contribution in 2 (Supporting Information).
To further examine how far the S0→ T1 energy gap can be
tuned for this series of chelated Ru(II) complexes, we have con-ceptually designed complex 8 (Fig. 8), where only one pyrazo-late chepyrazo-late is used as the emitting chromophore. Note that the
0 2 4 6 8 10 12 14 16 18 0 100 200 300 400 500 600 700 800 900 1000 Brightness Current density 6% 12% 24% 50% 100% voltage (V)
current density (mA/cm
2) 102 103 104 6% 12% 24% 50% 100% lu m in anc e (cd /m 2 ) 300 400 500 600 700 800 0.0 0.2 0.4 0.6 0.8 1.0 emission from NPB re la c ti v e in te n s it y wavelength (nm) 6% (626 nm) 12% (627 nm) 24% (630 nm) 50% (630 nm) 100% (630 nm)
a)
b)
Figure 6. a)I–V–L characteristics of devices based on an ITO/NPB (40 nm)/CBP:X % 5/BCP
(10 nm)/AlQ3(30 nm)/Mg:Ag (10:1) configuration. b) EL spectra of the devices as a function
of the doping concentration.
FULL
P
addition of a CF3substituent to the pyrazolate chelate in 8 is
aimed at further stabilizing the HOMO level. A large ligand field splitting is also ensured by anchoring p-accepting ancillary ligands, such as CO and CN–1, with the hope of shifting the metal d–d transitions to a higher energy, thereby ensuring that the p–p* transitions in the fppz ligand are again the lowest en-ergy transitions.
As shown in Figure 8, the TDDFT calculation gives an ex-pectedly large S0→ T1 gap of
approximately 2.91 eV (426 nm). Interestingly, analysis of the fron-tier orbitals shows that the dp
or-bital no longer contributes to the HOMO. Accordingly, the S0→ T1
transition is dominated by the in-tra-ligand 3p–p* transition, along with some excess ligand-to-metal charge transfer (LMCT) character. This causes a transfer of electron density to the metal dr*orbitals, as
well as to the p* orbitals of the an-cillary ligands (Fig. 8). The popula-tion of metal dr*orbitals and
ancil-lary ligand p* orbitals will greatly weaken the internal bonding, pro-viding a dominant non-radiative decay pathway for this hypotheti-cal complex. Combining both ex-perimental and theoretical results discussed in this section, we can safely conclude that the 482 nm absorption, i.e., the calculated en-ergy gap of the S0→ T1transition
for complex 2, likely serves as an upper limit for these Ru(II)
com-plexes, wherein they can avoid dominant metal d–d interference while still preserving an optimum emission efficiency.
3. Conclusions
Here, we have presented the rational design of a new series of luminescent charge-neutral ruthenium complexes, involving the utilization of isoquinolyl pyrazolate chromophores and a pair of phosphine ligands to produce an all trans coordination geometry. Complex 5 appears to be the most suitable candi-date for OLED applications among this class of materials, showing bright saturated red emission in the solid state (kmax= 632 nm and U = 0.24). In contrast, the cis-substituted
phosphine ligands show a significant hypsochromatic shift, which causes the emitting state to possess an increased propor-tion of metal d–d character, thereby leading to a drastic in-crease in the radiative lifetime as well as enhancing radiation-less deactivation, thus reducing the quantum efficiency of these molecules. The worst scenario is therefore obtained using the least conjugated fppz and bppz ligands, which significantly in-crease the energy gap of all the transitions, resulting in a domi-nant metal-centered d–d character for the lowest triplet state.
Moreover, we have successfully obtained phosphorescent OLED devices based on these neutral Ru(II) complexes. It is
believed that neutral complexes are better suited for OLED fabrication since their ionic counterparts tend to provide poor
complex HOMO LUMO+2 LUMO+12
2
HOMO LUMO LUMO+1
3
6
Figure 7. Selected frontier orbitals of 2, 3, and 6 involved in the lower lying transitions. Note that the
contri-bution from LUMO + 4 for complex 2 is rather small and hence has been omitted.
Table 4. Calculated energy levels for the lower-lying transitions of 2, 3,
and 6.
Assignments [nm] E [eV] F [a]
2 T1 HOMO→ LUMO+2 (64%) HOMO→ LUMO+4 (7%) HOMO→ LUMO+12 (22%) 482 2.57 ∼0 3 T1 HOMO→ LUMO (+98%) 659.8 1.88 ∼0 S1 HOMO→ LUMO+1 (+96%) 615.4 2.01 0.0107 6 T1 HOMO→ LUMO (+57%) HOMO→ LUMO+1 (+29%) HOMO-2→ LUMO (5%) 559.3 2.22 ∼0 S1 HOMO→ LUMO (+77%) HOMO-1→ LUMO (18%) 503.5 2.46 0.0081
[a]F = oscillator strength.
P
control over the aggregation and spatial distribution of the charged constituents in the dopant matrix under an applied electric current. High efficiency and saturated red emission has been observed for devices employing complex 5 as a dopant, prepared by co-deposition with the CBP host. In contrast, the cis-oriented complex 6 produces an orange emitting device with somewhat inferior EL properties, a result attributed to its long-er emission lifetime and relatively poor quantum efficiency.
Finally, we trust that this strategy for avoiding the incorpora-tion of metal d–d character into the lowest triplet state will be equally applicable to other systems involving second-row tran-sition metal elements. Most importantly, our results point out the competitive advantage of using charge-neutral Ru(II)
emit-ters for manufacturing saturated red OLEDs. To the best of our knowledge, these results represent a major breakthrough in the development of phosphorescent OLEDs using less ex-pensive second-row transition metal phosphors. We therefore believe that the results and prospects discussed in this study will spark a broad spectrum of interest in the field of photo-chemistry and OLED optoelectronics.
4. Experimental
General Information and Materials: Mass spectra (MS) were
ob-tained on a JEOL SX-102A instrument operating in electron impact (EI) mode or fast atom bombardment (FAB) mode.1H and13C NMR
spectra were recorded on Varian Mercury-400 and INOVA-500 instru-ments; chemical shifts (d) for1H and13C NMR data are quoted in ppm with respect to the internal standard tetramethylsilane. Elemental anal-yses were carried out at the NSC Regional Instrumentation Center at National Chao Tung University, Hsinchu, Taiwan. An orange rutheni-um complex [Ru(dpp苷)(CO)3] was synthesized by the reaction of
Ru3(CO)12 and
cis-1,2-bis-(diphenyl-phosphino)ethene under a CO atmo-sphere [29]. The pyrazole ligands, (bppz)H, (fppz)H, (ibpz)H, and (ifpz)H, were prepared according to lit-erature procedures [30]. All other reac-tions were performed under a nitrogen atmosphere using anhydrous solvents or solvents treated with an appropriate drying reagent.
Preparation of 1: A 50 mL
reac-tion flask was charged with (bppz)H (390 mg, 1.94 mmol), Ru3(CO)12
(200 mg, 0.31 mmol), and 20 mL of an-hydrous diethylene glycol monoethyl ether (DGME). The mixture was heated at 160–170 °C for 24 h. The temperature was then lowered to ap-proximately 120 °C, freshly sublimed Me3NO (85 mg, 1.53 mmol) dissolved
in 12 mL of DGME was added, and the mixture was stirred continuously for 5 min. Finally, PPh2Me (840 lL,
4.50 mmol) was injected into the mix-ture. In the meantime, the temperature of the solution was raised to 180 °C. After 24 h, the reaction was stopped. The solvent was evaporated under vac-uum, and the residue was washed with distilled water (20 mL × 2). Recrystalli-zation was achieved by the slow diffu-sion of hexane vapor into a saturated ethyl acetate solution at room temperature, providing an orange crys-talline solid (550 mg, 0.61 mmol) in 65 % yield. The yellow CF3
-substi-tuted derivative complex 2 was prepared in 69 % yield using a similar procedure.
Spectral data for 1: MS (FAB, 102Ru): m/z 902 [M+], 702 [M+– PPh2Me], 502 [M+– 2PPh2Me].1H NMR (400 MHz, d6-acetone):
d 10.35 (d, 2 H, JHH= 6.0 Hz), 7.18–7.13 (m, 6 H), 7.06 (t, 2 H,
JHH= 8.0 Hz), 7.02–6.94 (m, 6 H), 6.87–6.79 (m, 6 H), 6.67 (dt, 2 H, JHH= 6.0, 1.6 Hz), 6.61–6.59 (m, 4 H), 6.27 (s, 2 H), 1.58 (s, 18 H,tBu),
1.04 (t, 6 H, JHP= 2.8 Hz, Me). 31P NMR (202 MHz, d6-acetone): d
–19.6 (s). Anal. Calcd. for C50H54N6P2Ru: C, 66.58; N, 9.32; H, 6.03.
Found: C, 66.56; N, 9.28; H, 6.01.
Spectral data for 2: MS (FAB, 102Ru): m/z 926 [M+], 726
[M+– PPh
2Me], 526 [M+– 2PPh2Me].1H NMR (400 MHz, d6-acetone):
d 10.28 (d, 2 H, JHH= 5.8 Hz), 7.41 (t, 2 H, JHH= 7.8 Hz), 7.12–7.05 (m,
6 H), 7.01 (ddd, 2 H, JHH= 5.8, 7.0, 1.6 Hz), 6.96 (t, 4 H, JHH= 7.8 Hz),
6.93–6.86 (m, 8 H), 6.78 (s, 2 H), 6.68–6.64 (m, 4 H), 1.14 (t, 6 H,
JHP= 3.0 Hz, Me).31P NMR (242 MHz, d6-acetone): d 16.6 (s). Anal.
Calcd. for C44H36F6N6P2Ru: C, 57.08; N, 9.08; H, 3.92. Found: C, 57.14;
N, 9.18; H, 4.04.
Preparation of Isoquinolyl Complexes 3, 4, and 5: The synthetic
pro-cedures used were essentially identical to those for 1, using similar ra-tios of (ibpz)H or (ifpz)H, Ru3(CO)12, freshly sublimed Me3NO, and
phosphine ligands such as PPhMe2 or PPh2Me. Red complexes 3, 4,
and 5 were obtained in 62 %, 61 %, and 63 % yields, respectively. Spectral Data for 3: MS (FAB, 102Ru): m/z 878 [M+], 740 [M+– PPhMe 2], 602 [M+– 2PPhMe2]. 1H NMR (400 MHz, C6D6): d 10.83 (d, 2 H, JHH= 6.8 Hz), 8.76 (d, 2 H, JHH= 7.2 Hz), 7.40 (d, 2 H, JHH= 6.8 Hz), 7.24–7.23 (m, 4 H), 7.20 (s, 2 H), 6.91 (d, 2 H, JHH= 6.4 Hz), 6.62–6.55 (m, 6 H), 6.50–6.47 (m, 6 H), 1.88 (s, 18 H, tBu), 0.70 (t, 6 H, J HP= 3.1 Hz, Me), 0.44 (t, 6 H, JHP= 3.1 Hz, Me). 31P NMR (202 MHz, C
6D6): d 12.3 (s). Anal. Calcd for C48H54N6P2Ru:
C, 65.66; N, 9.57; H, 6.20. Found: C, 65.20; N, 9.33; H, 6.24.
Spectral Data for 4: MS (FAB, 102Ru): m/z 1003 [M+], 803
[M+– PPh2Me], 603 [M+– 2PPh2Me].1H NMR (400 MHz, d6-acetone):
d 10.75 (d, 2 H, JHH= 7.0 Hz), 8.39 (d, 2 H, JHH= 8.4 Hz), 7.69 (d, 2 H, JHH= 7.0 Hz), 7.53–7.43 (m, 4 H), 7.18 (d, 2 H, JHH= 6.8 Hz), 7.09–7.05 (m, 4 H), 6.89 (s, 2 H), 6.86–6.77 (m, 6 H), 6.72 (t, 2 H, JHH= 7.2 Hz), Assignments (T1) HOMO Ru C C N N N CF3 C C O O O N HOMO LUMO (85%) HOMO LUMO+1 (8%) HOMO LUMO+2 (9%) (426 nm)
LUMO LUMO+1 LUMO+2
→ → →
Figure 8. Proposed structure of 8, along with its T1transition and the associated frontier orbitals.
FULL
P
6.60–6.51 (m, 8 H), 1.69 (s, 18 H,tBu), 1.06 (t, 6 H, JHP= 3.0 Hz, Me). 31P NMR (242 MHz, d
6-acetone): d 18.0 (s). Anal. Calcd for
C58H58N6P2Ru: C, 69.51; N, 8.39; H, 5.83. Found: C, 69.55; N, 8.67; H,
6.09.
Spectral Data for 5: MS (FAB, 102Ru): m/z 1026 [M+], 826
[M+– PPh2Me], 626 [M+– 2PPh2Me].1H NMR (400 MHz, d6-acetone):
d 10.62 (d, 2 H, JHH= 6.4 Hz), 8.33 (d, 2 H, JHH= 7.6 Hz), 7.85 (d, 2 H, JHH= 7.7 Hz), 7.65 (dd, 2 H, JHH= 6.8, 7.6 Hz), 7.57 (dd, 2 H, JHH= 7.7, 6.8 Hz), 7.52 (d, 2 H, JHH= 6.4 Hz), 7.36 (s, 2 H), 6.85–6.80 (m, 8 H), 6.77–6.75 (m, 4 H), 6.69–6.63 (m, 8 H), 1.82 (t, 6 H, JHP= 3.0 Hz, Me). 19F NMR (470 MHz, d 6-acetone): d –59.1 (s, CF3). 31P NMR
(202 MHz, d6-acetone): d 15.7 (s). Anal. Calcd for C52H40F6N6P2Ru: C,
60.88; N, 8.19; H, 3.93. Found: C, 60.88; N, 8.10; H, 4.04.
Preparation of 6: To a 50 mL reaction flask was added
[Ru(dpp苷)(CO)3] (757 mg, 1.30 mmol), (ibpz)H (685 mg, 2.72 mmol),
and 20 mL of anhydrous DGME solvent. The mixture was heated at 170–180 °C for a period of 24 h. Subsequently, the solution was evapo-rated to dryness and the residue was purified by recrystallization from a saturated ethyl acetate solution, giving a red crystalline solid (765 mg, 0.77 mmol) in 59 % yield. The related orange complex 7 was obtained in 61 % yield by following similar procedures.
Spectral Data for 6: MS (FAB,102Ru): m/z 998 [M+], 747 [M+– ibpz], 498 [M+– 2ibpz]. 1H NMR (500 MHz, d6-acetone): d 8.55 (d, 2 H, JHH= 7.5 Hz), 8.06 (t, 4 H, JHH= 9.0 Hz), 7.87–7.75 (m, 2 H), 7.62 (d, 2 H, JHH= 7.5 Hz), 7.56 (dt, 2 H, JHH= 8.5, 1.0 Hz), 7.51 (dt, 2 H, JHH= 8.5, 1.0 Hz), 7.30 (t, 2 H, JHH= 7.0 Hz), 7.18 (t, 4 H, JHH= 7.0 Hz), 6.94 (dd, 2 H, JHH= 8.0, 2.0 Hz), 6.91–6.86 (m, 4 H), 6.83 (s, 2 H), 6.79 (t, 4 H, JHH= 8.0 Hz), 6.66 (t, 4 H, JHH= 7.0 Hz), 1.53 (s, 18 H,tBu).31P NMR (202 MHz, d
6-acetone): d 72.4 (s). Anal. Calcd.
for C58H54N6P2Ru: C, 69.79; N, 8.42; H, 5.45. Found: C, 70.23; N, 8.43;
H, 5.39.
Spectral Data for 7: MS (FAB,102Ru): m/z 1022 [M+], 759 [M+– ifpz], 496 [M+– 2ifpz]. 1H NMR (500 MHz, d6-acetone): d 8.57 (d, 2 H, JHH= 8.5 Hz), 8.03–7.91 (m, 2 H), 7.88 (t, 4 H, JHH= 9.5 Hz), 7.75 (dd, 2 H, JHH= 7.0, 2.0 Hz), 7.69–7.63 (m, 4 H), 7.35 (t, 2 H, JHH= 7.5 Hz), 7.33 (s, 2 H), 7.22–7.20 (m, 6 H), 7.00 (dd, 2 H, JHH= 6.0, 1.5 Hz), 6.95 (dt, 2 H, JHH= 7.0, 1.0 Hz), 6.70–6.63 (m, 8 H). 19F NMR (470 MHz, d6-acetone): d –59.5 (s).31P NMR (242 MHz, d6-acetone): d 72.3 (s).
Anal. Calcd. for C52H36F6N6P2Ru: C, 61.12; N, 8.22; H, 3.55. Found: C,
61.31; N, 8.60; H, 3.90.
X-ray Diffraction Studies: Single crystal X-ray diffraction data was
obtained on a Bruker SMART Apex charge coupled device (CCD) dif-fractometer using (Mo Ka) radiation (k = 0.71073 Å). The data was col-lected using the SMART program. Cell refinement and data reduction were performed with the SAINT program. The structure was deter-mined using the SHELXTL/PC program and refined using full-matrix least squares. Crystallographic refinement parameters for complexes 3 and 6 are summarized in Table 1. Their crystallographic data (exclud-ing structure factors) have been deposited in the Cambridge Crystallo-graphic Data Centre with deposition numbers CCDC-261 543 and CCDC-298 979, respectively. This data can be obtained free of charge on application to CCDC, 12 Union Road, Cambridge CB21EZ (UK) (fax: (+44) 1223-336-033; E-mail: [email protected]).
Electrochemical Measurements: Cyclic voltammetry (CV)
measure-ments were performed using a BAS 100 B/W electrochemical analyzer. The oxidation and reduction measurements were recorded using Pt wire and Au disks coated with Hg as the working electrodes, respec-tively. The measurements were made in anhydrous CH2Cl2and THF
solution containing 0.1MTBAPF6as the supporting electrolyte with a
typical scan rate of 100 mV s–1. The potentials were measured against a
Ag/Ag+(0.01
MAgNO3) reference electrode with ferrocene as the
in-ternal standard.
Photophysical Data Measurement and OLED Fabrication:
Steady-state absorption, emission, and phosphorescence lifetime measure-ments, both in solution and in the solid state, have been described in our previous reports [31]. For measuring quantum yields in the solid state, an integrating sphere (Labsphere) was used. The solid film was prepared via a vapor deposition method and was excited by a 514 nm Ar+laser line. The emission was then acquired by an intensified CCD for subsequent analyses [32]. The fabrication procedures for the
OLEDs, including for patterning and cleaning the ITO substrates, fol-lowed methods previously described in the literature [27].
Theoretical Calculations: TDDFT [33] calculations using B3LYP [34]
functions were performed based on the structures obtained from single crystal X-ray diffraction. A “Double-f” quality basis set consisting of Hay and Wadt’s effective core potentials (LANL2DZ) [35] was used for the Ru atom and 6-31G* basis sets were used for H, C, N, and P atoms [36]. A relativistic effective core potential (ECP) was used to re-place the inner core electrons of Ru(II), leaving the outer core (4s24p6)
electrons and the 4d6valence electrons. Typically, the lowest ten triplet
and ten singlet roots of the non-Hermitian eigenvalue equations were obtained to determine the vertical excitation energies. Oscillator strengths were deduced from the dipole transition matrix elements (for singlet states only). The excited-state TDDFT calculations were carried out using Gaussian03 as described in our previous publication [37].
Received: December 14, 2005 Final version: March 3, 2006
–
[1] C. W. Tang, S. A. Vanslyke, Appl. Phys. Lett. 1987, 51, 913. [2] U. Mitschke, P. Bauerle, J. Mater. Chem. 2000, 10, 1471.
[3] a) C. Adachi, M. A. Baldo, S. R. Forrest, S. Lamansky, M. E. Thomp-son, R. C. Kwong, Appl. Phys. Lett. 2001, 78, 1622. b) A. Tsuboyama, H. Iwawaki, M. Furugori, T. Mukaide, J. Kamatani, S. Igawa, T. Mor-iyama, S. Miura, T. Takiguchi, S. Okada, M. Hoshino, K. Ueno, J. Am.
Chem. Soc. 2003, 125, 12 971. c) C. Jiang, W. Yang, J. Peng, S. Xiao,
Y. Cao, Adv. Mater. 2004, 16, 537.
[4] a) Y.-L. Tung, S.-W. Lee, Y. Chi, Y.-T. Tao, C.-H. Chien, Y.-M. Cheng, P.-T. Chou, S.-M. Peng, C.-S. Liu, J. Mater. Chem. 2005, 15, 460. b) X. Jiang, A. K. Y. Jen, B. Carlson, L. R. Dalton, Appl. Phys. Lett.
2002, 81, 3125. c) B. Carlson, G. D. Phelan, W. Kaminsky, L. Dalton,
X. Z. Jiang, S. Liu, A. K. Y. Jen, J. Am. Chem. Soc. 2002, 124, 14 162. d) S. Bernhard, X. Gao, G. G. Malliaras, H. D. Abruna, Adv. Mater.
2002, 14, 433. e) Y. Ma, H. Zhang, J. Shen, C. Che, Synth. Met. 1998, 94, 245.
[5] a) F.-M. Hwang, H.-Y. Chen, P.-S. Chen, C.-S. Chi, Y. Liu, C.-F. Shu, F.-I. Wu, P.-T. Chou, S.-M. Peng, G.-H. Lee, Inorg. Chem. 2005, 44, 1344. b) Y.-H. Niu, B. Chen, S. Liu, H. Yip, J. Bardecker, A. K. Y. Jen, J. Kavitha, Y. Chi, C.-F. Shu, Y.-H. Tseng, C.-H. Chien, Appl.
Phys. Lett. 2004, 85, 1619. c) X. Gong, S.-H. Lim, J. C. Ostrowski,
D. Moses, C. J. Bardeen, G. C. Bazan, J. Appl. Phys. 2004, 95, 948. d) X. Chen, J.-L. Liao, Y. Liang, M. O. Ahmed, H. E. Tseng, S. A. Chen, J. Am. Chem. Soc. 2003, 125, 636. e) S. Lamansky, P. Djurovich, D. Murphy, F. Abdel-Razzaq, H.-E. Lee, C. Adachi, P. E. Burrows, S. R. Forrest, M. E. Thompson, J. Am. Chem. Soc. 2001, 123, 4304. [6] a) S.-Y. Chang, J. Kavitha, S.-W. Li, C.-S. Hsu, Y. Chi, Y.-S. Yeh, P.-T.
Chou, G.-H. Lee, A. J. Carty, Y.-T. Tao, C.-H. Chien, Inorg. Chem.
2006, 45, 137. b) W. Lu, B.-X. Mi, M. C. W. Chan, Z. Hui, C.-M. Che,
N. Zhu, S.-T. Lee, J. Am. Chem. Soc. 2004, 126, 4958. c) C.-M. Che, Y.-J. Hou, M. C. W. Chan, J. Guo, Y. Liu, Y. Wang, J. Mater. Chem.
2003, 13, 1362. d) J. Brooks, Y. Babayan, S. Lamansky, P. I. Djurovich,
I. Tsyba, R. Bau, M. E. Thompson, Inorg. Chem. 2002, 41, 3055. [7] a) C. Adachi, M. A. Baldo, M. E. Thompson, S. R. Forrest, J. Appl.
Phys. 2001, 90, 5048. b) Y. Kawamura, K. Goushi, J. Brooks, J. J.
Brown, H. Sasabe, C. Adachi, Appl. Phys. Lett. 2005, 86, 071 104. [8] a) C. H. Lyons, E. D. Abbas, J.-K. Lee, M. F. Rubner, J. Am. Chem.
Soc. 1998, 120, 12 100. b) M. Buda, G. Kalyuzhny, A. J. Bard, J. Am. Chem. Soc. 2002, 124, 6090. c) F. G. Gao, A. J. Bard, Chem. Mater. 2002, 14, 3465. d) S. Bernhard, J. A. Barron, P. L. Houston, H. D.
Abruna, J. L. Ruglovksy, X. Gao, G. G. Malliaras, J. Am. Chem. Soc.
2002, 124, 13 624. e) H.-J. Su, F.-I. Wu, C.-F. Shu, Y.-L. Tung, Y. Chi,
G.-H. Lee, J. Polym. Sci., Part A: Polym. Chem. 2005, 43, 859. [9] a) G. Kalyuzhny, M. Buda, J. McNeill, P. Barbara, A. J. Bard, J. Am.
Chem. Soc. 2003, 125, 6272. b) H. Rudmann, S. Shimada, M. F.
Rub-ner, J. Appl. Phys. 2003, 94, 115. c) C.-Y. Liu, A. J. Bard, J. Am. Chem.
Soc. 2002, 124, 4190. d) H. Rudmann, S. Shimada, M. F. Rubner, J.
P
Am. Chem. Soc. 2002, 124, 4918. e) H. Rudmann, M. F. Rubner, J. Appl. Phys. 2001, 90, 4338. f) E. Holder, B. M. W. Langeveld, U. S.
Schubert, Adv. Mater. 2005, 17, 1109.
[10] a) S. Welter, K. Brunner, J. W. Hofstraat, L. De Cola, Nature 2003,
421, 54. b) J. D. Slinker, A. A. Gorodetsky, M. S. Lowry, J. Wang,
S. Parker, R. Rohl, S. Bernhard, G. G. Malliaras, J. Am. Chem. Soc.
2004, 126, 2763. c) D. A. Bernards, J. D. Slinker, G. G. Malliaras,
S. Flores-Torres, H. D. Abruna, Appl. Phys. Lett. 2004, 84, 4980. d) D. Dini, Chem. Mater. 2005, 17, 1933.
[11] a) H. Xia, C. Zhang, X. Liu, S. Qiu, P. Lu, F. Shen, J. Zhang, Y. Ma, J.
Phys. Chem. B 2004, 108, 3185. b) H. Xia, C. Zhang, S. Qiu, P. Lu,
J. Zhang, Y. Ma, Appl. Phys. Lett. 2004, 84, 290. c) J. Yang, K. C. Gor-don, Chem. Phys. Lett. 2003, 372, 577. d) J. Yang, K. C. GorGor-don,
Chem. Phys. Lett. 2004, 385, 481.
[12] Y.-L. Tung, S.-W. Lee, Y. Chi, L.-S. Chen, C.-F. Shu, F.-I. Wu, A. J. Carty, P.-T. Chou, S.-M. Peng, G.-H. Lee, Adv. Mater. 2005, 17, 1059. [13] a) S. Zalis, I. R. Farrell, A. Vlcek Jr., J. Am. Chem. Soc. 2003, 125,
4580. b) M. K. Nazeeruddin, R. Humphry-Baker, D. Berner, S. Riv-ier, L. Zuppiroli, M. Graetzel, J. Am. Chem. Soc. 2003, 125, 8790. [14] a) C.-C. Cheng, W.-S. Yu, P.-T. Chou, S.-M. Peng, G.-H. Lee, P.-C. Wu,
Y.-H. Song, Y. Chi, Chem. Commun. 2003, 2628. b) H.-Y. Chen, Y. Chi, C.-S. Liu, J.-K. Yu, Y.-M. Cheng, K.-S. Chen, P.-T. Chou, S.-M. Peng, G.-H. Lee, A. J. Carty, S.-J. Yeh, C.-T. Chen, Adv. Funct. Mater.
2005, 15, 567.
[15] J. Kavitha, S.-Y. Chang, Y. Chi, J.-K. Yu, Y.-H. Hu, P.-T. Chou, S.-M. Peng, G.-H. Lee, Y.-T. Tao, C.-H. Chien, A. J. Carty, Adv. Funct.
Ma-ter. 2004, 15, 223.
[16] a) J.-K. Yu, Y.-H. Hu, Y.-M. Cheng, P.-T. Chou, S.-M. Peng, G.-H. Lee, A. J. Carty, Y.-L. Tung, S.-W. Lee, Y. Chi, C.-S. Liu, Chem. Eur. J.
2004, 10, 6255. b) P.-C. Wu, J.-K. Yu, Y.-H. Song, Y. Chi, P.-T. Chou,
S.-M. Peng, G.-H. Lee, Organometallics 2003, 22, 4938.
[17] Y.-L. Tung, P.-C. Wu, C.-S. Liu, Y. Chi, J.-K. Yu, Y.-H. Hu, P.-T. Chou, S.-M. Peng, G.-H. Lee, Y. Tao, A. J. Carty, C.-F. Shu, F.-I. Wu,
Orga-nometallics 2004, 23, 3745.
[18] a) A. El-Ghayoury, A. Harriman, A. Khatyr, R. Ziessel, Angew.
Chem. Int. Ed. 2000, 39, 185. b) P. A. Anderson, F. R. Keene, T. J.
Meyer, J. A. Moss, G. F. Strouse, J. A. Treadway, J. Chem. Soc.,
Dal-ton Trans. 2002, 3820. c) Y.-Q. Fang, N. J. Taylor, G. S. Hanan, F.
Loi-seau, R. Passalacqua, S. Campagna, H. Nierengarten, A. Van Dorsse-laer, J. Am. Chem. Soc. 2002, 124, 7912.
[19] a) D. P. Rillema, D. S. Jones, H. A. Levy, J. Chem. Soc., Chem.
Com-mun. 1979, 849. b) B. M. Golstein, J. K. Barton, H. M. Berman, Inorg. Chem. 1986, 25, 842. c) P. A. Anderson, G. B. Deacon, K. H.
Haar-mann, F. R. Keene, T. J. Meyer, D. A. Reitsma, B. W. Skelton, G. F. Strouse, N. C. Thomas, J. A. Treadway, A. H. White, Inorg.
Chem. 1995, 34, 6145. d) C. M. Kepert, A. M. Bond, G. B. Deacon,
L. Spiccia, B. W. Skelton, A. H. White, J. Chem. Soc., Dalton Trans.
2004, 1766.
[20] A. Vlcek Jr., Coord. Chem. Rev. 1998, 177, 219.
[21] a) W.-S. Huang, J. T. Lin, C.-H. Chien, Y.-T. Tao, S.-S. Sun, Y.-S. Wen,
Chem. Mater. 2004, 16, 2480. b) S. Lamansky, P. Djurovich, D.
Mur-phy, F. Abdel-Razzaq, R. Kwong, I. Tsyba, M. Bortz, B. Mui, R. Bau, M. E. Thompson, Inorg. Chem. 2001, 40, 1704.
[22] C. Adachi, M. A. Baldo, S. R. Forrest, M. E. Thompson, Appl. Phys.
Lett. 2000, 77, 904.
[23] a) Y.-Y. Noh, C.-L. Lee, J.-J. Kim, J. Chem. Phys. 2003, 118, 2853. b) R. J. Holmes, B. W. D’Andrade, S. R. Forrest, X. Ren, J. Li, M. E. Thompson, Appl. Phys. Lett. 2003, 83, 3818.
[24] V. Bulovic, R. Deshpande, M. E. Thompson, S. R. Forrest, Chem.
Phys. Lett. 1999, 308, 317.
[25] a) F.-C. Chen, C.-W. Chu, J. He, Y. Yang, J.-L. Lin, Appl. Phys. Lett.
2004, 85, 3295. b) T. M. Brown, J. S. Kim, R. H. Friend, F. Cacialli,
R. Daik, W. J. Feast, Appl. Phys. Lett. 1999, 75, 1679.
[26] a) J. L. Kim, J. K. Kim, H. N. Cho, D. Y. Kim, C. Y. Kim, S. I. Hong,
Macromolecules 2000, 33, 5880. b) X. W. Zhan, Y. Q. Liu, X. Wu,
S. A. Wang, D. B. Zhu, Macromolecules 2002, 35, 2529. c) C. J. Tonzo-la, M. M. Alam, B. A. Bean, S. A. Jenekhe, Macromolecules 2004, 37, 3554.
[27] Y.-H. Song, S.-J. Yeh, C.-T. Chen, Y. Chi, C.-S. Liu, J.-K. Yu, Y.-H. Hu, P.-T. Chou, S.-M. Peng, G.-H. Lee, Adv. Funct. Mater. 2004, 14, 1221.
[28] P. J. Hay, J. Phys. Chem. A 2002, 106, 1634.
[29] S.-J. Skoog, A.-L. Jorgenson, J.-P. Campbell, M.-L. Douskey, E. Mun-son, W.-L. Gladfelter, J. Organomet. Chem. 1998, 557, 13.
[30] a) S. Kubota, M. Uda, T. Nakagawa, J. Heterocycl. Chem. 1975, 12, 855. b) K. Funabiki, N. Noma, G. Kuzuya, M. Matsui, K. Shibata, J.
Chem. Res., Synop. 1999, 1301.
[31] P.-T. Chou, W.-S. Yu, Y.-M. Cheng, S.-C. Pu, Y.-C. Yu, Y.-C. Lin, C.-H. Huang, C.-T. Chen, J. Phys. Chem. A 2004, 108, 6487.
[32] J. C. De Mello, F. H. Wittmann, R. H. Friend, Adv. Mater. 1997, 9, 230.
[33] a) C. Jamorski, M. E. Casida, D. R. Salahub, J. Chem. Phys. 1996, 104, 5134. b) M. Petersilka, U. J. Grossmann, E. K. U. Gross, Phys. Rev.
Lett. 1996, 76, 1212. c) R. Bauernschmitt, R. Ahlrichs, F. H. Hennrich,
M. M. Kappes, J. Am. Chem. Soc. 1998, 120, 5052. d) M. E. Casida, J.
Chem. Phys. 1998, 108, 4439. e) R. E. Stratmann, G. E. Scuseria, M. J.
Frisch, J. Chem. Phys. 1998, 109, 8218.
[34] a) C. Lee, W. Yang, R. G. Parr, Phys. Rev. B: Condens. Matter 1988,
37, 785. b) A. D. Becke, J. Chem. Phys. 1993, 98, 5648.
[35] a) P. J. Hay, W. R. Wadt, J. Chem. Phys. 1985, 82, 270. b) W. R. Wadt, P. J. Hay, J. Chem. Phys. 1985, 82, 284. c) P. J. Hay, W. R. Wadt, J.
Chem. Phys. 1985, 82, 299.
[36] P. C. Hariharan, J. A. Pople, Mol. Phys. 1974, 27, 209.
[37] J.-K. Yu, Y.-M. Cheng, Y.-H. Hu, P.-T. Chou, Y.-L. Chen, S.-W. Lee, Y. Chi, J. Phys. Chem. B 2004, 108, 19 908.