行政院國家科學委員會專題研究計畫 期末報告
國際股市之殘差動能
計 畫 類 別 : 個別型 計 畫 編 號 : NSC 101-2410-H-004-057- 執 行 期 間 : 101 年 08 月 01 日至 102 年 07 月 31 日 執 行 單 位 : 國立政治大學國際經營與貿易學系 計 畫 主 持 人 : 林信助 計畫參與人員: 碩士班研究生-兼任助理人員:王馨儀 大專生-兼任助理人員:劉允文 報 告 附 件 : 出席國際會議研究心得報告及發表論文 公 開 資 訊 : 本計畫可公開查詢中 華 民 國 102 年 09 月 12 日
中 文 摘 要 : 本計畫主要研究 Blitz et al. (2011)所提出的殘差動能策 略在國際股市的架構下是否依舊存在獲利性,以及其與跨國 文化差異之關係。利用 31 個 MSCI 國家個股的股票資料, 我 們發現其中有 21 個國家在中間持有期間存在顯著為正的殘差 動能溢酬。我們也更進一步地發現:這些顯著的跨國殘差動 能利潤差異與 Hofstede (2001) 所建構個人主義指標所代表 的文化差異有顯著的正相關。這個結果指出跨國文化差異乃 國際股市間普遍存在之殘差動能利潤的一個主要決定因素, 並且支持「殘差動能利潤比較可能是由於行為面的因素所造 成的」這個論調。 中文關鍵詞: 殘差動能;跨國文化差異;個人主義指標
英 文 摘 要 : This paper examines profitability of residual momentum strategy (Blitz, Huij, and Martens, 2011) and its relation with cross-country cultural
differences. Using data on individual stocks from 38 MSCI countries, we find 21 of which exhibit
significantly positive residual momentum premiums for intermediate-term holding periods. Furthermore, we discover significant cross-country differences in residual momentum profits, which are positively associated with cross-country cultural differences proxied by Hofstede's (2001) individualism index. The results identify cross-country cultural
differences as a major determinant of the widespread residual momentum profits around the globe, and support the argument that residual momentum profitability may be more behaviorally driven. 英文關鍵詞: Residual momentum; cross-country cultural
行政院國家科學委員會補助專題研究計畫
□期中進度報告
■期末報告
國際股市之殘差動能
計畫類別:■個別型計畫 □整合型計畫
計畫編號:NSC 101-2410-H-004-057 -
執行期間: 101 年 08 月 01 日至 102 年 07 月 31 日
執行機構及系所:國立政治大學國際經營與貿易學系
計畫主持人:林信助
共同主持人:
計畫參與人員:王馨儀(碩士生)、劉允文(大學生)
本計畫除繳交成果報告外,另含下列出國報告,共 _2_ 份:
□移地研究心得報告
■出席國際學術會議心得報告
□國際合作研究計畫國外研究報告
處理方式:除列管計畫及下列情形者外,得立即公開查詢
□涉及專利或其他智慧財產權,□一年□二年後可公開查詢
中 華 民 國 102 年 09 月 11 日
國際股市之殘差動能
計畫編號 : NSC 101-2410-H-004-057-
執行期間 :中華民國 101 年 8 月 1 日至 102 年 7 月 31 日
主持人 : 林信助 (國立政治大學國際經營與貿易學系)
E-mail: [email protected]
執行單位 : 國立政治大學國際經營與貿易學系
摘要 本計畫主要研究 Blitz et al. (2011)所提出的殘差動能策略在國際股市的架構下是否依舊存在獲利 性,以及其與跨國文化差異之關係。利用 31 個 MSCI 國家個股的股票資料, 我們發現其中有 21 個國家在中間持有期間存在顯著為正的殘差動能溢酬。我們也更進一步地發現:這些顯著的跨國 殘差動能利潤差異與 Hofstede (2001) 所建構個人主義指標所代表的文化差異有顯著的正相關。這 個結果指出跨國文化差異乃國際股市間普遍存在之殘差動能利潤的一個主要決定因素,並且支持 「殘差動能利潤比較可能是由於行為面的因素所造成的」這個論調。 關鍵詞:殘差動能;跨國文化差異;個人主義指標 AbstractThis paper examines profitability of residual momentum strategy (Blitz, Huij, and Martens, 2011) and its relation with cross-country cultural differences. Using data on individual stocks from 38 MSCI countries, we find 21 of which exhibit significantly positive residual momentum premiums for intermediate-term holding periods. Furthermore, we discover significant cross-country differences in residual momentum profits, which are positively associated with cross-country cultural differences proxied by Hofstede’s (2001) individualism index. The results identify cross-country cultural differences as a major determinant of the widespread residual momentum profits around the globe, and support the argument that residual momentum profitability may be more behaviorally driven.
1 Introduction
The momentum investing, as firstly proposed by Jegadeesh and Titman (1993, 2001), is about the only asset pricing anomaly which is so prevalent, persistent, and cannot be explained by risk factors constructed by mimicking portfolio returns based on size and book-to-market equity ratio (Fama and French, 1996.) In addition to studying momentum profit in the U.S. market, many researchers have attempted to study momentum profitability in an international context, and found that momentum strategies work in international stock markets, yet their findings have not been uniform (see Rouwenhorst, 1998; Schiereck, DeBondt, and Weber, 1999; Hameed and Kusnadi, 2002; Kang, Liu, and Ni, 2002; Chui, Titman, and Wei, 2003; Griffin, Ji, and Martin, 2003; Hon and Tonks, 2003.) Typically , evidence for momentum profits is more pronounced in developed markets, and is weaker in Asian and emerging markets.
Given its empirical magnitude and statistical significance, momentum profitability has motivated researchers to explore behavioral explanations. Most notably, Barberis, Shleifer, and Vishny (1998), and Hong and Stein (1999) posit that when information arrives, traders are reluctant or slow to revise their prior beliefs about the security’s value, while Daniel, Hirshleifer, and Subrahmanyam (1998) propose that traders overreact to news when subsequent news confirms it, which is corrected in the long run. Along the same line, Chui, Titman, and Wei (2010) employ an individualism index developed by Hofstede (2001) in examining the extent to which momentum effect is generated by behavioral biases. They show that individualism is positively associated with trading volume and volatility, which is a typical sign of overconfidence and self-attribution. Consequently, they also discover that the magnitude of momentum profits is positively associated with the degree of individualism in each country, and conclude that cross-country cultural differences could be the reason why the international evidence on momentum profits has been mixed.
Meanwhile, researchers have also brought into question on whether the prevalent momentum profit is due to mis-specification of rational asset pricing models employed in studying momentum profit (see Grundy and Martin, 2001.) In response to this challenge, Blitz, Huij, and Martens (2011) propose a residual momentum strategy which is based on residual returns estimated using Fama and French’s (1993) three-factor model. With the data from the U.S., they show that residual momentum earns risk-adjusted profits that are about twice as large as those associated with total return momentum; is more consistent over time; and is less concentrated in the extremes of the cross-section of stocks. Blitz, Huij, and Martens (2011) conclude that their result is consistent with the gradual-information-diffusion hypothesis of Hong and Stein (1999), thus supporting the hypothesis that behavioral biases of investors are the driving forces of the momentum effect.
This paper combines two strands of literature, and attempts to ascertain whether the residual momentum strategy proposed by Blitz, Huij, and Martens (2011) is still profitable in an international context; and if so, whether such a phenomenon can be attributed to behavioral biases caused by cross-country cultural differences. Specifically, we hypothesize that if investors’ underreaction is more pronounced for firm-specific events than for common factors, as argued by Gutierrez and Pirinsky (2007) and Blitz, Huij, and Martens (2011), the residual momentum would be more profitable in countries which are more subjective to behavioral biases.
Using data on individual stocks from 38 MSCI countries, we find 21 of which exhibit significantly positive residual momentum premiums for intermediate-term holding periods. The result also suggests significant cross-country differences in residual momentum profits that persist over time. More interestingly, the differences can be explained by cross-country cultural
differences proxied by Hofstede’s (2001) individualism index. The return on a long-minus-short portfolio based on residual momentum averaged across countries with high individualism is higher than that averaged across countries with low individualism by about 0.5% per month. The difference is quantitatively similar and statistically significant for holding periods ranging from three to twelve months.
We further follow Chui, Titman, and Wei (2010) by employing a cross-sectional regression approach to examine the determinants of the cross-country differences in residual momentum returns, which enables us to simultaneously consider several country-specific variables that capture differences in cultural and market development across countries. With the inclusion of these country-specific variables, we find that the individualism still retains its significance, while the two market development measures of La Porta, Lopez-de-Silanes, and Shleifer (2006), and the anti-self-dealing index constructed by Djankov, La Porta, Lopez-de-Silanes, and Shleifer (2008) all fail to account for the residual momentum profits. Hence, our evidence from international markets reinforces the conjecture of Blitz, Huij, and Martens (2011) that residual momentum is more behaviorally driven.
Our findings contribute to the literature in two aspects. First, we provide supportive evidence for the residual momentum proposed by Blitz, Huij, and Martens (2011) based on a broader sample that contains international data. Since residual momentum profit exists in most countries, our result can be served as a piece of out-of-sample evidence that supports the finding of Blitz, Huij, and Martens (2011). Second, although Blitz, Huij, and Martens (2011) argue that residual momentum profitability may be more behaviorally driven, they do not specifically examine the source of profit. This paper, however, provides direct evidence to show that the cross-country difference of residual momentum returns is positively related to individualism, suggesting that behavioral theories seem to better underpin residual momentum profitability.
The remainder of the paper is organized as follows. In Section 2, we describe the data used in this paper and the construction of the residual momentum strategy. Section 3 documents and examine residual momentum profits for each country, as well as their relationship with individualism based on portfolio and regression analyses. Section 4 presents results from robustness checks, and Section 5 concludes the paper.
2 Data and the construction of the residual momentum strategy 2.1 Data description
The sample consists of individual stock data across developed MSCI countries. With the exception of the U.S. sample that comes from the Center for Research in Security Prices (CRSP), we retrieve monthly return and accounting data from the Datastream International. The sample period is from January 1981 to December 2009. The starting date for each country varies according to the availability of data on the Datastream International. We include all common stocks, both domestic and foreign, which are listed on the major stock exchanges in each country. A cross-listed stock is included only in its home country sample. We take the month-end exchange rate to convert return and accounting data denominated in local currency into U.S. dollar. As in Ince and Porter (2006) and Chui, Titman, and Wei (2010), the returns from Datastream data that are larger (less) than 100% (-95%) are set to be 100% (-95%). To have sufficient stocks to form residual momentum portfolios, we require each country to have at least 30 stocks that meet our stock selection criteria in any month during our sample period.
To measure the cross-country cultural differences, we use Hofstede’s (2001) individualism index to capture the degree of investor overconfidence for each country. Based on a
cross-country psychological survey on IBM employees in 72 countries, the index is constructed from the country mean scores on 14 questions about the employees’ attitudes toward their work and private lives. A higher index value indicates stronger individualism. To measure the degree of investor overconfidence, we require each country to have its own individualism index. In addition to individualism, we consider some variables that can plausibly be related to momentum and that can vary across countries. These include variables that may be related to the development and integrity of the countries’ financial markets. Specifically, we use the index of access to equity markets from La Porta, Lopez-de-Silanes, and Shleifer (2006), and the anti-self-dealing index constructed by Djankov, La Porta, Lopez-de-Silanes, and Shleifer (2008). The former measures the ease of raising external funds, while the latter measures the level of legal protection of investors. Because of these screening criteria, our final sample includes 38 countries.
[Insert Table 1 about here]
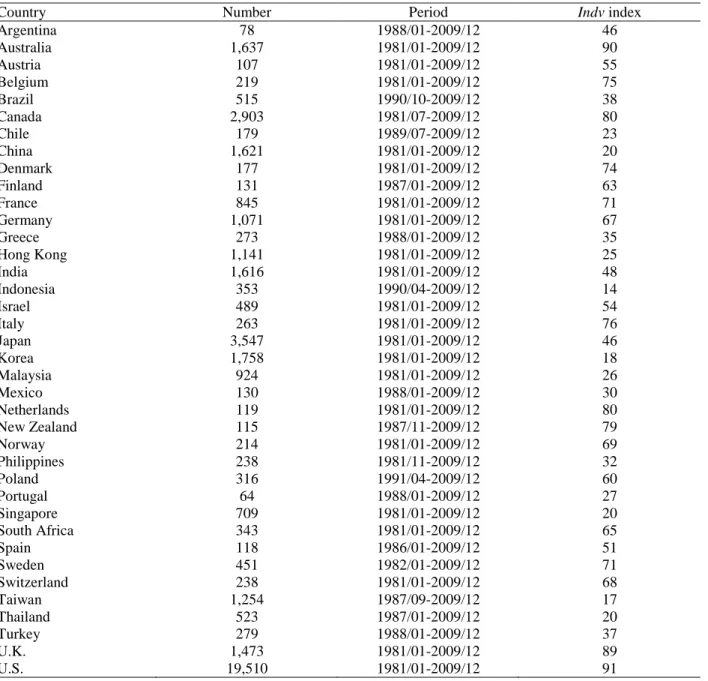
Table 1 lists countries included in our study along with their scores on the individualism index. Among the 38 countries included in our sample, the U.S. has the highest score (91) while Indonesia has the lowest score (14). Table 1 also reports the total number of stocks and sample period for each country. The total number of stocks included in our sample is 45,941.
2.2 Construction of the residual momentum strategy
We follow Blitz, Huij, and Martens (2011) in constructing the residual momentum strategy for each of the 38 countries. For each stock, we obtain residual returns using the country-specific Fama-French three-factor model:
, , , ,1 , ,2 , ,3 , , , ,
i j t f t i i j t i j t i j t i j t
r −r =α β+ RMRF +β SMB +β HML +ε (1)
where ri j t, , is the return on stock i which belongs to country j in month t, r is the risk-free f t,
rate in month t, RMRF , j t, SMB , and j t, HML are the excess returns on the factor mimicking j t,
portfolios for the market, size and value in month t, constructed based on all stocks in country j, respectively, and εi,j,t is the residual return of stock i of country j in month t. We estimate
regressions over 36-month rolling windows.
We then allocating all stocks within the same country into ten mutually exclusive decile portfolios based on their residual returns over the preceding 12 months excluding the most recent month (hereafter denoted as 12-1M). With the portfolios based on residual momentum, the top (bottom) decile contains the 10% of stocks with the highest (lowest) 12-1M residual returns standardized by their standard deviation over the same period. Since raw residual returns may be too noisy, such standardization procedure enables us to obtain an improved measure of the extent to which a given firm-specific return shock is actually news (Gutierrez and Pirinsky, 2007; Blitz, Huij, and Martens, 2011.) We define winner (loser) portfolio return as the equally-weighted return of the top (bottom) decile portfolio based on 12-1M residual returns. As in Jegadeesh and Titman (1993, 2001) and Blitz, Huij, and Martens (2011), the residual momentum strategy involves buying the winner portfolio and selling short the loser portfolio for the subsequent K months (K = 3, 6, 9, 12) with an overlapping scheme. In each month t, residual momentum return is calculated as the difference between the winner and loser portfolio returns, averaged across K separate positions, each formed in one of the K consecutive prior months from t-K to t-1.
In this section, we first investigate whether residual momentum exhibits significantly positive returns for each of the 38 countries. We also construct two sets of cross-country average returns to examine the overall residual momentum effect in a global framework. To further explain the across-country differences in residual momentum returns, we investigate the relation between individualism and the profitability of the residual momentum strategy across countries based on both portfolio and regression analyses.
3.1 Residual momentum returns across countries
We report residual momentum returns for each of the 38 countries in Table 2. The results indicate that all but eight countries (Argentina, China, Indonesia, Israel, Japan, Korea, Thailand, and Turkey) exhibit positive momentum returns for all holding horizons. Among which, 21 countries demonstrate significantly positive returns for all four holding horizons.
[Insert Table 2 about here]
To examine the overall residual momentum effect around the world, we follow Chui, Titman, and Wei (2010) in constructing two sets of combined portfolios across the 38 countries. The first one is the country-average portfolio, which is constructed with equal weights on each country-specific residual momentum portfolio. The second one is referred to as the composite
portfolio, which is weighted more toward countries with more stocks, i.e., the weights are
determined by the number of stocks within each country. The average returns of the two portfolios are also reported in Table 2. The country-average portfolio earns significantly positive returns of 0.962% (t-statistic = 8.83), 0.852% (t-statistic = 8.58), 0.655% (t-statistic = 6.97), and 0.521% (t-statistic = 6.01) per month for the 3-, 6-, 9-, and 12-month holding periods, respectively. The average returns for the composite portfolio are 0.773% (t-statistic = 6.86), 0.685% (t-statistic = 6.29), 0.515% (t-statistic = 4.89), and 0.382% (t-statistic = 3.89) per month for the 3-, 6-, 9-, and 12-month holding periods, respectively. The magnitude of the country-average portfolio return is similar to that of the composite portfolio, suggesting that the numbers of stocks within each country have limited influence on residual momentum returns. 3.2 Individualism and residual momentum returns: Portfolio analysis
In this section, we investigate the relation between individualism and residual momentum profitability across countries based on portfolio analyses. We first rank countries into two equal groups based on their scores on the individualism index (denoted as Indv.) Countries with their
Indv ranked at the top 50% are allocated into the high-Indv portfolio, while those with their Indv
ranked at the bottom 50% are allocated into the low-Indv portfolio. We then follow the methodology described in Section 3.1 to construct country-average portfolios and composite portfolios in each Indv-sorted group of countries.
[Insert Table 3 about here]
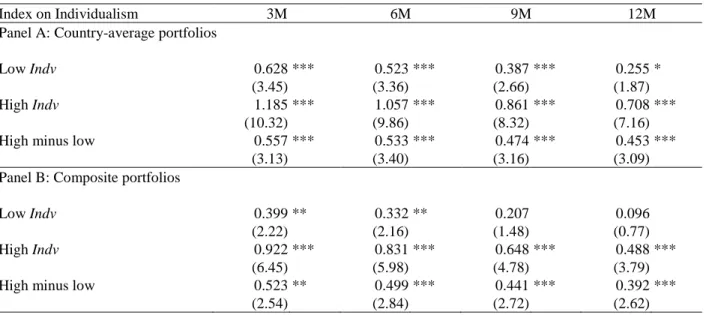
Table 3 presents the average monthly returns for 3-, 6-, 9-, and 12-month holding periods on the Indv-sorted residual momentum portfolios. For the country-average portfolios reported in Panel A, high-Indv and low-Indv strategies both exhibit significantly positive returns across all horizons. The 3-, 6-, 9-, and 12-month returns for the low-Indv strategy are 0.628%, 0.523%, 0.387%, and 0.255%, while those for the high-Indv strategy are 1.185%, 1.057%, 0.861%, 0.708%. Despite of the significance of momentum returns for the two groups, there exists a pattern that high-Indv countries tend to outperform low-Indv countries, which is observable from the difference between the two groups. The 3-, 6-, 9-, and 12-month momentum returns on the
high-minus-low strategy are 0.557% (t-statistic = 3.13), 0.533 % (t-statistic = 3.40), 0.474 % (t-statistic = 3.16), and 0.453 % (t-statistic = 3.09), respectively.
For results of composite portfolios reported in Panel B of Table 3, we observe similar patterns as in Panel A, but with slightly smaller magnitude of returns. The high-Indv portfolio earns significantly positive momentum returns across all holding periods, while the low-Indv portfolio has positive and significant returns in 3- and 6-month horizons, but insignificant returns in 9- and 12-month horizons. The 3-, 6-, 9-, and 12-month differences between high- and low-Indv groups for the composite portfolios are 0.523% (t-statistic = 2.54), 0.499% (t-statistic = 2.84), 0.441% (t-statistic = 2.72), and 0.392% (t-statistic = 2.62), respectively. The results show that residual momentum is more profitable in countries with high individualism than in countries with low individualism, supporting our conjecture that residual momentum profitability is better characterized by behavioral theories, irrespective of the portfolio formation schemes.
We perform the above analyses using 10% cutoffs of residual returns in identifying winner and loser portfolios within each country. Given that there are 38 countries in our sample, we cannot rule out the possibility that our results might be contaminated by some extreme returns existing in countries with fewer numbers of stocks. To reduce severity of such a problem, we repeat our analyses by using 30% cutoffs of residual returns in identifying winner and loser portfolios for each country as a robustness check. Similarly, we allocate countries into two equal groups based on their scores on the individualism index, and construct country-average portfolios and composite portfolios in each Indv-sorted group. Table 4 reports the portfolio returns.
[Insert Table 4 about here]
In comparison, the overall results in Table 4 are similar to those in Table 3. The residual momentum returns in high-Indv portfolios outperforms those in low-Indv portfolio across all holding periods, for both country-average portfolios and composite portfolios. The only difference is that residual momentum returns reported in Table 4 are all smaller than their corresponding counterparts reported in Table 3. In other words, residual momentum effects are strengthened when we concentrate on the top and bottom 10% of stocks. Nevertheless, our results are qualitatively unaffected by the use of 30% cutoffs.
3.3 Determinants of cross-country residual momentum returns: Regression analysis
So far, we have demonstrated a positive relation between individualism and residual momentum profitability. One may wonder whether residual momentum returns are related to some other country characteristics than individualism. Recall from residual momentum returns reported in Table 2, we observe that they are significantly higher in developed countries, but are insignificant or even negative in most emerging countries. Would it be possible that the cross-country residual momentum returns are related to the status of market development? To examine this possibility, we simultaneously consider several country-specific variables based on regression analyses.
To be included as possible determinants of cross-country residual momentum returns, we first consider two variables taken from La Porta, Lopez-de-Silanes, Shleifer (2006) to proxy for the extent of access to equity markets.1 The first measure is the index of access to equity markets (denoted as Equity), which is constructed based on the annual surveys of business
1
Titman, Wei, and Xie, (2012) also use the two measures to proxy for the extent of market development. Arguing from the viewpoint that investors tend to overinvest in environments with easier access to equity markets, they find that the two measures explain the cross-country differences in the asset-growth anomaly.
executives’ qualitative assessment of firms’ ability to raise equity in local stock markets. A higher value of Equity represents easier access to equity markets. The other measure of access to equity markets is the ratio of stock market capitalization to gross domestic product (GDP) scaled by the fraction of the stock market held by outside investors (denoted as MKT/GDP), averaged over the period from 1996 to 2003. Likewise, a higher value of MKT/GDP represents easier access to equity markets.
In addition to access-to-market measures, we also adopt the anti-self-dealing index (denoted as SelfDealing) constructed by Djankov, La Porta, Lopez-de-Silanes, and Shleifer (2008) as the measure of legal protection of investors. This index is calculated for 72 countries based on legal rules prevailing in 2003, and focuses on private enforcement mechanisms that govern a specific self-dealing transaction. Specifically, the index is formed by taking the average of ex ante and ex post private control of self-dealing indices, with a high score indicating a tighter regulation on insiders' self-dealing and a better protection of investors. We follow Chui, Titman, and Wei (2010) in performing the following regressions that include these variables:
, 0 1 2 3 / 4 ,,
j t j j j j j t
Mom =α +β Indv +β Equity +β MKT GDP +β SelfDealing +ε (2) where Mom is residual momentum return of country j in month t, j t, Indv is the individualism j
index of country j, Equity and j MKT GDP are the access-to-market measures of country j, / j
and SelfDealing is the anti-self-dealing index of country j. Here we use four sets of the j
momentum returns (Mom ) with holding periods of 3, 6, 9, and 12 months as dependent j t,
variables, respectively. As in Chui, Titman, and Wei (2010), we use Fama and MacBeth’s (1973) procedure to estimate equation (2). We perform the regressions every month, and calculate the time-series averages for these coefficients. The t-statistics of the averages of the time-series estimates are adjusted for heteroskedasticity and autocorrelation with Newey and West’s (1994) correction procedure.
[Insert Table 5 about here]
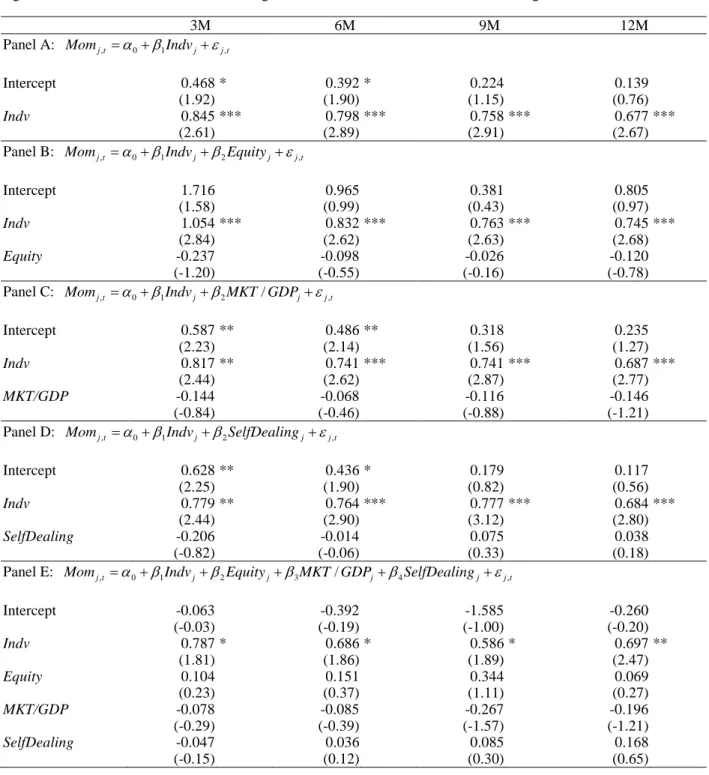
Table 5 reports estimation results. Panel A presents the result of using Indv as the only independent variable. Consistent with previous findings, the estimated coefficients on Indv are all significantly positive across all horizons. In Panels B, C, and D, we include Indv and one of the three control variables, respectively. The results suggest that the inclusion of each of the access-to-market or anti-self-dealing variables does not affect the significance of coefficients on
Indv. However, access-to-market or anti-self-dealing variables all fail to account for the
cross-country differences in residual momentum returns, when Indv is also included in the regressions. Estimation results that include all control variables are presented in Panel E. Again, we find that the estimated coefficient on Indv remains as the only significant determinant of residual momentum returns. Overall, the regression results suggest that individualism is the most important determinant in explaining the cross-country differences of residual momentum returns. 4 Robustness Checks
In this section, we provide several robustness tests to strengthen the relevance of our results. First, we show that the relation between individualism and residual momentum returns are robust in two subperiods. We then show that our result sustains even when an alternative individualism index of House et al. (2004) is employed in the analyses. Finally, we reconstruct residual momentum portfolios for each country by using a global-version of Fama-French model in calculating residual returns, and demonstrate that risk adjustment process is not a serious concern for residual momentum in an international context.
4.1 Subperiod analysis
To examine whether our results are specific to any particular sample period, we perform the subsample analysis based on portfolio returns constructed in Section 3.2. We select December 1997 as the cutoff point, and divide the full sample into pre- and post-1998 periods. Table 6 reports the Indv-sorted residual momentum returns based on the country-average portfolio (Panel A) and the composite portfolio (Panels B) for the two subperiods. For both country-average portfolios and composite portfolios, the average monthly returns (for K = 3, 6, 9, 12) on high- and low-Indv groups are all smaller in the post-1998 period than in the pre-1998 period. However, differences between high- and low-Indv groups are quantitatively similar in the two periods for the country-average portfolio. For example, the 6-month holding-period high-minus-low return is 0.565% (t-statistic = 2.40) for the 1981-1997 period, and is 0.512% (t-statistic = 2.49) for the 1998-2009 period. The result for the composite portfolio is less robust across the two subsamples. Differences between high- and low-Indv groups in the 1981-1997 period are about twice as large as those in the 1998-2009 period. Despite the insignificance of the differences, high-minus-low returns are still positive for all horizons in the 1998-2009 period. Thus, the overall result shows that the relation between individualism and residual momentum returns are quite robust to subperiods.2
[Insert Table 6 about here] 4.2 An alternative individualism index of House et al. (2004)
As another robustness check, we consider an alternative individualism index constructed from the GLOBE (Global Leadership and Organizational Behavior Effectiveness) project. We follow Chui, Titman, and Wei (2010) by using the country scores from GLOBE’s institutional collectivism index developed by House et al. (2004) to classify individual countries into high-
and low-individualism groups.3 We are able to find scores from GLOBE’s institutional
collectivism index for 35 out of the 38 countries in our sample. With GLOBE’s institutional
collectivism index (denoted as IndvGLOBE), we reconstruct portfolio returns sorted by
individualism for both country-average portfolios and composite portfolios, and report the results in Table 7.4
[Insert Table 7 about here]
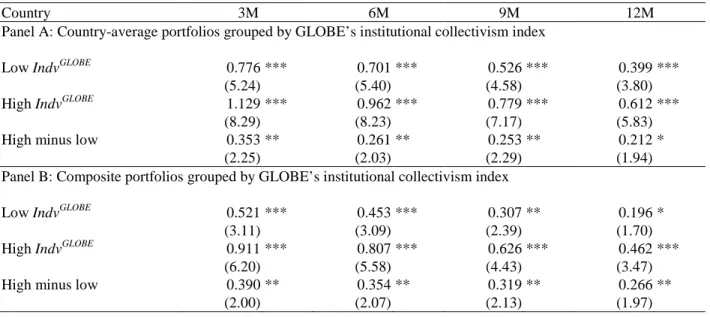
Consistent with our previous findings, the results reported in Table 7 reveal significantly positive returns on the differences between high- and low-IndvGLOBE groups across all holding horizons, for both country-average portfolios (Panel A) and composite portfolios (Panel B). The result suggests that our findings are not restricted to the use of Hofstede’s (2001) individualism index as a proxy for cultural difference.
4.3 Residual momentum constructed based on a global-version of the Fama-French model
2 We also estimate the Fama-MacBeth regressions specified in Equation (2) separately for the two subsamples, and
find that the coefficients on Indv are significantly positive. The results are not reported here to save space, and are available upon request.
3 IndvGLOBE =(GLOBE’sinstitutional collectivism index) multiplied by -1. A higher score indicates a higher degree of individualism. These data are retrieved from the website of the GLOBE project for the College of Business at New Mexico State University. See http://business.nmsu.edu/programs-centers/globe/instruments/.
4
We also perform the Fama-MacBeth regressions by using IndvGLOBE instead of Indv as the independent variable, and find that the coefficients on IndvGLOBE are significantly positive. Those results are also available upon request.
In international asset-pricing literature, whether asset returns are better characterized by local or global asset-pricing models is an important yet inconclusive issue. The residual momentum strategies across countries in previous sections of this paper are constructed based on country-specific (local) Fama-French three-factor models. This is because the local version of Fama-French model has been documented to better explain the cross-sectional variations of international stock returns than the global version of Fama-French model (see Griffin, 2002; Fama and French, 2012.) Nevertheless, arguing from the viewpoint that global factors are related to risk models, Fama and French (1998) and Hou, Karolyi, and Kho (2011) show supportive evidence for the pricing ability of a global version of asset-pricing model. Hence, to examine whether our results are robust to the world-wide risk exposure, we redo the analyses by replacing Equation (1) with the following equation:
, , , ,1 ,2 ,3 , , ,
i j t f t i i t i t i t i j t
r −r =α β+ GRMRF +β GSMB +β GHML +ε (3) where GRMRFt, GSMBt, and GHMLt are the dollar-denominated value-weighted averages of
returns on the country-specific RMRF, SMB, and HML factors in month t.5 Once residual returns are estimated, we repeat procedures in Section 2.2 to construct country-specific residual momentum strategies.
Panel A of Table 8 reports the 3-, 6-, 9-, and 12-month holding-period average returns on country-average and composite residual momentum portfolios that are averaged across all countries. Compared with the returns reported in Table 2, the global residual momentum strategies yield smaller but still significantly positive returns. This suggests that the risk exposure to the covariance risk model has limited influence on residual momentum profitability across countries.
To further examine the relation between Hofstede’s (2001) individualism index and the cross-country differences of the returns on the global residual momentum, we form country-average portfolios and composite portfolios for high- and low-Indv groups, and calculate the high-minus-low returns for holding periods of 3, 6, 9, and 12 months. The results are reported in Panels B and C of Table 8. Again, we find the profitability of high-Indv residual-momentum portfolio is higher than that of low-Indv residual-momentum portfolio, consistent with previous findings.
[Insert Table 8 about here]
We also perform Fama-MacBeth regressions for the global residual-momentum returns on the individualism index and other determinants described in Section 3.3, and present the results in Table 9. The results reveal that the coefficients on Indv are all significantly positive at the 5% significance level, with or without the inclusion of other control variables, namely Equity,
MKT/GDP, and SelfDealing.
[Insert Table 9 about here] 5 Conclusions
Blitz, Huij, and Martens (2011) propose a new momentum strategy based on residual returns estimated with Fama and French’s (1993) three-factor model, and find that the strategy earns risk-adjusted profits that are about twice as large as those associated with total return momentum in the U.S. market. Arguing from the gradual-information-diffusion hypothesis of
5
The constructions of the global factors are similar to the methods adopted in Griffin (2002) and Fama and French (1998, 2012).
Hong and Stein (1999), they hypothesize that the profitability of the residual momentum is driven by behavioral biases of investors.
Using international data from 38 MSCI countries, we empirically show that the residual momentum strategy proposed by Blitz, Huij, and Martens (2011) is profitable in 21 of the 38 countries. To test the hypothesis that the source of the residual momentum is behaviorally driven, we examine whether the cross-country difference in residual momentum returns is related to the individualism index developed by Hofstede (2001). As our analysis demonstrates, countries with higher individualism generate higher residual momentum returns than those with lower individualism. Several robustness tests are conducted to support our findings.
Our evidence contributes to the momentum-investing literature in two aspects. First, in addition to providing a robustness check that extends Blitz, Huij, and Martens’s (2011) work to an international context, a cross-country study that sheds light on how cultural differences affect momentum profitability provides a challenge to the efficiency of financial markets (Chui, Titman, and Wei, 2010). Second, similar to Chui, Titman, and Wei’s (2010) findings, our results indicate that investors in more individualistic cultures also tend to put more weight on the ‘firm-specific’ information in constructing their own strategies.
References
Barberis, N., Shleifer, A., Vishny, R., 1998. A model of investor sentiment. Journal of Financial Economics 49, 307-343.
Blitz, D., Huij, J., Martens, M., 2011. Residual momentum. Journal of Empirical Finance 18, 506-521.
Chan, K., Hameed, A., Tong, W., 2000. Profitability of momentum strategies in the international equity markets. Journal of Financial and Quantitative Analysis 35, 153-172.
Chui, C.W.A., Titman, S., Wei, K.C.J., 2003. Momentum, legal systems and ownership structure: An analysis of Asian stock markets. Working paper, University of Texas at Austin.
Chui, C.W.A, Titman, S., Wei, K.C.J., 2010. Individualism and momentum around the world. Journal of Finance 65, 361-392.
Cooper, M.J., Gutierrez Jr., R., Hameed, A., 2004. Market states and momentum. Journal of Finance 59, 1345-1365.
Daniel, K., Hirshleifer, D., Subrahmanyam, A., 1998. Investor psychology and security market under- and overreactions. Journal of Finance 53, 1839-1886.
Djankov, S., La Porta, R., Lopez-de-Silanes, F., Shleifer, A., 2008. The law and economics of self-dealing. Journal of Financial Economics 88, 430-465.
Fama, E.F., French, K.R., 1993. Common risk factors in the returns on stocks and bonds. Journal of Financial Economics 33, 3-56.
Fama, E.F., French, K.R., 1998. Value versus growth: The international evidence. Journal of Finance 53, 1975-1999.
Fama, E.F., French, K.R., 2012. Size, value, and momentum in international stock returns. Journal of Financial Economics 105, 457-472.
Fama, E.F., MacBeth, J., 1973. Risk, return and equilibrium: Empirical tests. Journal of Political Economy 81, 607-636.
Griffin, J.M., 2002. Are the Fama and French factors global or country specific? Review of Financial Studies 3, 783-803.
Griffin, J.M., Ji, X., Martin, J.., 2003. Momentum investing and business cycle risk: Evidence from pole to pole. Journal of Finance 58, 2515-2547.
Grundy, B., Martin, S., 2001. Understanding the nature of the risks and the source of the rewards to momentum investing. Review of Financial Studies 14, 29-78.
Gutierrez, R.C., Pirinsky, C.A., 2007. Momentum, reversal, and the trading behaviors of institutions. Journal of Financial Markets 10, 48-75.
Hameed, A., Kusnadi, Y., 2002. Momentum strategies: Evidence from Pacific Basin stock markets. Journal of Financial Research 25, 383-397.
Hofstede, G., 2001. Culture’s consequences: Comparing values, behaviors, institutions, and organizations across nations, 2nd eds. Sage Publication, Beverly Hills, CA.
Hon, M., Tonks, I., 2003. Momentum in the UK stock market. Journal of Multinational Financial Management 13, 43-70.
Hong, H., Stein, J., 1999. A unified theory of underreaction, momentum trading and overreaction in asset markets. Journal of Finance 54, 2143-2184.
Hou, K., Karolyi, G.A., Kho, B.C., 2011. What factors drive global stock returns? Review of Financial Studies 24, 2527-2574.
House, R., Hanges, P., Javidan, M., Dorfman, P., Gupta, V., 2004. Culture, leadership, and organizations: The GLOBE study of 62 societies. Sage Publication, Thousand Oaks, CA. Ince, O., Porter, R.B., 2006. Individual equity return data from Thomson Datastream: Handle
with care. Journal of Financial Research 29, 463-479.
Jegadeesh, N., Titman, S., 1993. Returns to buying winners and selling losers: Implications for stock market efficiency. Journal of Finance 43, 65-91.
Jegadeesh, N., Titman, S., 2001. Profitability of momentum strategies: An evaluation of alternative explanations. Journal of Finance 56, 699-720.
Kang, J., Liu, M.-H., Ni, S.X., 2002. Contrarian and momentum strategies in the China stock market: 1993-2000. Pacific Basin Finance Journal 10, 243-265.
La Porta, R., Lopez-de-Silanes, F., Shleifer, A., 2006. What works in securities laws? Journal of Finance 61, 1-32.
Moskowitz, T., Grinblatt, M., 1999. Do industries explain momentum? Journal of Finance 54, 1249-1290.
Newey, W.K., West, K.D., 1994. Automatic lag selection in covariance matrix estimation. Review of Economic Studies 61, 631-654.
Rouwenhorst, K.G., 1998. International momentum strategies. Journal of Finance 53, 267-284. Rouwenhorst, K.G., 1999. Local return factors and turnover in emerging stock markets. Journal
of Finance 54, 1439-1464.
Schiereck, D., DeBondt, W., Weber, M., 1999. Contrarian and momentum strategies in Germany. Financial Analysts Journal 55, 104-16.
Titman, S., Wei, K.C.J., Xie, F., 2012. Market development and the asset growth effect: International evidence. Journal of Financial and Quantitative Analysis, forthcoming.
Table 1: Summary statistics of country data
This table reports the list of countries included in our sample. We report the total number of stocks, sample period, as well as the score on Hofstede’s (2001) individualism index for each country. Except for the U.S. market, all our data are collected from Datastream International. For the U.S. market, the data are obtained from the CRSP database.
Country Number Period Indv index
Argentina 78 1988/01-2009/12 46 Australia 1,637 1981/01-2009/12 90 Austria 107 1981/01-2009/12 55 Belgium 219 1981/01-2009/12 75 Brazil 515 1990/10-2009/12 38 Canada 2,903 1981/07-2009/12 80 Chile 179 1989/07-2009/12 23 China 1,621 1981/01-2009/12 20 Denmark 177 1981/01-2009/12 74 Finland 131 1987/01-2009/12 63 France 845 1981/01-2009/12 71 Germany 1,071 1981/01-2009/12 67 Greece 273 1988/01-2009/12 35 Hong Kong 1,141 1981/01-2009/12 25 India 1,616 1981/01-2009/12 48 Indonesia 353 1990/04-2009/12 14 Israel 489 1981/01-2009/12 54 Italy 263 1981/01-2009/12 76 Japan 3,547 1981/01-2009/12 46 Korea 1,758 1981/01-2009/12 18 Malaysia 924 1981/01-2009/12 26 Mexico 130 1988/01-2009/12 30 Netherlands 119 1981/01-2009/12 80 New Zealand 115 1987/11-2009/12 79 Norway 214 1981/01-2009/12 69 Philippines 238 1981/11-2009/12 32 Poland 316 1991/04-2009/12 60 Portugal 64 1988/01-2009/12 27 Singapore 709 1981/01-2009/12 20 South Africa 343 1981/01-2009/12 65 Spain 118 1986/01-2009/12 51 Sweden 451 1982/01-2009/12 71 Switzerland 238 1981/01-2009/12 68 Taiwan 1,254 1987/09-2009/12 17 Thailand 523 1987/01-2009/12 20 Turkey 279 1988/01-2009/12 37 U.K. 1,473 1981/01-2009/12 89 U.S. 19,510 1981/01-2009/12 91
Table 2: Average returns of residual momentum for individual countries
At the end of each month, all stocks in each country are ranked in ascending order based on their residual returns over the preceding 12 months excluding the most recent month, which are estimated using the country-wide Fama-French three-factor model. Stocks in the top decile are assigned to the winner portfolio and those in the bottom decile to the loser portfolio. We calculate the equally-weighted returns for these portfolios. The residual momentum strategy involves buying the winner portfolio and selling short the loser portfolio for the subsequent K months (K = 3, 6, 9, 12) with an overlapping scheme. The country-average portfolio is a portfolio that puts equal weight on each country-specific residual momentum portfolio in this portfolio. The composite portfolio is weighted based on the number of stocks in the country. The t-statistics adjusted for heteroskedasticity and autocorrelation using the Newey-West (1994) procedure are in parentheses. * denotes significance at the 10% level, ** denotes significance at the 5% level and *** denotes significance at the 1% level.
Country 3M 6M 9M 12M Argentina 0.762 -0.172 -0.673 -0.934 (0.92) (-0.27) (-1.18) (-1.58) Australia 1.293 *** 1.126 *** 0.978 *** 0.776 *** (4.09) (3.98) (3.77) (3.13) Austria 1.621 *** 1.194 *** 0.916 ** 0.730 * (3.52) (2.95) (2.35) (1.92) Belgium 0.867 ** 0.870 *** 0.728 *** 0.640 *** (2.42) (2.81) (2.73) (2.63) Brazil 1.216 *** 1.041 *** 0.737 ** 0.459 (2.66) (2.80) (2.17) (1.48) Canada 0.865 *** 0.868 *** 0.641 *** 0.421 * (2.95) (3.30) (2.72) (1.93) Chile 0.558 * 0.334 0.030 0.019 (1.68) (1.10) (0.11) (0.07) China 0.644 -0.101 -0.164 -0.109 (0.86) (-0.14) (-0.21) (-0.14) Denmark 1.548 *** 1.289 *** 0.893 *** 0.641 *** (5.40) (4.69) (3.64) (2.77) Finland 0.390 0.559 0.429 0.368 (0.74) (1.28) (1.06) (1.01) France 1.179 *** 1.224 *** 1.018 *** 0.771 *** (4.62) (4.96) (4.37) (3.52) Germany 1.201 *** 1.059 *** 0.993 *** 0.891 *** (6.50) (6.02) (5.66) (5.24) Greece 0.976 0.657 0.599 0.435 (1.61) (1.19) (1.23) (0.94) Hong Kong 1.035 ** 1.058 *** 0.776 ** 0.471 (2.58) (3.17) (2.48) (1.61) India 0.800 0.765 0.877 ** 0.729 * (1.42) (1.56) (1.98) (1.85) Indonesia -0.261 -0.107 0.013 -0.089 (-0.55) (-0.23) (0.03) (-0.20) Israel 0.687 0.651 0.209 -0.092 (1.55) (1.59) (0.60) (-0.29) Italy 0.932 *** 0.930 *** 0.810 *** 0.692 *** (3.59) (3.75) (3.57) (3.33) Japan -0.089 -0.084 -0.171 -0.167 (-0.41) (-0.44) (-0.99) (-1.07) Korea 0.420 0.078 -0.101 -0.239 (1.18) (0.25) (-0.35) (-0.84) Malaysia 0.496 0.550 0.463 0.117 (0.85) (0.99) (0.89) (0.24) Mexico 1.334 ** 0.900 ** 0.807 ** 0.771 ** (2.45) (2.13) (2.34) (2.35) Netherlands 0.769 ** 0.679 ** 0.607 ** 0.457 * (2.54) (2.31) (2.22) (1.80) New Zealand 1.416 *** 1.399 *** 1.562 *** 1.499 *** (2.78) (3.25) (3.93) (4.15)
Table 2 Continued Country 3M 6M 9M 12M Norway 1.330 *** 1.014 ** 0.875 ** 0.715 * (2.84) (2.41) (2.10) (1.74) Poland 1.854 ** 1.074 0.739 0.459 (2.17) (1.54) (1.16) (0.79) Portugal 1.366 * 1.360 ** 1.430 *** 1.349 *** (1.97) (2.35) (2.73) (3.27) Singapore 0.575 0.680 * 0.468 0.454 (1.36) (1.70) (1.38) (1.45) South Africa 1.531 *** 1.303 *** 1.057 *** 0.873 *** (4.47) (3.97) (3.51) (3.40) Spain 1.254 *** 1.211 *** 0.965 *** 0.815 ** (2.87) (2.87) (2.61) (2.32) Sweden 1.392 *** 1.174 *** 0.884 ** 0.708 ** (3.71) (3.30) (2.59) (2.22) Switzerland 1.266 *** 0.971 *** 0.614 ** 0.435 * (4.25) (3.51) (2.43) (1.92) Taiwan 0.805 0.605 0.420 0.273 (1.39) (1.19) (0.91) (0.65) Thailand 0.636 ** 0.204 -0.091 -0.312 (2.22) (0.79) (-0.39) (-1.35) Turkey -1.139 -0.944 -0.560 -0.771 (-1.35) (-1.32) (-0.87) (-1.32) U.K. 1.210 *** 1.107 *** 0.968 *** 0.824 *** (6.13) (6.08) (5.45) (4.72) U.S. 0.709 *** 0.615 *** 0.440 ** 0.299 * (3.39) (3.05) (2.30) (1.70) Country-average 0.962 *** 0.852 *** 0.655 *** 0.521 *** (8.83) (8.58) (6.97) (6.01) Composite 0.773 *** 0.685 *** 0.515 *** 0.382 *** (6.86) (6.29) (4.89) (3.89)
Table 3: Returns of residual momentum grouped by individualism
At the end of each month, all stocks in each country are ranked in ascending order based on their residual returns over the preceding 12 months excluding the most recent month, which are estimated using the country-wide Fama-French three-factor model. Stocks in the top decile are assigned to the winner portfolio and those in the bottom decile to the loser portfolio. We calculate the equally-weighted returns for these portfolios. The residual momentum strategy involves buying the winner portfolio and selling short the loser portfolio for the subsequent K months (K = 3, 6, 9, 12) with an overlapping scheme. We first rank countries into two equal groups based on their scores on the individualism index (denoted as Indv). Countries with their Indv ranked at the top 50% are allocated into the high-Indv portfolio, while those with their Indv ranked at the bottom 50% are allocated into the low-Indv portfolio. The country-average portfolio is a portfolio that puts equal weight on each country-specific residual momentum portfolio in this portfolio. The composite portfolio is weighted based on the number of stocks in the country. The t-statistics adjusted for heteroskedasticity and autocorrelation using the Newey-West (1994) procedure are in parentheses. * denotes significance at the 10% level, ** denotes significance at the 5% level and *** denotes significance at the 1% level.
Index on Individualism 3M 6M 9M 12M Panel A: Country-average portfolios
Low Indv 0.628 *** 0.523 *** 0.387 *** 0.255 * (3.45) (3.36) (2.66) (1.87) High Indv 1.185 *** 1.057 *** 0.861 *** 0.708 ***
(10.32) (9.86) (8.32) (7.16) High minus low 0.557 *** 0.533 *** 0.474 *** 0.453 ***
(3.13) (3.40) (3.16) (3.09) Panel B: Composite portfolios
Low Indv 0.399 ** 0.332 ** 0.207 0.096 (2.22) (2.16) (1.48) (0.77) High Indv 0.922 *** 0.831 *** 0.648 *** 0.488 ***
(6.45) (5.98) (4.78) (3.79) High minus low 0.523 ** 0.499 *** 0.441 *** 0.392 ***
Table 4: Returns of residual momentum using 30% cutoff grouped by individualism
At the end of each month, all stocks in each country are ranked in ascending order based on their residual returns over the preceding 12 months excluding the most recent month, which are estimated using the country-wide Fama-French three-factor model. Stocks in the top 30% are assigned to the winner portfolio and those in the bottom 30% to the loser portfolio. We calculate the equally-weighted returns for these portfolios. The residual momentum strategy involves buying the winner portfolio and selling short the loser portfolio for the subsequent K months (K = 3, 6, 9, 12) with an overlapping scheme. We first rank countries into two equal groups based on their scores on the individualism index (denoted as Indv). Countries with their Indv ranked at the top 50% are allocated into the high-Indv portfolio, while those with their Indv ranked at the bottom 50% are allocated into the low-Indv portfolio. The country-average portfolio is a portfolio that puts equal weight on each country-specific residual momentum portfolio in this portfolio. The composite portfolio is weighted based on the number of stocks in the country. The
t-statistics adjusted for heteroskedasticity and autocorrelation using the Newey-West (1994) procedure are in
parentheses. * denotes significance at the 10% level, ** denotes significance at the 5% level and *** denotes significance at the 1% level.
Index on Individualism 3M 6M 9M 12M Panel A: Country-average portfolios
Low Indv 0.397 *** 0.361 *** 0.272 *** 0.184 ** (3.23) (3.34) (2.71) (2.00) High Indv 0.710 *** 0.660 *** 0.542 *** 0.427 ***
(9.04) (9.03) (7.60) (6.27) High minus low 0.313 *** 0.299 *** 0.270 *** 0.244 ***
(2.71) (2.93) (2.77) (2.67) Panel B: Composite portfolios
Low Indv 0.270 ** 0.235 ** 0.145 0.069 (2.13) (2.13) (1.47) (0.79) High Indv 0.613 *** 0.558 *** 0.439 *** 0.326 ***
(6.11) (5.80) (4.69) (3.64) High minus low 0.344 ** 0.323 ** 0.294 ** 0.257 **
Table 5: Determinants of residual momentum returns from the Fama-MacBeth Regressions
Monthly returns on country-specific residual momentum portfolios are regressed on Hofstede’s individualism index (Indv) and different sets of explanatory variables. Equity is the index of access to equity markets constructed by La Porta, Lopez-de-Silanes, Shleifer (2006). MKT/GDP is the ratio of stock market capitalization to gross domestic product scaled by the fraction of the stock market held by outside investors, averaged over the period from 1996 to 2003. SelfDealing is the anti-self-dealing index constructed by Djankov, La Porta, Lopez-de-Silanes, and Shleifer (2008) as the measure of legal protection of investors. The coefficients on Indv are multiplied by 100. This table reports the time-series averages of cross-sectional OLS estimates of the coefficients. The t-statistics adjusted for heteroskedasticity and autocorrelation using the Newey-West (1994) procedure are in parentheses. * denotes significance at the 10% level, ** denotes significance at the 5% level and *** denotes significance at the 1% level.
3M 6M 9M 12M Panel A: Momj t, =α0+β1Indvj+εj t,
Intercept 0.468 * 0.392 * 0.224 0.139 (1.92) (1.90) (1.15) (0.76)
Indv 0.845 *** 0.798 *** 0.758 *** 0.677 *** (2.61) (2.89) (2.91) (2.67) Panel B: Momj t, =α0+β1Indvj+β2Equityj+εj t,
Intercept 1.716 0.965 0.381 0.805 (1.58) (0.99) (0.43) (0.97) Indv 1.054 *** 0.832 *** 0.763 *** 0.745 *** (2.84) (2.62) (2.63) (2.68) Equity -0.237 -0.098 -0.026 -0.120 (-1.20) (-0.55) (-0.16) (-0.78) Panel C: Momj t, =α0+β1Indvj +β2MKT GDP/ j+εj t,
Intercept 0.587 ** 0.486 ** 0.318 0.235 (2.23) (2.14) (1.56) (1.27) Indv 0.817 ** 0.741 *** 0.741 *** 0.687 *** (2.44) (2.62) (2.87) (2.77) MKT/GDP -0.144 -0.068 -0.116 -0.146 (-0.84) (-0.46) (-0.88) (-1.21) Panel D: Momj t, =α0+β1Indvj+β2SelfDealingj+εj t,
Intercept 0.628 ** 0.436 * 0.179 0.117 (2.25) (1.90) (0.82) (0.56) Indv 0.779 ** 0.764 *** 0.777 *** 0.684 *** (2.44) (2.90) (3.12) (2.80) SelfDealing -0.206 -0.014 0.075 0.038 (-0.82) (-0.06) (0.33) (0.18) Panel E: Momj t, =α0+β1Indvj+β2Equityj+β3MKT GDP/ j+β4SelfDealingj+εj t,
Intercept -0.063 -0.392 -1.585 -0.260 (-0.03) (-0.19) (-1.00) (-0.20) Indv 0.787 * 0.686 * 0.586 * 0.697 ** (1.81) (1.86) (1.89) (2.47) Equity 0.104 0.151 0.344 0.069 (0.23) (0.37) (1.11) (0.27) MKT/GDP -0.078 -0.085 -0.267 -0.196 (-0.29) (-0.39) (-1.57) (-1.21) SelfDealing -0.047 0.036 0.085 0.168 (-0.15) (0.12) (0.30) (0.65)
Table 6: Returns of residual momentum grouped by individualism in subperiods
At the end of each month, all stocks in each country are ranked in ascending order based on their residual returns over the preceding 12 months excluding the most recent month, which are estimated using the country-wide Fama-French three-factor model. Stocks in the top decile are assigned to the winner portfolio and those in the bottom decile to the loser portfolio. We calculate the equally-weighted returns for these portfolios. The residual momentum strategy involves buying the winner portfolio and selling short the loser portfolio for the subsequent K months (K = 3, 6, 9, 12) with an overlapping scheme. We first rank countries into two equal groups based on their scores on the individualism index (denoted as Indv). Countries with their Indv ranked at the top 50% are allocated into the high-Indv portfolio, while those with their Indv ranked at the bottom 50% are allocated into the low-Indv portfolio. The country-average portfolio is a portfolio that puts equal weight on each country-specific residual momentum portfolio in this portfolio. The composite portfolio is weighted based on the number of stocks in the country. We report the returns for two sybsanples, 1981-1997 and 1998-2009, respectively. The t-statistics adjusted for heteroskedasticity and autocorrelation using the Newey-West (1994) procedure are in parentheses. * denotes significance at the 10% level, ** denotes significance at the 5% level and *** denotes significance at the 1% level.
Index on Individualism 3M 6M 9M 12M
1981-1997 1998-2009 1981-1997 1998-2009 1981-1997 1998-2009 1981-1997 1998-2009 Panel A: Country-average portfolios
Low Indv 0.828 *** 0.418 0.672 *** 0.368 0.520 ** 0.241 0.411 ** 0.087 (3.35) (1.65) (3.20) (1.65) (2.56) (1.22) (2.12) (0.49) High Indv 1.387 *** 0.987 *** 1.236 *** 0.880 *** 0.999 *** 0.724 *** 0.875 *** 0.536 ***
(10.64) (5.26) (10.01) (5.12) (8.66) (4.32) (8.18) (3.36) High minus low 0.559 ** 0.570 ** 0.565 ** 0.512 ** 0.479 ** 0.483 ** 0.464 ** 0.450 **
(2.09) (2.48) (2.40) (2.49) (2.13) (2.52) (2.06) (2.57) Panel B: Composite portfolios
Low Indv 0.412 * 0.388 0.369 * 0.295 0.240 0.172 0.164 0.028 (1.83) (1.42) (1.94) (1.25) (1.35) (0.83) (0.98) (0.16) High Indv 1.145 *** 0.714 *** 1.045 *** 0.628 ** 0.872 *** 0.434 * 0.731 *** 0.251
(7.83) (2.89) (7.72) (2.61) (6.96) (1.83) (6.46) (1.12) High minus low 0.734 *** 0.326 0.676 *** 0.333 0.632 *** 0.262 0.567 *** 0.223
Table 7: Returns of residual momentum grouped by GLOBE’s institutional collectivism index from House et al. (2004)
At the end of each month, all stocks in each country are ranked in ascending order based on their residual returns over the preceding 12 months excluding the most recent month, which are estimated using the global-version Fama-French three-factor model. Stocks in the top decile are assigned to the winner portfolio and those in the bottom decile to the loser portfolio. We calculate the equally-weighted returns for these portfolios. The residual momentum strategy involves buying the winner portfolio and selling short the loser portfolio for the subsequent K months (K = 3, 6, 9, 12) with an overlapping scheme. We first rank countries into two equal groups based on their scores on the GLOBE’s institutional collectivism index multiplied by -1 (denoted as IndvGLOBE) from House et al. (2004). Countries with their IndvGLOBE ranked at the top 50% are allocated into the high-IndvGLOBE portfolio, while those with their IndvGLOBE ranked at the bottom 50% are allocated into the low-IndvGLOBE portfolio. The country-average portfolio is a portfolio that puts equal weight on each country-specific residual momentum portfolio in this portfolio. The composite portfolio is weighted based on the number of stocks in the country. The t-statistics adjusted for heteroskedasticity and autocorrelation using the Newey-West (1994) procedure are in parentheses. * denotes significance at the 10% level, ** denotes significance at the 5% level and *** denotes significance at the 1% level.
Country 3M 6M 9M 12M Panel A: Country-average portfolios grouped by GLOBE’s institutional collectivism index
Low IndvGLOBE 0.776 *** 0.701 *** 0.526 *** 0.399 *** (5.24) (5.40) (4.58) (3.80) High IndvGLOBE 1.129 *** 0.962 *** 0.779 *** 0.612 ***
(8.29) (8.23) (7.17) (5.83) High minus low 0.353 ** 0.261 ** 0.253 ** 0.212 *
(2.25) (2.03) (2.29) (1.94) Panel B: Composite portfolios grouped by GLOBE’s institutional collectivism index
Low IndvGLOBE 0.521 *** 0.453 *** 0.307 ** 0.196 * (3.11) (3.09) (2.39) (1.70) High IndvGLOBE 0.911 *** 0.807 *** 0.626 *** 0.462 ***
(6.20) (5.58) (4.43) (3.47) High minus low 0.390 ** 0.354 ** 0.319 ** 0.266 **
Table 8: Returns of residual momentum obtained from the global-version of Fama-French model
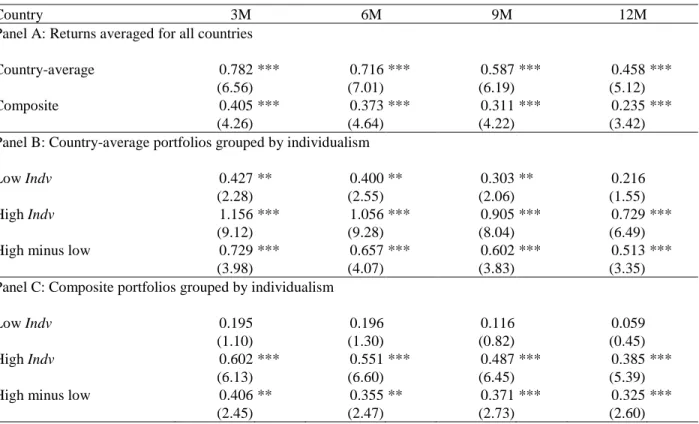
At the end of each month, all stocks in each country are ranked in ascending order based on their residual returns over the preceding 12 months excluding the most recent month, which are estimated using the global version of Fama-French three-factor model. Stocks in the top decile are assigned to the winner portfolio and those in the bottom decile to the loser portfolio. We calculate the equally-weighted returns for these portfolios. The residual momentum strategy involves buying the winner portfolio and selling short the loser portfolio for the subsequent K months (K = 3, 6, 9, 12) with an overlapping scheme. We first rank countries into two equal groups based on their scores on the individualism index (denoted as Indv). Countries with their Indv ranked at the top 50% are allocated into the high-Indv portfolio, while those with their Indv ranked at the bottom 50% are allocated into the low-Indv portfolio. The country-average portfolio is a portfolio that puts equal weight on each country-specific residual momentum portfolio in this portfolio. The composite portfolio is weighted based on the number of stocks in the country. The t-statistics adjusted for heteroskedasticity and autocorrelation using the Newey-West (1994) procedure are in parentheses. * denotes significance at the 10% level, ** denotes significance at the 5% level and *** denotes significance at the 1% level.
Country 3M 6M 9M 12M Panel A: Returns averaged for all countries
Country-average 0.782 *** 0.716 *** 0.587 *** 0.458 *** (6.56) (7.01) (6.19) (5.12) Composite 0.405 *** 0.373 *** 0.311 *** 0.235 ***
(4.26) (4.64) (4.22) (3.42) Panel B: Country-average portfolios grouped by individualism
Low Indv 0.427 ** 0.400 ** 0.303 ** 0.216 (2.28) (2.55) (2.06) (1.55) High Indv 1.156 *** 1.056 *** 0.905 *** 0.729 ***
(9.12) (9.28) (8.04) (6.49) High minus low 0.729 *** 0.657 *** 0.602 *** 0.513 ***
(3.98) (4.07) (3.83) (3.35) Panel C: Composite portfolios grouped by individualism
Low Indv 0.195 0.196 0.116 0.059 (1.10) (1.30) (0.82) (0.45) High Indv 0.602 *** 0.551 *** 0.487 *** 0.385 ***
(6.13) (6.60) (6.45) (5.39) High minus low 0.406 ** 0.355 ** 0.371 *** 0.325 ***
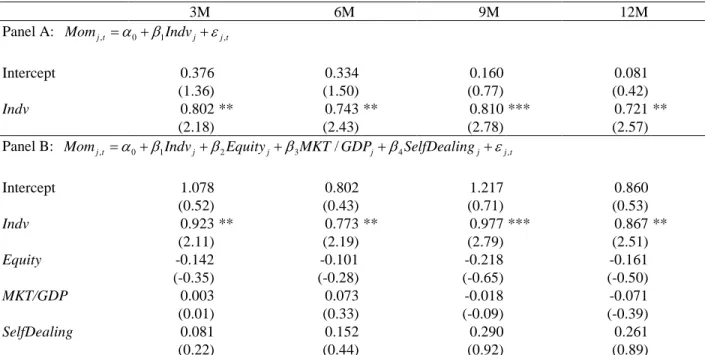
Table 9: Determinants of residual momentum returns obtained from the global-version of Fama-French model
Monthly returns on country-specific residual momentum portfolios that are obtained from the global version of Fama-French three-factor model are regressed on Hofstede’s individualism index (Indv) and different sets of explanatory variables. Equity is the index of access to equity markets constructed by La Porta, Lopez-de-Silanes, Shleifer (2006). MKT/GDP is the ratio of stock market capitalization to gross domestic product scaled by the fraction of the stock market held by outside investors, averaged over the period from 1996 to 2003. SelfDealing is the anti-self-dealing index constructed by Djankov, La Porta, Lopez-de-Silanes, and Shleifer (2008) as the measure of legal protection of investors. The coefficients on Indv are multiplied by 100. This table reports the time-series averages of cross-sectional OLS estimates of the coefficients. The t-statistics adjusted for heteroskedasticity and autocorrelation using the Newey-West (1994) procedure are in parentheses. * denotes significance at the 10% level, ** denotes significance at the 5% level and *** denotes significance at the 1% level.
3M 6M 9M 12M Panel A: Momj t, =α0+β1Indvj+εj t,
Intercept 0.376 0.334 0.160 0.081 (1.36) (1.50) (0.77) (0.42)
Indv 0.802 ** 0.743 ** 0.810 *** 0.721 ** (2.18) (2.43) (2.78) (2.57) Panel B: Momj t, =α0+β1Indvj +β2Equityj+β3MKT GDP/ j+β4SelfDealingj+εj t,
Intercept 1.078 0.802 1.217 0.860 (0.52) (0.43) (0.71) (0.53) Indv 0.923 ** 0.773 ** 0.977 *** 0.867 ** (2.11) (2.19) (2.79) (2.51) Equity -0.142 -0.101 -0.218 -0.161 (-0.35) (-0.28) (-0.65) (-0.50) MKT/GDP 0.003 0.073 -0.018 -0.071 (0.01) (0.33) (-0.09) (-0.39) SelfDealing 0.081 0.152 0.290 0.261 (0.22) (0.44) (0.92) (0.89)
國科會補助專題研究計畫項下出席國際學術會議心得報告
日期:102 年 09 月 10 日一、參加會議經過
本次研討會我被安排在 9 月 14 日下午的 Session 9,本場次的主題是投資 (Investment),該 場次共有三位學者發表學術論文。本人發表的論文題目為 “Credit Rating Anomaly in Taiwan Stock Market”評論人 Prof. Jungwon Suh 為韓國成均館大學 (Sungkyunkwan University) 的教 授,本身也是研究投資相關議題的專家。Prof. Suh 對本篇文章提供了非常多寶貴的建議,本 篇論文也據以修改投稿至 Asia-Pacific Journal of Financial Studies,並已被接受刊登於該期刊 2013 年的第 42 卷。這個結果,可以說是參加本次財務研討會所得到的最大的收穫。
同時,本人也擔任 Session 4,主題也是投資的另一篇文章 “Market Segmentation, Price Disparity and Transmission of Pricing Information: Evidence from Class A and H Shares of Chinese Dual-Listed Companies” 的評論工作。這一篇文章主要探討 2002 年底中國金融改革開放前後, 對於大陸 A 股跟 H 股之間的價格傳導效率之影響,是一篇有趣的資產定價相關的文章。
除了我自己報告跟評論的場次外,本人另外一篇文章 “Does the Value Spread Predict International Stock Returns?” 的共同作者柯冠成教授也在 Section 7: Investment 中發表報告該篇 文章。其中從評論人所得到的建議,讓該論文在將來投稿前,也有一個良好的修正依據。
計畫編號
NSC 101-2410-H-004 -057 -
計畫名稱
國際股市之殘差動能
出國人員
姓名
林信助
服務機構
及職稱
國立政治大學國際貿易學系副教授
會議時間
101 年 9 月 14 日
至
101 年 9 月 14 日
會議地點
韓國首爾
會議名稱
(中文) 2012 年韓國財務金融學會與臺灣財務金融學會聯合研討會
(英文) 2012 KFA-TFA Joint Conference in Finance
發表論文
題目
(中文) 台灣股票市場信用評等異常現象
二、與會心得
這次到韓國參加金融學術研討會,除了從其他學者身上得到投稿前論文修改的許多寶貴建 議並使得論文被接受刊登之外;另外,與其他與會學者之間的研究經驗交流,也讓我獲益匪 淺。三、考察參觀活動(無是項活動者略)
無。
四、建議
無。
五、攜回資料名稱及內容
無。
六、其他
無。
國科會補助專題研究計畫項下出席國際學術會議心得報告
日期:102 年 09 月 10 日一、參加會議經過
本次研討會我被安排在 3 月 16 日下午的 Session 115: Markets: Volatility, Perceptions, And Policy,該場次共有三位學者發表學術論文。本人發表的論文題目為 “Does Market Volatility Improve Predictability of Technical Analysis?” 評論人 Prof. Peter Erdos, 為瑞士 University of St. Gallen 的年輕教授,本身也是研究財務金融議題的專家。Prof. Erdos 及其它同一場次的與會學 者都對本篇文章提供了非常多寶貴的建議,讓本篇論文在將來投稿前,有一個良好的修正依 據。
同時,本人也評論 Section 134: Financial Markets 另一篇文章 “Higher Moments And Beta Asymmetry: Evidence From Australia”的評論工作。這一篇文章主要探討不同市場狀態(熊市或
牛市)市場 Beta 所呈現的不對稱現象無法被Carhart (1997)的四因子資產定價模型所解釋,但
資產報酬率的條件第三階動差與條件第四階動差卻對此一 Beta 不對稱現象有極大的解釋能 力,這是一篇有趣的資產定價相關的文章。
除了我自己報告跟評論的場次外,本人另外一篇文章“Value Investing And Technical Analysis In Taiwan Stock Market” 的共同作者柯冠成教授也在 Section 23: Stock Markets And Bubbles 中發 表報告該篇文章,並從與會評論人中所得到不少未來投稿前論文修正的寶貴意見。
計畫編號
NSC 101-2410-H-004 -057 -
計畫名稱
國際股市之殘差動能
出國人員
姓名
林信助
服務機構
及職稱
國立政治大學國際貿易學系副教授
會議時間
102 年 3 月 14 日
至
102 年 3 月 17 日
會議地點
日本東京 Keio University
會議名稱
(中文)
國際西方經濟學會第十屆環太平洋地區
雙年
會
(英文)
10th Biennial Pacific Rim Confer
e
nce,
Wes
t
ern
Ec
o
n
o
mi
c
Associ
atio
n Intern
a
ti
o
nal
發表論文
題目
(中文)市場波動度是否能改善技術分析的獲利性?
除了自己報告跟評論的場次外,我也參加了幾場主題演講(Keynote Address)。其中,2003 年諾貝爾經濟學獎得主 Prof. Robert F. Engle 所主講的“Global Financial Stability and Systemic Risk Today”這一場演講尤其令人留下深刻的印象,對於瞭解當前全球金融穩定與系統風險之間 的關係及著眼點都提供了相當精闢的見解。