Surface waves and volume waves in a photonic
crystal slab
Raybeam Hwang
Department of Communication Engineering, National Chiao Tung University 1001, Ta-Hsueh Road, Hsinchu, Taiwan, R.O.C
Abstract: The volume and surface waves supported by a 2D PC slab with termination condition are systematically studied using the rigorous mode-matching method incorporating the Floquet’s solutions. It is interesting to observe that the surface waves are caused by the perturbation of the PC-slab modes from the imposed termination condition, enabling the transition from volume wave to surface wave. The perturbed dispersion curves and electric field strength distribution over the structure are drawn together with the unperturbed ones (without termination condition) to identify the type of bound waves.
©2007 Optical Society of America
OCIS codes: (999.9999) Photonic band gap structures; (999.9999) Surface waves and volume
waves; (260.2110) Electromagnetic theory; (230.7370) Waveguides.
References and links
1. V. G. Veselago, “The electrodynamics of substance with simultaneously negative values of ε and μ,” Sov. Phy. Usp. 10, 509-514 (1968).
2. J. B. Pendry, “Negative refraction makes a perfect lens,” Phys. Rev. Lett. 85, 3966 (2000).
3. X. S. Rao and C. K. Ong, “Amplification of evanescent waves in a lossy left-handed material slab,” Phys. Rev. B 68, 113103 (2003).
4. X. S. Rao and C. K. Ong, “Subwavelength imaging by a left-handed material superlens,” Phys. Rev. B 68, 067601 (2003).
5. Chiyan Luo, Steven G. Johnson, J. D. Joannopoulos and J. B. Pendry, “Subwavelength imaging in photonic crystal,” Phys. Rev. B 68, 045115 (2003).
6. Sanshui Xiao, Min Qiu, Zhichao Ruan, and Sailing He, “Influence of the surface termination to the point imaging by a photonic crystal slab with negative refraction,” Appl. Phys. Lett. 85, 4269 (2004).
7. Esteban Moreno, F. J. Garcia-Vidal, and L. Martin-Moreno, “Enhanced transmission and beaming of light via photonic crystal surface modes,” Phys. Rev. B 69, 121402 (2004).
8. P. Kramper, M. Agio, C. M. Soukoulis, A. Birner, F. Müller, R. B. Wehrspohn, U. Gösele, and V. Sandoghdar, “Highly Directional Emission from Photonic Crystal Waveguides of Subwavelength Width,” Phys. Rev. Lett.
92, 113909 (2004).
9. X. Wang and K. Kempa, “Effects of disorder on subwavelength lensing in two-dimensional photonic crystal slabs,” Phys. Rev. B 71, 085101 (2005).
10. J. Bravo-Abad, F. J. García-Vidal, and L. Martín-Moreno, “Resonant Transmission of Light Through Finite Chains of Subwavelength Holes in a Metallic Film,” Phys. Rev. Lett. 93, 227401 (2004).
11. R. Moussa, Th. Koschny and C. M. Soukoulis, “Excitation of surface waves in a photonic crystal with negative refraction: The role of surface termination,” Phys. Rev. B 74, 115111 (2006).
12. S. Enoch, G. Tayeb and B. Gralak, “The richness of the dispersion relation of electromagnetic bandgap materials,” IEEE Trans. on Antennas and Propagation 51, 2659 (2003).
13. T. Tamir and S. Zhang, “Modal Transmission-Line Theory of Multilayered Grating Structures,” IEEE J. Lightwave Technol. 14, 914 (1996).
14. Ruey Bing Hwang and Cherng Chyi Hsiao, “Frequency-selective transmission by a leaky parallel-plate-like waveguide,” IEEE Trans. on Antennas and Propagation 54, 121 (2006).
15. J. D, Joannopolous, R. D. Meade, and J. N. Winn, Photonic Crystals: Molding theFlow of Light, (Princeton, NJ: Princeton University Press, 1995).
1. Introduction
Periodic structures again attract considerable attentions in recent years since the anomalous phenomenon- negative refraction was observed. The term “negative refraction” means that the medium refracts the electromagnetic wave in the direction opposite to that obeying the Snell’s law. This phenomenon was predicted by Veselago [1] in 1968 by introducing the negative permittivity and permeability into the Maxwell’s equations. He knew that in such a homogeneous medium the k, E and H form a left-handed set of vectors. A striking observation of superlensing using a uniform medium with negative permittivity and permeability was found by Pendry [2], who argued that the superlensing is due to the excitation of surface modes. Only the surface is carefully terminated, the excitation of surface modes and an improvement of image is achieved. Besides, the excitation of surface waves and their role in the imaging regarding a homogeneous slab made up of left-handed medium were studied [3, 4]. Many researchers have been studied the surface photon bound states of a photonic crystal slab with surface termination; to mention a few,; the transmission of evanescent waves through a photonic crystal slab and subwavelength imaging were successfully verified using numerical experiments [5]. Influence of the surface termination to the point imaging by a photonic crystal with negative refraction was investigated theoretically [6]. Enhanced transmission and beaming of light via leaky surface modes, caused by modulating the exit surface of a photonic crystal slab, were studied [7]. The termination of the PC end facets and an appropriate choice of the wavelength were found to be instrumental in achieving very low numerical aperture [8]. The effect of the surface and the crystal disorder effects on the lensing (the light intensity profile at the image of a line source) was investigated [9]. The role of the surface termination of the finite photonic crystals in exciting surfaces and enhancing the transmission was examined [10, 11].
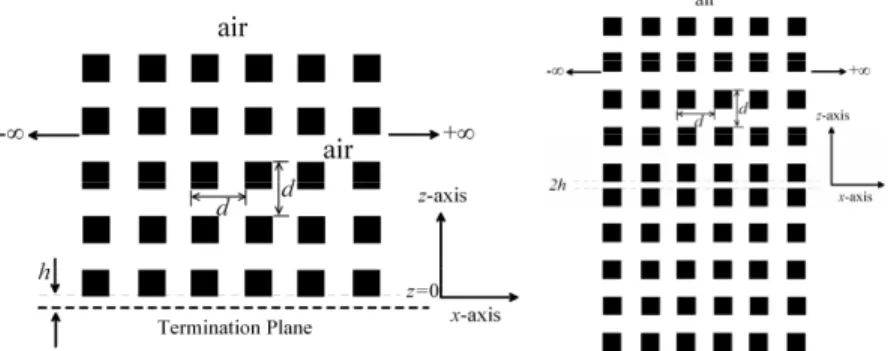
As was well known, surface wave is a bound wave decaying along both directions from the interface between 2D PC and uniform surrounding medium. Furthermore, a complete 2D PC without surface termination cannot support surface bound state. Different from the papers dealing with the structure with surface termination, in this work, we investigate the dispersion characteristics of a complete 2D PC (each unit cell is complete) terminated with open-circuit (perfect magnetic conductor) or short-circuit (perfect electric conductor), as depicted in the left-hand side of Fig. 1. Such a structure is generally enough to accommodate the case of both theoretical as well as practical interests, as we shall do in this work. For example, with open-circuit or short-open-circuit termination, such a structure may be regarded as the symmetric or anti-symmetric bisection of the whole structure shown in the right-hand side of Fig. 1.
As was well understood and commonly known, the defect region can support the guided mode bouncing back and forth by the 2D PC walls as it is propagating therein. Such a waveguide mode has its fields distributed sinusoidally in the transverse direction in the defect region. On the other hand, the second type of waveguide mode – surface wave is less well known. This interface wave has its fields decaying in both directions from the interface between the 2D PC and defect region. Therefore, it is interesting to study why and how the interface wave exists; this will be the focal point of investigation in this work.
In addition, although the research works concerning the effect of surface defect on the surface modes were studied, the transition of surface waves from volume waves by imposing termination condition on a complete 2D PC was not reported previously. Specifically, the types of volume and surface waves are clearly identified for various termination distances to explore the physical insight of wave process taking place in a PC with termination condition.
To understand the guiding characteristic of such an interface wave, the dispersion relation of all bound waves supported by a 2D PC structure has to be calculated first. In this research, the rigorous mode-matching method incorporating the Floquet’s solutions [13, 14] was employed to carry out the computation for both scattering and guiding characteristics. Moreover, the dispersion relation of bound waves was determined by solving the transverse resonance equation. Besides, the band-structure of the corresponding infinite 2D PC medium was calculated for facilitating the understanding of wave propagating in the infinite crystal.
Fig. 1. Structure configuration: a 2D PBG structure with termination condition (left-hand side), a 2D PBG structure with defect in its central layer (right-hand side)
2. Method of Analysis
As shown in the left-hand side of Fig. 1, a two-dimensionally photonic crystal slab consists of rectangular dielectric rods array immersed in a uniform medium. The structure extends infinitely along the x- and y- direction, while it is finite the z direction. Below the periodic structure at a distance h, there is an OC (open-circuit) or a SC (short-circuit) termination. Since the electromagnetic fields as well as the structure are assumed to be invariant along the
y direction, the problem can be individually treated as Ey- and Hy- mode. In this paper, we
only considered the condition of Ey polarization.
Returning to the left-hand side of Fig. 1, the 2D PC structure could be viewed as a finite stack of 1D periodic layer (along the z direction). The scattering characteristic of plane wave by a 1D periodic structure can be considered as a basic building block for constructing the scattering characteristic of the overall structure. At first, the plane-wave expansion method is employed to solve the eigen-solutions in an infinite 1D periodic medium. After matching the boundary conditions at the interface between the 1D periodic medium and uniform surrounding medium, the input-output relation of the 1D periodic layer was obtained. By cascading the input-output relation of each 1D periodic layer, the scattering characteristic including the reflection- and transmission- efficiency of each space harmonic can be determined accordingly. Moreover, the dispersion relation of the modes (eigen-solutions of a source-free problem) can be determined by solving the transverse resonance equation. Since the detail mathematical procedures for resolving the dispersion relation of bound waves and the band structure could be found in literature [12-15], the complicated mathematical procedures are neglected here.
3. Numerical Results
Based on the theoretical analysis procedures described previously, we have developed a computer codes to calculate the dispersion relation of bound waves and their corresponding fields distribution. In the following numerical examples, the structure parameters are given below. The relative dielectric constants of the dielectric cylinder and uniform surrounding media are 5.0 and 1.0, respectively. The width of the square cylinder and the periods along the x and z directions (dx and dz) are 0.5d, 1.0d and 1.0d, respectively, where d is the period along the x and z directions. The number of 1D periodic layer is 5, whereas the number of periods along the x direction is infinity. The distance from the 2D PC to the termination plane denotes h.
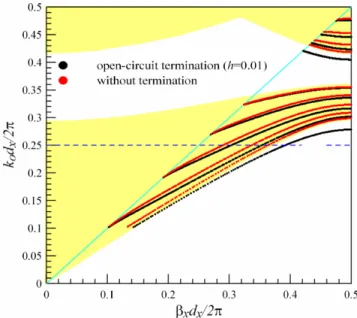
Figure 2 depicts the dispersion relation of bound waves in the 2D PC under consideration. The vertical and horizontal axes represent the normalized frequency (dx/λ) and normalized propagation constant along the x direction (βxdx/2π), respectively. The straight line with unity slope is the light line (βx = ko); the region with slop greater than unity represents the slow-wave (or bound-slow-wave) region where the electromagnetic slow-waves are confined within the PC slab, whereas the region with slope smaller than unity is the fast-wave region where the
electromagnetic waves may radiate into the surrounding medium. The wave guiding characteristics in defect region and its leaky-wave phenomena were well known in literature [13, 14]; however, the bound-wave characteristics remain to be studied in detail. Therefore, in this paper, only the dispersion characteristics of waveguide modes in the bound-wave region are calculated for investigating their physical consequences. In this figure, the
projected band-structure of the corresponding infinite 2D PC was drawn [15]; the region
drawn in yellow color is the pass-band region, while the region in white color is the stop-band region. The two different termination conditions are taken into account in this numerical example, which are open-circuit and without termination (infinite in extent of the uniform medium), respectively. The curves in black and red colors represent the dispersion characteristics of waveguide modes for the case of open-circuit termination and without termination, respectively. These dispersion curves are very similar to those of the bound waves in multiple uniform dielectric layers, excluding the band-gap on each dispersion curve resulted from the contra-flow coupling between the x-direction space harmonics. Since the structure contains five 1D periodic layers, there exist five dispersion curves of the fundamental mode shown in this figure.
Fig. 2. Dispersion relation of the 2D PBG structure with termination conditions; the black curves represent the dispersion relation of the case with open-circuit termination (h=0.01), and the red ones stand for the case without termination.
Fig. 3. Distribution of the electric field strength along the y-direction at the normalized frequency 0.25.
For the case without termination, all the dispersion curves are inside the pass-band region. It means that all the modes are able to penetrate into the PC region, while they are decaying outside the PC. Each of the dispersion curves has its own field distribution. They are termed as “volume waves”. It is interesting to note that there are two curves leaving the pass-band and going into the stop-band region as the open-circuit termination (h=0.01) was imposed. Obviously, such a perturbation on the PC slab enables the dispersion curves of un-terminated case to move downwards and go away the pass-band region. The dispersion curve in the stop-band region represents that the electromagnetic field experiences a strong reflection in the 2D PC. Moreover, since the x-direction phase constant (βx) is greater than the free-space wave number (ko), the wave is decaying in the surrounding medium. Therefore, this wave is decaying along both directions from the interface, at z = 0, between 2D PC and uniform medium. To demonstrate it, we plot the distribution of the electric field strength (magnitude of Ey component) over the structure at the normalized frequency dx/λ = 0.25. From Fig. 3, we observe that the field is decaying along the 2D PC region; however, the decaying below the z = 0 region is not easy to observe because that the termination plane is very close to the interface (h=0.01).
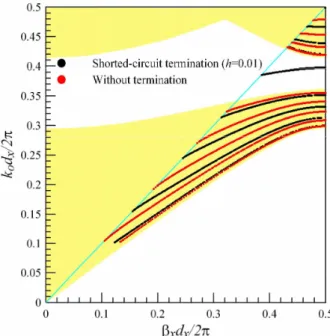
In addition to the open-circuit termination condition, we have also calculated the case of short-circuit termination with termination distance h=0.01, shown in Fig. 4. From this figure, it is obviously to see that, contrary to the OC termination, the dispersion curves of the SC termination (in black color) move upwards; for example, the one in the stop-band region moves out of the pass-band region. Although not shown here, the distribution of the electric field intensity of the dispersion curves in the stop-band region also exhibits exponential decay in the 2D PC structure.
Fig. 4. Dispersion relation of the 2D PBG structure with termination conditions; the black curves represent the dispersion relation of the case with short-circuit termination (h=0.01), and the red ones stand for the case without termination.
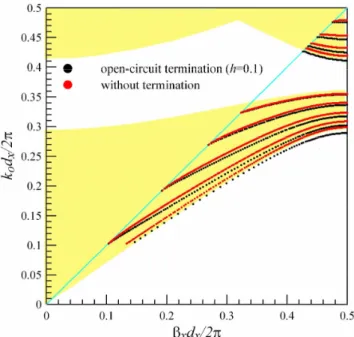
Returning to the case of OC termination, we increase the termination distance h to 0.1 to calculate the dispersion curves. As shown in fig. 5, the dispersion curves of the OC termination still moves downwards; however, the displacement away from the un-terminated case decreases in comparison with the results shown in Fig. 2. It indicates that the influence due to the OC termination is decreasing as the termination distance h is increasing. To verify this phenomenon, we have consecutively increased the distance h from 0.1 to 0.245 to see the
variation on the displacement between the cases of OC termination and without termination. Although not shown here, the results indicate that the increasing in the termination distance, the two sets of dispersion curves will gradually approach to each other. Moreover, we found that as the termination distance h is greater than 0.245, the two group of dispersion curves are hard to be distinguished. All the dispersion curves are volume waves and stay in the pass band region.
Figure 6 shows the dispersion characteristics of waveguide modes for the case of h=0.245, it is apparently to see that the two groups of dispersion curves are close to each other. The physical interpretation is given below. Since the bound waves have relative refractive index (βx/ko) greater than unity, they are exponentially decaying in the uniform surrounding medium. If the termination plane is far away from the 2D PC, the wave is decaying considerably at the position of the termination plane; and the reflected wave is, of course, insignificant. Therefore, such a situation is very similar to the case without termination, and the perturbation on the dispersion curve is negligible. Conversely, when the termination plane is close to the 2D PC, the waves have not yet decayed at the termination plane, thus the reflected waves is appreciable. The dispersion curves should be altered by the incorporation of the reflected waves.
Fig. 5. Dispersion relation of the 2D PBG structure with termination conditions; the black curves represent the dispersion relation of the case with open-circuit termination (h=0.1), and the red ones stand for the case without termination.
Fig. 6. Dispersion relation of the 2D PBG structure with termination conditions; the black curves represent the dispersion relation of the case with open-circuit termination (h=0.245), and the red ones stand for the case without termination
In addition to the dispersion curves, we also demonstrate the distribution of the electric field strength on the overall structure. The field patterns were plotted at the normalized frequency dx/λ = 0.25. As was shown in Fig. 6, at this normalized frequency, there exist three bound waves for each termination condition, respectively, where the normalized propagation constant along the x direction (βx/ko) are 1.1972, 1.3872 and 1.4779 for the OC termination, and are 1.1542, 1.3449 and 1.4532 for the case without termination, respectively. Figures 7, 8 and 9 demonstrate the field strength distribution (magnitude of Ey component) of the three modes for the two termination conditions, respectively. Excluding the third mode in the OC termination case, the the x-direction normalized propagation constant are all in the pass-band region and belong to volume waves. Namely, the field can penetrate into the 2D PC structure while it decays in the uniform surrounding medium. Since the first two normalized propagation constants of respective termination conditions locate in the pass-band region and are close to each other, they are apparently to have the similar field distributions as expected from physical intuition.
Specifically, regarding the third mode of the OC termination case, it locates in the stop-band region and is near the boundary between stop-stop-band and pass-stop-band. Thus, the electric field strength is decaying toward the 2D PC region from the interface at z = 0, confirming its wave-propagation behavior in stop-band region. Unlike the picture shown in the left-hand side, the bound wave of the un-terminated case (the third mode) has maximum electric-field strength around the center of the structure. Notably, since this mode is centered at the termination plane, it does not allow to visualize the surface state.
4. Conclusion
For a 2D PC without surface termination, all the dispersion curves of the bound waves locate in the pass-band region. Their electric and magnetic fields can penetrate into the 2D PC and have different field patterns (distributions), as shown in Fig. 7, Fig. 8 and the right-hand side of Fig. 9. Due to the termination condition imposed on a complete 2D PC, the dispersion characteristics of waveguide modes are perturbed. The movement of the dispersion curves, either toward upward- (SC termination) or downward-(OC termination) direction, is taking place, enabling the transition of some dispersion curves from pass-band region to stop-band
region. The dispersion curves in the stop-band region means that the wave is exponentially decaying along the 2D PC region. Therefore, they are no longer volume waves and turn into surface bound states (surface waves). In this paper, we have systematically examined the variation of bound waves for various termination distances. The dispersion relation of bound waves and the corresponding electric field intensities were shown to interpret the evolution of surface waves from volume waves.
Fig. 7. the distribution of the electric field strength Ey at the normalized frequency 0.25, the
left-hand side picture is for OC termination (with effective refraction index 1.1972) and the right-hand side one is for un-terminated case (with effective refractive index 1.1542).
Fig. 8. the distribution of the electric field strength Ey at the normalized frequency 0.25, the
left-hand side picture is for OC termination (with effective refraction index 1.3872) and the right-hand side one is for un-terminated case (with effective refractive index 1.3449).
Fig. 9. the distribution of the electric field strength Ey at the normalized frequency 0.25, the
left-hand side picture is for OC termination (with effective refraction index 1.4779) and the right-hand side one is for un-terminated case (with effective refractive index 1.4532).
Acknowledgments
This research was supported, in part, by the Ministry of Education, Taiwan, R. O. C. under Contract ATU Program and by the National Science Council, Taiwan, R.O.C. under the contract NSC 95-2221-E-009-045-MY3.