Design and construction of linear laser encoders
that possess high tolerance of mechanical runout
Chih-Kung Lee, Chyan-Chyi Wu, Shih-Jui Chen, Liang-Bin Yu, You-Chia Chang, Yeong-Feng Wang, Jau-Yu Chen, and Jeremy Wen-Jong Wu
A linearly diffracted laser encoder that has high tolerance of head-to-scale misalignment and a high signal-to-noise ratio is described. The preservation of parallelism between the incident and the dif-fracted beams, which can be attributed to a built-in folded 1⫻ telescope, allows for the high alignment tolerance. It can be shown that, by coupling this newly developed circular polarization interferometer configuration with grating scale geometry optimization, one can eliminate the problems associated with signal distortion that arise from various efficiencies of the p- and the s-polarized light beams and obtain a high signal-to-noise ratio. Both theoretical and experimental results are presented to confirm the improved results and performance. © 2004 Optical Society of America
OCIS codes: 220.4830, 120.4570, 120.3180, 120.3930, 050.1950, 120.3940.
1. Introduction
Displacement measurements of high sensitivity and accuracy are indispensable to precision machining and nanotechnology. For submicrometer position-ing, noncontact measurements are important be-cause even a small load tends to be-cause deformation and to lead to measurement errors. Of all the non-contact metrology methods developed for precision displacement measurement, the interferometer en-joys the widest popularity. Nevertheless, inter-ferometers suffer from high sensitivity to environmental disturbance, as minute temperature or pressure variations can lead to large measurement errors.1,2
In general, optical encoders derive their metrology signals by converting light beam intensity or wave-length to modulations of grating scales. Geometri-cal optiGeometri-cal encoders utilize moire or projections of gratings to obtain the displacement signal from light
intensity modulations; in this approach the grating pitch is limited to a 10-m range because of the dif-fraction limit that in turn limits the best resolution to 100 nm or so. A diffractive laser encoder, however, not only can circumvent the diffraction limitation but can also encode the displacement signal by taking advantage of the diffraction signal. The phase en-coded within the diffractive light beam when the grating scale moves provides the diffractive laser en-coder with a way to achieve nanometer measurement accuracy. Interfering diffractive light beams with a phase modulated by the grating scale lead to a grat-ing interferometer that transforms the underlygrat-ing measurement scale from a laser wavelength type to a grating pitch type. As the displacement does not depend explicitly on the optical path difference, it enjoys a higher degree of immunity to environmental disturbances. Such a property is extremely valu-able for many applications and is one of the main differences that separate interferometers from dif-fractive laser encoders.
With the potential to achieve better than a few nanometers’ metrology accuracy in vastly different environments, significant research and development efforts have been expended on this issue and have resulted in many innovative designs.1–5 It has been
found that wave-front aberrations induced by runout of the grating-scale movement cause the largest mea-surement error for laser encoders. The only design known to deal with this problem directly is that of a laser encoder that was originally developed for use with magnetic disk drive servo writing tasks.6 In C.-K. Lee共cklee@mems.iam.ntu.edu.tw兲, S.-J. Chen, L.-B. Yu,
Y.-C. Chang, Y.-F. Wang, and J.-Y. Chen are with the Institute of Applied Mechanics, National Taiwan University, Taipei 106, Tai-wan. C.-K. Lee is also with the Department of Engineering Sci-ence and Ocean Engineering, National Taiwan University, which is also the affiliation for J.W.-J. Wu. C.-C. Wu is with the Center for Measurement Standards, Industrial Technology Research In-stitute, Hsinchu 300, Taiwan.
Received 12 January 2004; revised manuscript received 4 June 2004; accepted 20 July 2004.
0003-6935兾04兾315754-09$15.00兾0 © 2004 Optical Society of America
this design, two folded 1⫻ telescopes are used to com-pensate automatically for grating wave-front aberra-tions. However, this design still suffers from the difference experienced by the two distinct folded 1⫻ telescopes as well as from the phase decoding errors induced by the differences in grating diffraction effi-ciency between the p- and the s-polarized light beams, which appear as quadrature signal distor-tions.
In another laser encoder design7 the diffractive
laser encoder removes the grating-scale-induced wave-front aberration by developing a 1兾4-pitch gradient-index共GRIN兲 lens with a reflective coating only at the center of its back side. A spatial filter is formed by integration of the GRIN lens and the back side’s central coating, which in effect removes all high-order wave-front aberrations. However, this so-called cat’s-eye approach trades off light beam energy for wave-front cleanness, leading to inefficient use of light that limits the achievable maximum signal-to-noise ratio.
In our new design the diffractive laser encoder con-figuration possesses a high tolerance of high-speed mechanical runout while at the same time it main-tains an efficient use of light to arrive at a high signal-to-noise ratio. Our design principle, the opti-cal configuration that we developed, and the experi-mental data are detailed in this paper. In addition, the optimization criteria for achieving a high signal-to-noise ratio are presented as well.
2. Optical Configuration Design
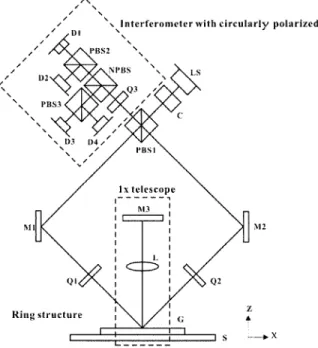
Our newly proposed diffractive laser encoder system 共DiLENS兲 is shown in Fig. 1. The optical system is composed of three subsystems, a ring structure, a 1⫻ telescope, and a circular polarization interferometer,
each of which has a distinct function. The major function of the ring structure is to guide the laser beam generated by the laser source to the linear grat-ing scale and to the telescope. It then guides the ⫹1st- and ⫺1st-order diffracted light to the circular polarization interferometer subsystem. The laser source共LS兲 used in the DiLENS is a diode laser with a 780-nm wavelength, and it is oriented such that the emitted laser beam is linearly polarized at 45°, which in turn equalizes the intensities of the p- and s-polarized light beams after polarizing beam splitter PBS1共Fig. 1兲. A collimator 共C兲 is aligned in front of the laser source to collimate the laser beam. The p-polarized light beam transmitting through PBS1 forms the left arm of the ring structure. The right arm is formed as a result of the reflected s-polarized light beam. Before reaching linear grating G, the p-polarized beam is reflected by mirror M1 and con-verted into circularly polarized light after passing through quarter-wave plate Q1. The grating pitch and the mirror orientation are set to the⫺1st-order diffracted light perpendicular to the grating surface. The ⫺1st-order diffracted light is then guided per-pendicularly back onto the grating by the 1⫻ tele-scope section for diffraction. After being diffracted twice at the ⫺1st order, the beam propagates back along the same route but in a direction opposite that of the original incident light beam. This returning beam passes through Q1 again and is then converted to s-polarized light. PBS1 then reflects this beam to the circular polarization interferometer subsystem. Similarly, the s-polarized light beam after PBS1 is guided to the right-hand arm of the ring structure and is twice diffracted by the grating scale at the 1st order, where it then travels back to the circular po-larization section and becomes p polarized. By dif-fraction twice, at the⫹1st and the ⫺1st orders, the displacement signal is embedded into the phases of the two returning light beams and forms the two interference arms of the circular polarization inter-ferometer section. The phase modulation exerted by the grating scale can be interpreted as a Doppler frequency shift caused by the grating-scale velocity. Doppler frequency shifts ⌬w⫹1 and ⌬w⫺1 relate to grating-scale velocity uxas follows:
⌬w⫹1⫽ 2⌬w ⫽ ux⫻ 4 ⫻ sin , (1) ⌬w⫺1⫽ ⫺2⌬w ⫽ ⫺ux⫻ 4 ⫻ sin , (2) where represents the wavelength of the light source and is the 1st-order diffraction angle. As a phase signal can be obtained by integration of the frequency signal, displacement can be retrieved from the dif-fractive laser encoder. Detailed theoretical results are presented here.
A. Four-Photodiode Circular Polarization Interferometer Directional ambiguity, the situation in which the in-terferometer cannot discern the direction of move-Fig. 1. Configuration of the newly developed laser encoder
ment by analyzing the signal, is an important issue when one is choosing an interferometer as a metrol-ogy tool.8 Generally, a frequency-shifting device
such as an acoustic-optical modulator is used to mod-ulate the signal to permit the direction of movement to be discerned.9 By comparison, a circular
polar-ization interferometer adopts quadrature signals to deal with this ambiguity. In an attempt to minimize the overall system volume, we incorporated a circular polarization interferometer into the DiLENS. A four-photodiode configuration was adopted to remove the dc part of the quadrature signal while the ac component was retained to decode the displacement signal.
Then we applied Jones calculus10to derive the
re-lationship between displacement and phase. The electrical fields of the light beams that have been diffracted twice, at the⫺1st and the ⫹1st orders, are
V1⫽
再
⫺k p共兲 ⫻ kp共0兲i ks共兲 ⫻ ks共0兲冎
exp关i共 ⫺ 2⌬兲t兴, (3) V2⫽再
kp共兲 ⫻ kp共0兲 ks共兲 ⫻ ks共0兲i冎
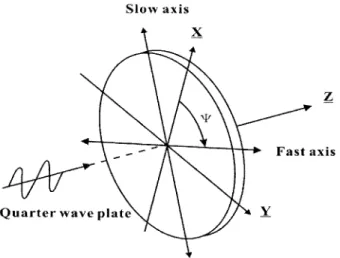
exp关i共 ⫹ 2⌬兲t兴, (4) where subscripts 1 and 2 represent the left and the right arms and kp共兲 and ks共兲 denote the diffraction efficiencies of the p- and the s-polarized light, respec-tively, when the incident angle is , and i denotes 共⫺1兲1兾2. It is worth noting that orientation anglesof quarter-wave plates Q1 and Q2共Fig. 1兲 can be set at ⫹45° and ⫺45°, respectively 共Fig. 2兲. After the light beams pass through Q1 and Q2, their electrical fields immediately before they return to PBS1 be-come U1⫽
再
⫺bi a冎
exp关i共 ⫺ 2⌬兲t兴, (5) U2⫽再
a⫺bi
冎
exp关i共 ⫹ 2⌬兲t兴, (6)where
a⫽ 2⫺1兾2⫻ 关kp共兲 ⫻ kp共0兲 ⫹ ks共兲 ⫻ ks共0兲兴, (7)
b⫽ 2⫺1兾2⫻ 关kp共兲 ⫻ kp共0兲 ⫺ ks共兲 ⫻ ks共0兲兴. (8)
After the light passes through PBS1, the proper polarization components of U1and U2that enter into the detection subsystem become
U1⬘ ⫽
再
0 a冎
exp关i共 ⫺ 2⌬兲t兴, (9) U2⬘ ⫽再
a 0冎
exp关i共 ⫹ 2⌬兲t兴. (10) Examining Eqs.共8兲–共10兲, we can conclude that the DiLENS does not suffer from any diffraction efficien-cies differences b 关Eq. 共8兲兴 of grating scale with re-spect to the different polarization states of the incident light beams because b does not appear in the final signal. After these two light beams pass through quarter-wave plate Q3共Fig. 1兲, their polar-ization states they are converted into left and right circularly polarized light beams:W1⫽ 2⫺1兾2a
冋
i 1册
exp关i共 ⫺ 2⌬兲t兴, (11) W2⫽ 2⫺1兾2a冋
1 i册
exp关i共 ⫹ 2⌬兲t兴, (12) where⌬ is the Doppler frequency shift induced by the grating velocity as shown in Eqs.共1兲 and Eq. 共2兲. Nonpolarized beam splitter NPBS2 共Fig. 1兲 splits combined light beams W1 and W2, which are thenfurther split by polarized beam splitter PBS2. Both the transmitted and the reflected beams split by the PBS2 are detected by the photodiodes. Similarly, the beam reflected by NPBS2 is split by polarized beam splitter PBS3 and then captured by the photo-diodes. The quadrature signal is generated by PBS3 oriented at 45° spatially with respect to that of PBS2. The intensities detected by the four photodiodes can be derived as
ID1⬘ ⫽ 2a2⫹ 2a2⫻ cos共4⌬ ⫻ t兲, (13)
ID2⬘ ⫽ 2a2⫺ 2a2⫻ cos共4⌬ ⫻ t兲, (14)
ID3⬘ ⫽ 2a2⫹ 2a2⫻ sin共4⌬ ⫻ t兲, (15)
ID4⬘ ⫽ 2a2⫺ 2a2⫻ sin共4⌬ ⫻ t兲. (16)
The dc term is removed by the differential ampli-fication of photodiodes D1 and D2, as are the signals from photodetectors D3 and D4. The ac components from D1 to D4 are the quadrature signals needed to form a Lissajous circle pattern:
IP⫽ 4a2⫻ cos共4⌬ ⫻ t兲, (17)
IQ⫽ 4a2⫻ sin共4⌬ ⫻ t兲. (18)
Fig. 2. Definition of fast-axis azimuth angle for Q1 and Q2. The positive Z axis starts from mirror M1 to grating G for Q1 and from M2 to grating G for Q2.
By means of phase decoding techniques,6,11 the
phase of the quadrature signals⌽ and the displace-ment of grating⌬X are related as follows:
⌽ ⫽
兰
d⌽ ⫽兰
4⌬dt ⫽兰
8 uxsindt ⫽8 ⌬X sin . (19)After applying the grating equations, we can ex-press the diffraction angle of the 1st order as follows:
sin ⫽ 兾d, (20)
where d represents the pitch of the grating. Substituting Eq.共20兲 into Eq. 共19兲 leads to
⌬X ⫽⌽ ⫻ d
8 . (21)
Equation共21兲 shows that the phase of the Lissajous circle changes by 8 whenever the grating moves by a pitch. Equation共21兲 clearly demonstrates that the reference scale of a diffractive laser encoder is in grating-scale pitch format, which is different from the laser source wavelengths used in traditional inter-ferometers. As a grating-scale pitch tends to be more environmentally stable than that of air, a dif-fractive laser encoder is typically more robust than traditional interferometers.
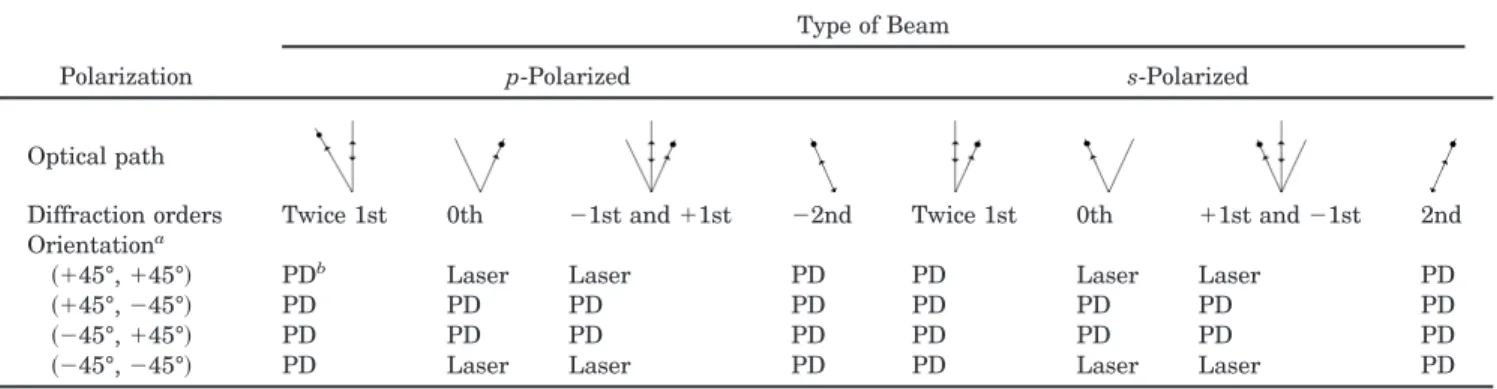
Simple analysis of the proper propagation of the ⫾1st-order diffracted light indicates that the orien-tation of Q1 and Q2 influences how the 0th- and the 2nd-order diffracted beams propagate to the photo-detectors or back to the laser. To prevent laser mode hopping we guide the 0th-order diffracted light away from the laser cavity, as it has the strongest light intensity. The destinations of the light beams with different diffraction orders and different Q1 and Q2
orientations are summarized in Table 1. It is clear from Table 1 that 共⫹45°, ⫺45°兲 and 共⫺45°, ⫹45°兲 quarter-wave plate orientations guided to the 0th or-der diffract beams away from the laser cavity. In-stead, the 0th-order diffracted beams are sent to the photodiodes. We can see that the 0th-order dif-fracted light beam will not decrease the quadrature signals in this four-photodiode configuration as dif-ferential amplifications are adopted.
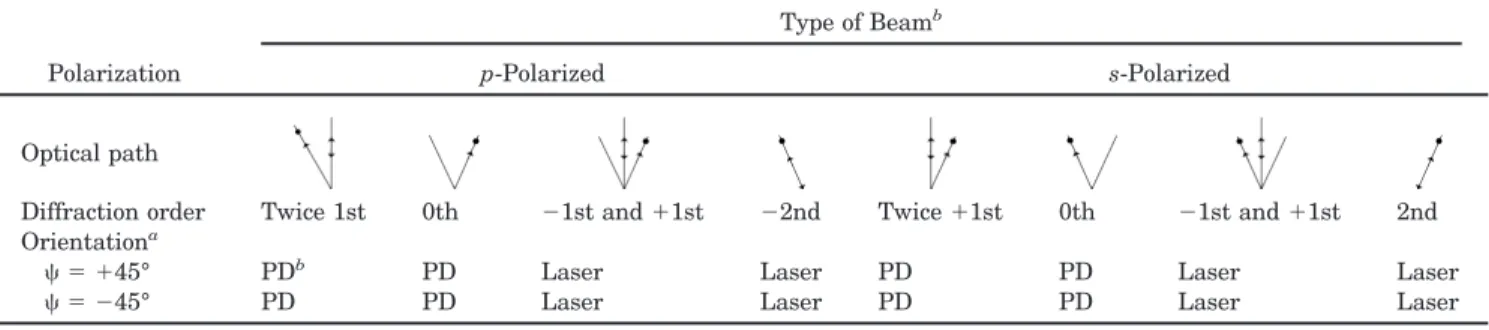
In addition to the 0th-order diffracted beams, 2nd-order diffracted light, which possesses the same Dopp-ler frequency shift as that of the twice diffracted 1st-order light beam, also enters the photodiodes. A moire pattern between the two light beams mentioned above may appear at misaligned positions. Either of two approaches can be adopted to solve this problem. One is to pursue precise alignment and the other is to develop a slightly modified configuration. This con-figuration inserts a quarter-wave plate into the 1⫻ telescope 共instead of using two quarter-wave plates, Q1 and Q2兲 in the configuration 共Fig. 1兲, which sends the 2nd-order diffracted light back to the laser cavity where the moire noise can be completely eliminated. This alternative configuration also has the advantage of reduced size, as fewer optical components are used. The destinations of the unwanted light beams in this configuration are given in Table 2, which indicates that the light returning after the⫹1st and the ⫺1st orders, as well as the 2nd-order diffraction light beam, goes back to the laser cavity. No laser mode hopping is predicted, as the intensities of the light beams are low because of the low associated diffraction efficiency, as we verified experimentally.
B. Folded 1⫻ Telescope
The primary alignment tolerance of the DiLENS of mechanical runout can actually be attributed to the efficiency of a built-in folded 1⫻ telescope design con-sisting of lens L and mirror M3 共Fig. 1兲. The dis-tances between the lens and the grating as well as between the lens and the mirror are set to be equal to the focal length of lens L. We use paraxial analy-sis12,13herein to examine how the 1⫻ telescope optics
can improve the system’s tolerance. Note that the tilt angle of the grating during operation is typically
Table 1. Destination of Light Beams Associated with Several Orientations of Quarter-Wave Plates Q1 and Q2 in Fig. 1
Polarization
Type of Beam
p-Polarized s-Polarized
Optical path
Diffraction orders Twice 1st 0th ⫺1st and ⫹1st ⫺2nd Twice 1st 0th ⫹1st and ⫺1st 2nd
Orientationa
共⫹45°, ⫹45°兲 PDb Laser Laser PD PD Laser Laser PD
共⫹45°, ⫺45°兲 PD PD PD PD PD PD PD PD
共⫺45°, ⫹45°兲 PD PD PD PD PD PD PD PD
共⫺45°, ⫺45°兲 PD Laser Laser PD PD Laser Laser PD
aThe quarter-wave plates’ fast-axis azimuth angles共Fig. 2兲 are expressed as 共
Q1andQ2兲.
less than 1°, and a properly designed lens can cer-tainly justify the paraxial analysis used. Consider the optical layout shown in Fig. 3, where h0and 0
represent the height and the emitted angle, respec-tively, of the light beam diffracted from the grating. If the grating is perfectly aligned, height h0and angle
0will both be zero. ⌬Z represents the stand-off of
the grating caused by the mechanical runout during operation, and f is the focal length of the lens. The height and the angle of light beam coming from the folded 1⫻ telescope can be expressed as12
冋
1 ⫺f ⫺⌬Z 0 1册冋
1 0 1兾f 1册冋
1 ⫺f 0 1册冋
1 0 0 ⫺1册冋
1 f 0 1册
冋
1 0 ⫺1兾f 1册冋
1 f⫹ ⌬Z 0 1册再
h0 0冎
⫽再
⫺h0⫺ 2⌬Z ⫻ 0 0冎
. (22) Equation共22兲 clearly denotes that the angle of the returning beam is identical to the incident angle for all stand-off and tilt. This means that the returning light beam always propagates in exactly the opposite direction from the original incident light beam. It basically states that a folded 1⫻ telescope resembles a corner cube with its tip located at the mirror’s re-flection surface such as to guarantee parallelism be-tween the incident and the returning light beams. Such a property prevents deviation of the light beamwhen runout is present and significantly enhances the alignment tolerance.
In spite of some apparent similarities between the folded 1⫻ telescope and the so-called cat’s-eye config-uration,7there are fundamental differences that
en-able the DiLENS to have superior performance. This case is an excellent example: A single compo-nent change can lead to a dramatic performance dif-ference in a laser encoder system. Under a paraxial assumption, the 1兾4-pitch GRIN lens14in a cat’s-eye
configuration is equivalent to a typical thin lens set at the middle position of a rod whose focal length equals half of the rod’s length. The cat’s-eye configuration cannot be designed as a 1⫻ telescope because the GRIN lens would then come into contact with the grating. As the distance between the grating and the lens cannot be set to f, the analysis summarized by Eq. 共22兲 shows that the deviation in height is caused by the oblique incidence.
In the cat’s-eye configuration, the spatial filter de-sign trades off wave-front cleanness for light energy, which can lead to degradation in the signal-to-noise ratio. The newly disclosed configuration, however, combines the conjugate wave created by the folded 1⫻ telescope and the grating symmetry to eliminate aber-rations associated with grating-scale runout without incurring any energy loss. More specifically, because the distance between the grating and the lens as well as the distance between the lens and the mirror equals the focal length of the lens, a simple relationship be-tween the incident wave and the returned wave exists and can be shown by use of Fourier optics, where15
ur共 x, y兲 ⫽ ui共⫺x, ⫺y兲 (23)
and where uirepresents the incident light beam emit-ted from the grating and uris the light beam returning
to the grating. The inverse symmetry shown in Eq. 共23兲 has its origin rooted in the two Fourier transforms when the light beam passes through the lens twice. Because the aberration introduced by a linear grating is still a plane wave, incident wave uihas the form
ui共 x, y兲 ⫽ A exp关 j共kxx⫹ kyy兲兴. (24)
Here A represents the amplitude of the wave, and the phase term exp关 j共kxx⫹ kyy兲兴 shows the phase error
caused by grating-runout-induced aberrations. As a Fig. 3. Folded 1⫻ telescope configuration with h0and0, which
represent the height and the emitting angle, respectively, of the light beam diffracted from the grating.
Table 2. Destination of Light Beams Associated with Several Fast-Axis Azimuth Angles of a Quarter-Wave Plate for the Alternative Configuration
Polarization
Type of Beamb
p-Polarized s-Polarized
Optical path
Diffraction order Twice 1st 0th ⫺1st and ⫹1st ⫺2nd Twice⫹1st 0th ⫺1st and ⫹1st 2nd
Orientationa
⫽ ⫹45° PDb PD Laser Laser PD PD Laser Laser
⫽ ⫺45° PD PD Laser Laser PD PD Laser Laser
aFig. 2.
result of this inverse symmetry, the returning wave will become
ur共 x, y兲 ⫽ A exp关⫺j共kxx⫹ kyy兲兴, (25)
which is conjugate to the incident light beam. The phase error is canceled out when the returning light beam impinges upon the grating again. In other words, the wave-front reconstruction concept of a folded 1⫻ telescope really is an optical phase-conjugation technique that has actions similar to those of a four-wave mixing technique when one is dealing with plane-wave aberration.
To further verify the alignment tolerance of the DiLENS, optical ray tracing was adopted to enable us to pursue further simulations.16 Two misaligned
conditions were found to be most detrimental. The first condition causes the returning light beam to separate, which in turn significantly reduces the ac portion of the interference signal while the dc portion is retained. As the modulated signal is embedded within the ac portion of the interference signal, this condition reduces the signal strength and the signal-to-noise ratio. The second condition moves the light spot out of the photodiode range to reduce the overall interference signal’s strength, no matter whether it is ac or dc. Therefore our tolerance analysis was per-formed under the following two conditions:
1. The separation captured by all the photodiodes between the two beams was less than one fourth of the diameter of the beam, which is 2 mm in the actual DiLENS setup.
2. The center of the beam spots was within the photodiodes’ range, which is 4 mm in the actual DiLENS setup.
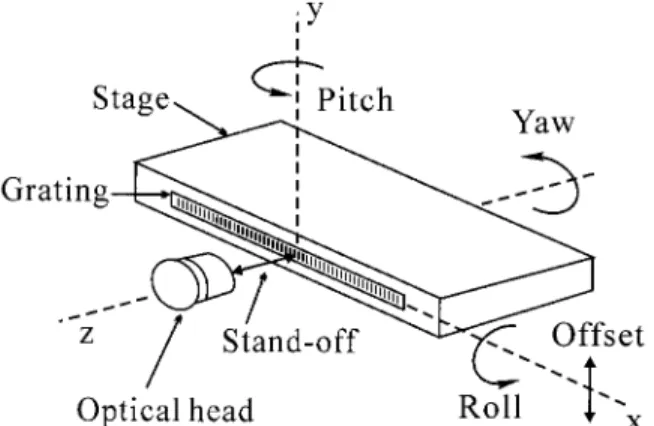
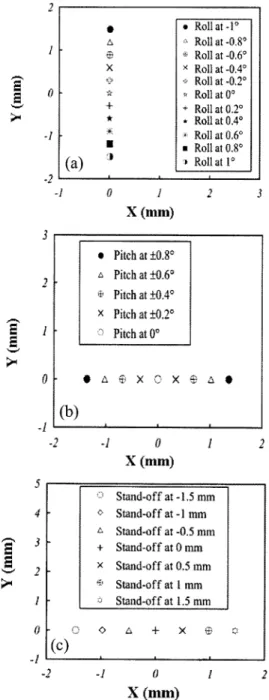
The mechanical runout associated with the grating scale can be as defined in Fig. 4, which includes roll, pitch, yaw, stand-off, and offset. Using a ray-tracing program16 yields the movements of the misaligned
light spots shown in Fig. 5. It is clear that yaw and offset do not influence the spot position; i.e., the DiLENS is immune from the effects of yaw and the offset. Furthermore, pitch was found to be the pri-mary cause of beam separation, as the positions of the
two returning light spots move together when the grating scale experiences roll or stand-off runout. The quantitative results derived from the simulation are shown in Fig. 6, and the detailed tolerance of the DiLENS is summarized in Table 3. Comparing the data obtained and the specifications of the state-of-the-art diffractive laser encoder7 shows that the
DiLENS has a tolerance of runout that is higher by a factor of 6 –20 than those of conventional systems.17
C. Effect of Grating Geometry
It should be noted that perfect quadrature signals result in a circular pattern in Lissajous space. How-ever, a grating generally has different diffraction ef-ficiencies for p-polarized and s-polarized incident light beams, and this effect tends to distort the cir-cular Lissajous pattern, causing it to become ellipti-cal, which in turn induces errors during phase decoding.18,19 The DiLENS is immune to this effect,
and it is clear from Eqs.共17兲 and 共18兲 that a must be maximized to enhance the interference signal and thus to improve the grating’s diffraction efficiency. It is known that grating profile, pitch, duty cycle, and depth will all influence diffraction efficiency. From Eq. 共7兲 it is clear that maximizing a maximizes 关kp共兲kp共0兲 ⫹ ks共兲ks共0兲兴
2
.
A rigorous coupled-wave analysis 共RCWA兲 has been developed over the years to serve as an exact formulation for the grating diffraction problem that specifies the grating’s responses to various polariza-tions, especially when the grating pitch is close to or shorter than the wavelength of light.20 –23 To
opti-mize the grating-scale design we used a commercially available software package based on RCWA to design the grating geometry to obtain the optimal关kp共兲kp共0兲 ⫹ ks共兲ks共0兲兴
2
. Experimental verification of the sim-ulated results is presented here.
3. Experimental Setup
A series of experiments was carried out to verify the validity of the theories described above. The exper-imental setup, adopted to verify the alignment toler-Fig. 4. Definition of runout for a moving grating scale.
Fig. 5. Qualitative representation of misaligned beam spots for photodiodes under different runout conditions in which separation was found as a result of pitch only.
ance as shown in Fig. 7, was developed based on an autocollimator24and a two-frequency interferometer
system.25 The autocollimator measures the change
in grating angle, and the interferometer determines the additional displacement caused by the rigid body rotation that must be compensated for. The mea-sured alignment tolerance is shown in Table 3 and agrees well with the simulation. In addition, com-parisons of the experimental and the simulated
dif-Fig. 6. Spot location of photodiode for roll, pitch, and stand-off runout.
Fig. 7. Experimental setup for measuring grating-scale runout and determining the alignment tolerance.
Fig. 8. Diffraction efficiency of a grating scale at different inci-dence angles, where the simulated data and the experimental data agree well with each other: 共a兲 measured TE efficiencies, 共b兲 mea-sured TM efficiencies.
Table 3. Alignment Tolerance of the DiLENS As Determined by Ray Tracing and the Experimental Setupa
Alignment Tolerance Calculated by Ray Tracingb Experimental Data State-of-Art Encoderc
Roll共arc min兲 ⫾60 ⫾58 ⫾3
Pitch共arc min兲 ⫾20 ⫾23 ⫾20
Yaw共deg兲 ⫾3 ⫾3.2 ⫾20
Stand-off共mm兲 ⫾1.5 ⫾1.3 ⫾0.2
Offset共mm兲 ⫾2 ⫾2 ⫾0.3
aThe tolerance specification of the state-of-art encoder is quoted
from Ref. 17 for comparison.
bRef. 16. cRef. 7.
fraction efficiencies at various incident angles are shown in Fig. 8. It is clear from the data shown that simulation results obtained with the RCWA software agree well with the experimental data.
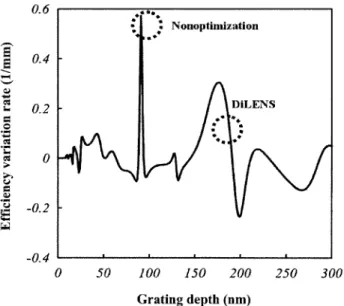
With the validity of the RCWA verified, we per-formed many more simulations to locate the optimum grating-scale geometry. Finally, a sine profile with a 190-nm grating depth was found to yield the max-imum signal-to-noise ratio. This result can be fur-ther demonstrated by the data. The simulated diffraction efficiency and its variation relative to grat-ing depth are shown in Figs. 9 and 10, respectively. Compared to the 90-nm grating depth adopted in today’s state-of-the-art diffractive laser encoders,7
the grating scale geometry adopted by the DiLENS yields an improvement by a factor of 10 while it achieves a lower diffraction variation rate. This lower variation rate can be translated into a better manufacturing tolerance.
A feedback-controlled linear piezoelectric stage was developed as the platform for the DiLENS per-formance evaluations. To achieve nanometer reso-lution we used a two-frequency interferometer25 as
the sensor. To guarantee smooth movement, a Nanomotion SP4-02 ultrasonic motor was driven by use of a sensor to complete the closed-loop control. The laboratory environment was found to have a room temperature of 21.306 °C, with a standard de-viation of 0.038 °C. In addition, the average atmo-spheric pressure was 1.000071 atm, with a standard Fig. 9. Simulation of the optimization criterion 关kp共兲kp共0兲 ⫹
ks共兲ks共0兲兴
2at various grating depths; the optimized depth was 190 nm.
Fig. 10. Simulation of rate of variation in diffraction efficiency versus grating depth. The variation rate was minimum at a 190-nm grating depth.
Fig. 11. Experimental results of repeatability tests in which 10 data sets共at 2, 4, 6, 8, 10, 12, 14, 16, 18, and 20 mm兲 were obtained. The repeatability represents the standard deviation of these 10 data sets; the average repeatability was 4.48 nm across 20 mm.
Fig. 12. Experimental results of accuracy tests in which 10 data sets共at 2, 4, 6, 8, 10, 12, 14, 16, 18, and 20 mm兲 were obtained. The accuracy represents the root mean square of these 10 data sets; the average accuracy was 33.71 nm across 20 mm.
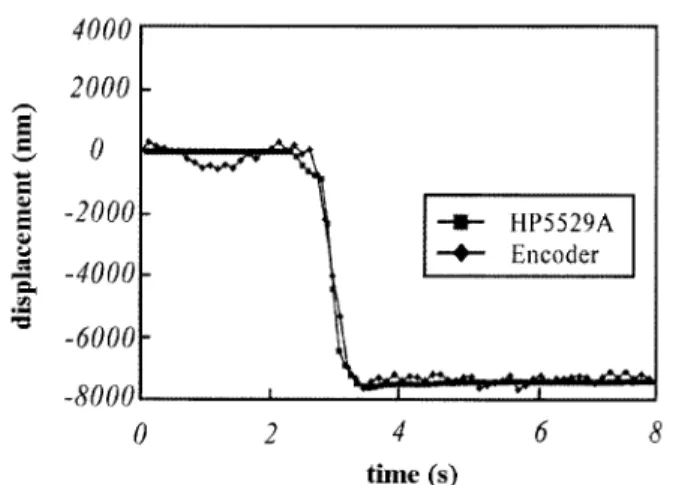
deviation of 0.0002029 atm. The desk was found to vibrate at 10 Hz, which caused vibration noise. By measuring the data for 10 readings共at 2, 4, 6, 8, 10, 12, 14, 16, 18, and 20 mm兲 the root-mean-square and standard deviations of these data were obtained. Denoting the standard deviation as the repeatability and the root mean square as the accuracy yields the measured repeatability and accuracy of the DiLENS shown in Figs. 11 and 12, respectively. The results show that the average repeatability achieved was 4.48 nm and the average accuracy was 33.71 nm. Figure 13 compares the displacement measured by the DiLENS and by the two-frequency interferometer. The discrepancy between these two measurements can be attributed to environmental disturbance and to the degree of accuracy achievable by the two-frequency interferometer, which is⬃10 nm.
4. Conclusions
A series of newly developed laser encoders that pos-sess high head-to-grating scale tolerance has been designed and constructed. Theoretical analysis has shown that the improved tolerance is due to the built-in folded 1⫻ telescope that guarantees parallel-ism between the incident and the returning light beams. The corner-cubelike feature of the folded 1⫻ telescope was demonstrated by use of both paraxial and ray tracing. A factor-of-6 –20 improvement in tolerance compared with that of current state-of-the-art diffractive laser encoders was predicted and ver-ified experimentally. In addition, immunity of the DiLENS to differences in diffraction efficiency be-tween the p- and s-polarized light beams, which can hinder the performance of traditional diffractive laser encoders, can be seen. The optimal criteria for grating-scale geometry, identified theoretically as well as experimentally, were found to increase fur-ther both the signal-to-noise ratio and the grating-scale manufacturing tolerance.
This research was performed at the Nano-BioMEMS Laboratory of the Institute of Applied Me-chanics, National Taiwan University. This project
was partially supported under Ministry of Economic Affairs Department of Industrial Technology Devel-opment Program for Academia 91-EC-17-A-05-S1-0017 and partially supported by the National Science Council of Taiwan under project NSC92-2622-E-002-006.
References
1. N. Bobroff, “Recent advances in displacement measuring in-terferometry,” Meas. Sci. Technol. 4, 907–926共1993兲. 2. S. Hosoe, “Highly precise and stable laser displacement
mea-surement interferometer with differential optical passes in practical use,” Nanotechnology 4, 81– 85共1993兲.
3. V. G. Badami and S. R. Petterson, “A frequency domain method for the measurement of non-linearity in heterodyne interferometry,” Precis. Eng. 24, 41– 49共2000兲.
4. V. P. Drachev and S. V. Perminov, “Nonlinearity phase shift without cascaded second-order processes and third-order non-linearity,” Appl. Phys. B 71, 193–196共2000兲.
5. D. Lin, H. Jiang, and C. Yin, “Analysis of nonlinearity in a high-resolution grating interferometer,” Opt. Laser Technol.
32, 95–99共2000兲.
6. W. W. Chiang and C. K. Lee, “Wavefront reconstruction optics for use in disk drive position measurement system,” U.S. patent 5,442,172共15 August 1995兲.
7. T. Nishimura, M. Tsukiji, S. Ishii, K. Ishizuka, and Y. Kubota, “Optical type encoder,” U.S. patent 5,000,542共19 March 1991兲. 8. L. Drain, The Laser Doppler Technique共Wiley, New York, 1980兲. 9. F. Durst, A. Melling, and J. Whitelaw, Principles and Practice
of Laser Doppler Anemometry共Academic, New York, 1981兲.
10. R. Guenther, Modern Optics共Wiley, New York, New York, 1990兲.
11. W. J. Wu, C. K. Lee, and C. T. Hsieh, “On the signal processing algorithms for Doppler effect based nanometer positioning sys-tems,” Jpn. J. Appl. Phys. Part 1 38, 1725–1729共1999兲. 12. A. Cox, A System of Optical Design共Focal Press, New York,
1967兲.
13. E. Hecht, Optics共Addison-Wesley, New York, 1998兲. 14. H. Haus, Wave and Fields in Optoelectronics共Prentice-Hall,
Englewood Cliffs, N.J., 1984兲.
15. J. W. Goodman, Introduction to Fourier Optics共McGraw-Hill, New York, 1996兲.
16. L. Mickens, R. Coblentz, and S. Montepio, LightTools User
Guide共Optical Research Associates, Pasadena, Calif., 2000兲.
17. Canon U.S.A., Model L-104 Laser Linear Encoder 共Canon U.S.A., New York兲.
18. E. G. Leowen and E. Popov, Diffraction Gratings and
Appli-cations共Marcel Dekker, New York, 1997兲.
19. K. G. Masreliez, “Position detection and method of measuring position,” U.S. patent 5,104,225共14 April 1992兲.
20. E. N. Glytsis and T. K. Gaylord, “Rigorous three-dimensional coupled-wave diffraction analysis of single and cascaded aniso-tropic grating,” J. Opt. Soc. Am. A 4, 2061–2080共1987兲. 21. R. Magnusson and T. K. Gaylord, “Equivalence of multiwave
coupled-wave theory and modal theory of periodic-media dif-fraction,” J. Opt. Soc. Am. 68, 1777–1779共1978兲.
22. M. G. Moharam and T. K. Gaylord, “Formulation for stable and efficient implementation of rigorous coupled-wave analysis of binary gratings,” J. Opt. Soc. Am. A 12, 1068 –1076共1995兲. 23. D. Fluckiger, GSolver User’s Manual共Grating Solver
Devel-opment Company, Allen, Tex., 1991兲.
24. UDT Instruments, Electronic Autocollimators 共UDT Instru-ments, Baltimore, Md.兲, http:兾兾www.udtinstruments.com. 25. Hewlett-Packard Company, HP 5529A Dynamic Calibrator
Measurements Reference Guide 共Hewlett-Packard Company,
Santa Clara, Calif., 1995兲. Fig. 13. Comparison of displacement data measured by the