Performance of Value
Investing Strategies
in Japan’s Stock
Market
June 28, 2013
Sponsored by:Value Partners Center for
3 | 9 P a g e s
Performance of Value Investing Strategies
in Japan’s Stock Market
Introduction
This white paper examines the performance of several value investing strategies based on various quantitative value measures of stocks in the Japanese stock market. These strategies significantly outperformed the aggregate stock market in the period from January 1975 to December 2011. In addition, they generated promising profits in the long-term bear market in the 1990–2011 period when the stock market dropped 62.21%.
Data Sample and Measures
We retrieve the daily total return index and market value of each stock and the Japanese equity market from Datastream. We also obtain accounting variables such as book value, earnings, cash flow, debt, and dividend from Worldscope. We delete exchange-traded funds (ETFs) and warrants from our study. We also ignore the bottom one-third of stocks based on their market value in order to eliminate any penny stocks that filed for bankruptcy each month. Our analysis focuses on the 37-year period between January 1975 and December 2011, during which Japanese stocks fell into a bear market and remained there for two decades. We measure a stock’s value by its book-to-market, dividend yield, earnings-to-price, cash flow-to-price, and leverage-to-price.
The Performance of Value Investing Strategies
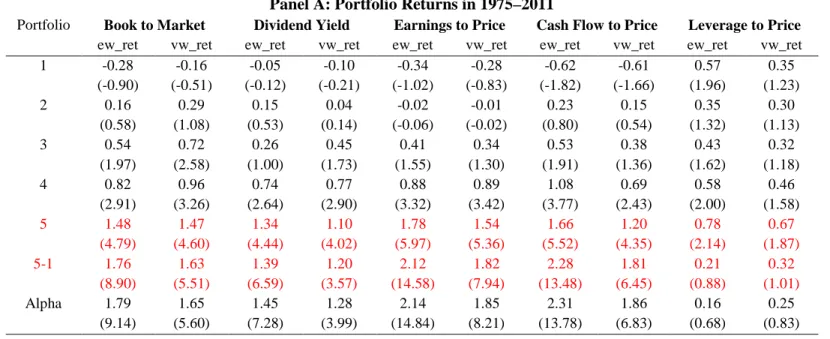
At the end of each month, we sort stocks into five portfolios based on five value measures in that month. We calculate both the equal- and value-weighted one-month future returns of a portfolio. The former is calculated by taking the simple average of the returns of all stocks in the portfolio whereas the latter is calculated by weighting each stock’s returns based on its market capitalization. This methodology implies that the five portfolios are rebalanced monthly according to the five value measures in the portfolios in the 37 years. We report their performance in Table 1.
We find that the equal-weighted portfolios with the highest value of book-to-market, dividend yield, earning-to-price, cash flow-to-price, and leverage-to-price generated returns of 1.48%, 1.34%, 1.78%, 1.66% and 0.78% in the 1975–2011 period and 0.84%, 0.78%, 1.31%, 1.13% and 0.0% in the 1990–2011 period, respectively. In contrast, the Japanese stock market lost 62.21% in the latter period. We also find that the equal-weighted portfolios with the highest value of book-to-market, dividend yield, earning-to-price, and cash flow-to-price significantly outperformed stocks with lowest values of these measures. The zero-cost portfolios that long the portfolios with the highest values of these measures (5) and short the portfolios with the lowest values of these measures (1) generated returns of 1.76%, 1.39%, 2.12%, and 2.28% and market-adjusted
4 | 9 P a g e s
excess returns (alpha) of 1.79, 1.45%, 2.14%, and 2.31% in CAPM per month over the 1975– 2011 period, respectively. These portfolios achieved even higher returns and market-adjusted excess returns over the 1990–2011 period. In addition, we find similar results for value-weighted portfolios sorted by these measures, as well as for three-, six-, nine-, and twelve-month holding periods. But we do not find significant results for investing strategies based on the leverage-to-price.
Table 1: Returns of Value Investing Strategies
Panel A: Portfolio Returns in 1975–2011
Portfolio Book to Market Dividend Yield Earnings to Price Cash Flow to Price Leverage to Price
ew_ret vw_ret ew_ret vw_ret ew_ret vw_ret ew_ret vw_ret ew_ret vw_ret 1 -0.28 -0.16 -0.05 -0.10 -0.34 -0.28 -0.62 -0.61 0.57 0.35 (-0.90) (-0.51) (-0.12) (-0.21) (-1.02) (-0.83) (-1.82) (-1.66) (1.96) (1.23) 2 0.16 0.29 0.15 0.04 -0.02 -0.01 0.23 0.15 0.35 0.30 (0.58) (1.08) (0.53) (0.14) (-0.06) (-0.02) (0.80) (0.54) (1.32) (1.13) 3 0.54 0.72 0.26 0.45 0.41 0.34 0.53 0.38 0.43 0.32 (1.97) (2.58) (1.00) (1.73) (1.55) (1.30) (1.91) (1.36) (1.62) (1.18) 4 0.82 0.96 0.74 0.77 0.88 0.89 1.08 0.69 0.58 0.46 (2.91) (3.26) (2.64) (2.90) (3.32) (3.42) (3.77) (2.43) (2.00) (1.58) 5 1.48 1.47 1.34 1.10 1.78 1.54 1.66 1.20 0.78 0.67 (4.79) (4.60) (4.44) (4.02) (5.97) (5.36) (5.52) (4.35) (2.14) (1.87) 5-1 1.76 1.63 1.39 1.20 2.12 1.82 2.28 1.81 0.21 0.32 (8.90) (5.51) (6.59) (3.57) (14.58) (7.94) (13.48) (6.45) (0.88) (1.01) Alpha 1.79 1.65 1.45 1.28 2.14 1.85 2.31 1.86 0.16 0.25 (9.14) (5.60) (7.28) (3.99) (14.84) (8.21) (13.78) (6.83) (0.68) (0.83)
Panel B: Portfolio Returns in 1990–2011
Portfolio Book to Market Dividend Yield Earnings to Price Cash Flow to Price Leverage to Price
ew_ret vw_ret ew_ret vw_ret ew_ret vw_ret ew_ret vw_ret ew_ret vw_ret 1 -0.98 -0.79 -0.97 -1.03 -1.06 -0.80 -1.42 -1.30 -0.05 -0.11 (-2.29) (-1.99) (-1.61) (-1.62) (-2.21) (-1.69) (-2.97) (-2.56) (-0.12) (-0.29) 2 -0.44 -0.28 -0.43 -0.56 -0.72 -0.67 -0.54 -0.45 -0.19 -0.14 (-1.18) (-0.81) (-1.13) (-1.49) (-1.89) (-1.76) (-1.46) (-1.24) (-0.55) (-0.41) 3 -0.10 0.16 -0.40 -0.15 -0.27 -0.37 -0.03 -0.22 -0.13 -0.20 (-0.28) (0.43) (-1.16) (-0.46) (-0.79) (-1.16) (-0.09) (-0.63) (-0.37) (-0.58) 4 0.22 0.46 0.11 0.17 0.28 0.36 0.50 0.22 -0.09 -0.27 (0.57) (1.17) (0.28) (0.49) (0.77) (1.09) (1.30) (0.62) (-0.24) (-0.74) 5 0.84 0.90 0.78 0.53 1.31 1.08 1.13 0.69 0.00 -0.21 (1.98) (2.10) (1.88) (1.52) (3.19) (2.90) (2.79) (2.02) (-0.01) (-0.46) 5-1 1.82 1.69 1.75 1.56 2.37 1.88 2.55 2.00 0.04 -0.10 (7.53) (4.68) (6.68) (3.56) (12.99) (6.31) (13.26) (5.65) (0.15) (-0.28) Alpha 1.80 1.69 1.64 1.40 2.33 1.81 2.50 1.89 0.12 -0.02 (7.46) (4.65) (7.21) (3.53) (13.11) (6.31) (13.55) (5.68) (0.45) (-0.06) Note: Adjusted t-statistics are in parentheses
5 | 9 P a g e s Superior Performance against the Japanese Stock Market
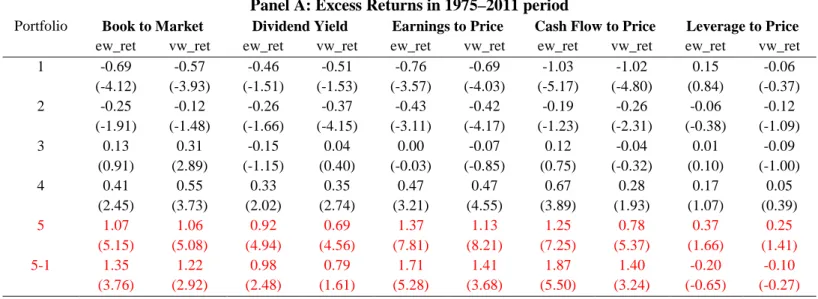
We also investigate the performance of these value investing strategies against the aggregate Japanese stock market. To do so we subtract the equal- and value-weighted returns of each portfolio from the total market returns to obtain the excess returns. As shown in Table 2, we find that the equal-weighted portfolios with the highest value of book-to-market, dividend yield, earning-to-price, cash flow-to-price, and leverage-to-price outperformed the aggregate stock market by 1.07%, 0.92%, 1.37%, 1.25% and 0.37% per month in the 1975–2011 period and 1.04%, 0.99%, 1.51%, 1.34% and 0.2% per month in the 1990–2011 period, respectively. The zero-cost portfolios based on these value measures also outperformed the aggregate stock market and to a larger extent in both periods except the portfolio based on the leverage-to-price. Note that the Japanese stock market plunged 62.21% while the Nikkei 225 dropped from 38916 to 8455 between 1990 and 2011.
Table 2: Excess Returns of Value Investing Strategies
Panel A: Excess Returns in 1975–2011 period
Portfolio Book to Market Dividend Yield Earnings to Price Cash Flow to Price Leverage to Price
ew_ret vw_ret ew_ret vw_ret ew_ret vw_ret ew_ret vw_ret ew_ret vw_ret 1 -0.69 -0.57 -0.46 -0.51 -0.76 -0.69 -1.03 -1.02 0.15 -0.06 (-4.12) (-3.93) (-1.51) (-1.53) (-3.57) (-4.03) (-5.17) (-4.80) (0.84) (-0.37) 2 -0.25 -0.12 -0.26 -0.37 -0.43 -0.42 -0.19 -0.26 -0.06 -0.12 (-1.91) (-1.48) (-1.66) (-4.15) (-3.11) (-4.17) (-1.23) (-2.31) (-0.38) (-1.09) 3 0.13 0.31 -0.15 0.04 0.00 -0.07 0.12 -0.04 0.01 -0.09 (0.91) (2.89) (-1.15) (0.40) (-0.03) (-0.85) (0.75) (-0.32) (0.10) (-1.00) 4 0.41 0.55 0.33 0.35 0.47 0.47 0.67 0.28 0.17 0.05 (2.45) (3.73) (2.02) (2.74) (3.21) (4.55) (3.89) (1.93) (1.07) (0.39) 5 1.07 1.06 0.92 0.69 1.37 1.13 1.25 0.78 0.37 0.25 (5.15) (5.08) (4.94) (4.56) (7.81) (8.21) (7.25) (5.37) (1.66) (1.41) 5-1 1.35 1.22 0.98 0.79 1.71 1.41 1.87 1.40 -0.20 -0.10 (3.76) (2.92) (2.48) (1.61) (5.28) (3.68) (5.50) (3.24) (-0.65) (-0.27)
Panel B: Excess Returns in 1990–2011 period
Portfolio Book to Market Dividend Yield Earnings to Price Cash Flow to Price Leverage to Price
ew_ret vw_ret ew_ret vw_ret ew_ret vw_ret ew_ret vw_ret ew_ret vw_ret 1 -0.78 -0.59 -0.76 -0.83 -0.86 -0.60 -1.21 -1.10 0.16 0.10 (-3.48) (-3.10) (-1.95) (-1.93) (-3.01) (-2.55) (-4.57) (-3.89) (0.73) (-0.29) 2 -0.24 -0.08 -0.23 -0.35 -0.51 -0.46 -0.34 -0.24 0.01 0.07 (-1.41) (-0.78) (-1.13) (-3.52) (-2.97) (-3.98) (-1.88) (-2.06) (0.06) (-0.41) 3 0.10 0.36 -0.19 0.05 -0.07 -0.17 0.17 -0.02 0.07 0.00 (0.56) (2.56) (-1.18) (0.42) (-0.44) (-1.70) (0.93) (-0.18) (0.41) (-0.58) 4 0.42 0.66 0.31 0.38 0.48 0.56 0.70 0.42 0.11 -0.07 (2.04) (3.55) (1.60) (2.34) (2.67) (4.21) (3.50) (3.58) (0.55) (-0.74) 5 1.04 1.11 0.99 0.74 1.51 1.29 1.34 0.90 0.20 0.00 (4.10) (4.34) (4.20) (4.01) (6.85) (7.49) (6.13) (5.79) (0.69) (-0.46) 5-1 2.02 1.89 1.95 1.77 2.57 2.09 2.76 2.20 0.25 0.10 (4.53) (3.75) (3.67) (2.64) (5.97) (4.01) (6.18) (3.81) (0.67) (0.24) Note: Adjusted t-statistics are in parentheses
6 | 9 P a g e s The Astonishing Cumulative Payoff of Value Investing Strategies for a $1 Investment
In Figure 1, we investigate the cumulative payoff in dollar terms of investing $1 in the portfolios having the highest values of our value measures with monthly portfolio rebalancing in the 1980– 2011 period. We also compare this payoff with the cumulative payoff from a $1 invested in the aggregate stock market. We find that the investing strategies based on stock’s book-to-market, dividend yield, earning-to-price , cash flow-to-price , and leverage-to-price grew $1 into $115.98, $81.88, $433.86, $281.49, and $6.62 respectively, while the aggregate stock market turned $1 into a mere $2.76, in the 1980–2011 period. This implies that these value investing strategies rewarded investors 42.0, 29.6, 157, 102 and 2.40 times what the Japanese stock market did. The effective monthly compound returns of the various investing strategies are 1.25%, 1.16%, 1.60%, 1.48% and 0.49%, while the aggregate stock market only delivered 0.27% in this period.
Figure 1. Cumulative Payoff of $1 Invested in Japan’s Total Market Index and in Portfolios with the Highest
Book-to-Market, Dividend Yield, Earnings-to-Price, Cash Flow-to-Price, and Leverage-to-Price with Monthly Portfolio Rebalancing in the Japanese Stock Market.
0 50 100 150 200 250 300 350 400 450 500 Ja n-198 0 Ap r-1981 Ju l-19 82 O ct -198 3 Ja n-198 5 Ap r-1986 Ju l-19 87 O ct -198 8 Ja n-199 0 Ap r-1991 Ju l-19 92 O ct -199 3 Ja n-199 5 Ap r-1996 Ju l-19 97 O ct -199 8 Ja n-200 0 Ap r-2001 Ju l-20 02 O ct -200 3 Ja n-200 5 Ap r-2006 Ju l-20 07 O ct -200 8 Ja n-201 0 Ap r-2011 DOLLA R $
CUMULATIVE PAYOFF OF LEVERAGE-TO-PRICE, BOOK-TO-MARKET, DIVIDEND YIELD, EARNINGS-TO-PRICE, AND CASH FLOW-TO-PRICE INVESTING STRATEGIES
AND THE RETURN INDEX OF THE JAPANESE STOCK MARKET, 1980–2011
Leverage to price Book to market Dividend yield Earnings to price OCF to price MARKET
7 | 9 P a g e s Mouth-Watering Returns on Investment in the Long-term Bear Market
It is intriguing to find that four out of five value investing strategies actually rewarded investors with positive returns in the bear market that spanned two decades from 1990 to 2011. These value investing strategies are sorted based on book-to-market, dividend yield, earning-to-price, and cash flow-to-price. They turned a $1 into $4.77, $4.25, $17.17, and $10.91, implying large profits of 377%, 325%, 1617%, and 991% respectively, while the stock market plunged 62.21% after reaching its peak in January 1990. In addition, every one of these value investing strategies continued to generate positive returns between the pre-global financial crisis peak in 2007 and December 2011.
Conclusion
We find that the value investing strategies based on book-to-market, dividend yield, earning-to-price, cash flow-to-earning-to-price, and leverage-to-price generated astonishing returns for investors in Japan’s stock market in the 1975–2011 period. In particular, the ones based on book-to-market, dividend yield, earning-to-price , and cash flow-to-price rewarded investors with sizable profits, whereas the Japanese stock market lost 62.21%, during the country’s two-decade-long bear market between 1990 and 2011.
About Value Partners Center for Investing (http://vpcenter.ust.hk/)
The Value Partners Center for Investing of the Hong Kong University of Science and Technology Business School is an academic and intellectual center supporting research and training on investing with an
emphasis on China and Hong Kong financial markets. It aims to promote Hong Kong's role as the regional asset management center. The center is sponsored by Value Partners Group Limited.
About Value Partners Group Limited (http://www.valuepartners.com.hk/en/home.html)
Value Partners is one of Asia’s largest asset management firms. Since its establishment in 1993, Value Partners has been a dedicated value investor with a focus on the Greater China region. The Group manages absolute return long-biased funds, long-short hedge funds, exchange-traded funds, quantitative funds, and private equity funds for institutional and individual clients in Asia Pacific, Europe and the United States.
Author Contact Information
Dr. Samuel Xin Liang Associate Director
Value Partners Center for Investing Tel: +852 2358 8204
Mobile: +852 9175 8951 Fax: +852 2358 1749 Email: [email protected]
Supporting Researchers: Ms. Cheuk, Man Yin Ms. Fang, Lei