On: 27 April 2014, At: 20:41 Publisher: Taylor & Francis
Informa Ltd Registered in England and Wales Registered Number: 1072954 Registered office: Mortimer House, 37-41 Mortimer Street, London W1T 3JH, UK
Liquid Crystals
Publication details, including instructions for authors and subscription information: http://www.tandfonline.com/loi/tlct20
Ferroelectric liquid crystalline polymers based on
mesogens with halogen-containing terminal groups
Yi-An Sha a , Ging-Ho Hsiue a , Chih-Ho Chiu a , Ru-Jong Jeng b & Hsing-Chieh Tai c aDepartment of Chemical Engineering, National Tsing Hua University, Hsinchu, Taiwan 300 ROC
b
Department of Chemical Engineering, National Chung Hsing University, Taichung, Taiwan 402 ROC
c
Department of Applied Chemistry, National Chiao Tung University, Hsinchu, Taiwan 300 ROC
Published online: 11 Nov 2010.
To cite this article: Yi-An Sha , Ging-Ho Hsiue , Chih-Ho Chiu , Ru-Jong Jeng & Hsing-Chieh Tai (2003) Ferroelectric liquid crystalline polymers based on mesogens with halogen-containing terminal groups, Liquid Crystals, 30:1, 71-80, DOI: 10.1080/0267829021000043349
To link to this article: http://dx.doi.org/10.1080/0267829021000043349
PLEASE SCROLL DOWN FOR ARTICLE
Taylor & Francis makes every effort to ensure the accuracy of all the information (the “Content”) contained in the publications on our platform. However, Taylor & Francis, our agents, and our licensors make no
representations or warranties whatsoever as to the accuracy, completeness, or suitability for any purpose of the Content. Any opinions and views expressed in this publication are the opinions and views of the authors, and are not the views of or endorsed by Taylor & Francis. The accuracy of the Content should not be relied upon and should be independently verified with primary sources of information. Taylor and Francis shall not be liable for any losses, actions, claims, proceedings, demands, costs, expenses, damages, and other liabilities whatsoever or howsoever caused arising directly or indirectly in connection with, in relation to or arising out of the use of the Content.
This article may be used for research, teaching, and private study purposes. Any substantial or systematic reproduction, redistribution, reselling, loan, sub-licensing, systematic supply, or distribution in any
form to anyone is expressly forbidden. Terms & Conditions of access and use can be found at http:// www.tandfonline.com/page/terms-and-conditions
L C, 2003, V. 30, N. 1, 71–80
Ferroelectric liquid crystalline polymers based on mesogens with
halogen-containing terminal groups
YI-AN SHA, GING-HO HSIUE*, CHIH-HO CHIU
Department of Chemical Engineering, National Tsing Hua University, Hsinchu, Taiwan 300 ROC
RU-JONG JENG
Department of Chemical Engineering, National Chung Hsing University, Taichung, Taiwan 402 ROC
and HSING-CHIEH TAI
Department of Applied Chemistry, National Chiao Tung University, Hsinchu, Taiwan 300 ROC
(Received 29 May 2002; accepted 23 August 2002)
A new series of halogen-containing side chain ferroelectric liquid crystal polymers was synthesized. Mesophases were characterized by differential scanning calorimetry, polarizing optical microscopy, X-ray diffraction and molecular simulation. The behaviour of the liquid crystalline phase was investigated with variation of chiral centres, spacer units and grafted ratios. It was found that the thermal stability and temperature range of the chiral smectic C phase decreased with increasing length of the oligo-oxyethylene spacer, and decreasing mesogenic group content. The bulky substituent attached to the chiral centre reduces molecular packing in smectic liquid crystal phases, which disturbs the orientation of the side chain liquid crystal polymer. Furthermore, the influence of molecular structure on electro-optical properties of FLCPs has been studied by broad band dielectric spectroscopy (from 0.1 to 1×10⁶ Hz).
1. Introduction mesophase [8]; (iii) copolymer and/or (iv) guest-host
systems that would exhibit better molecular mobility Ferroelectric liquid crystal polymers (FLCPs) have
due to the plasticizer effect [9]. been investigated extensively in recent decades. FLCPs
The dielectric properties of FLCPs are closely associated combine properties such as large spontaneous
polar-with the reorientation of mesogenic group and polar-with the ization, memory effect, high mobility, viscous flow,
relaxation (or response) time under an alternating electric and easy fabrication as thin solid films [1–4]. Despite
field. Zentel et al. observed several relaxation processes the fact that FLCPs are inferior to FLCs for fast
for FLCPs [10]. Below T
g, two relaxation processes switching electro-optical (EO) display applications due
corresponding to reorientation of the dipoles at the meso-to their higher viscosity, the aforementioned
character-genic group centre (b-relaxation), and the spacer group istics make them suitable for electro-optical device
(c-relaxation) are present. a-Relaxation corresponds to applications, such as light valves and memory devices
T
g, and the polymer main chain becomes mobile during [5, 6].
this transition. d-Relaxation is the reorientation of the In general, improvement of the molecular mobility of
long axis of the side chain group around the polymer FLCPs would lower their relaxation time. Four different
backbone. This relaxation can be observed at tempera-mechanisms have been proposed for increasing
molecu-tures higher than T
g for the liquid crystalline polymer. lar mobility: (i) a longer spacer length that would reduce
The collective FLC relaxation (Goldstone mode) in the the interaction between the FLC monomer and polymer
chiral smectic phase has been studied by several investi-backbone [7]; (ii) lateral substitution into the
meso-gators [7, 8]. The Goldstone mode appears in the chiral genic group leading to the formation of a less-ordered
smectic phase, with the fluctuation in the azimuthal orienta-tion of the director. This relaxaorienta-tion mode is an important dielectric characteristic in the chiral smectic phase.
*Author for correspondence; e-mail: [email protected]
L iquid Crystals ISSN 0267-8292 print/ISSN 1366-5855 online © 2003 Taylor & Francis Ltd http://www.tandf.co.uk/journals
DOI: 10.1080/0267829021000043349
In our previous work, a series of halogen(F, Cl, or Br)-containing FLCs and FLCPs were synthesized and characterized [11]. Except for the bromine-containing homopolymers PSn12Bs100 (n=1, 2 or 3), all the materials exhibited a wide temperature range chiral smectic C phase. It is important to note that bromine-containing liquid crystals do exhibit the chiral smectic C phase. The absence of a chiral smectic C phase for bromine-containing homopolymers may result from repulsion among the more bulky asymmetric chiral centres constrained by polymer chains. It seems to be a reasonable approach to remove the polymer chain constraint, leading to a copolymer system. In this paper, a new series of halogen-containing side chain liquid crystalline polymers and copolymers are described. These liquid crystalline materials consist of halogen-containing chiral moieties, oligo-oxyethylene spacers, and an ester core unit. The influences of the chiral moieties, grafted contents and spacer units on phase formation, thermal properties, conformations, and EO properties are discussed.
2. Experimental 2.1. Materials
Scheme. Synthesis of polysiloxane series PSn12Bsx (n=1, 2
Poly[(15~18%)methylhydrogensiloxane-co-(82~85%)- or 3; x=15, 35, 55 or 100).
dimethylsiloxane] ( [g]= 25 ~ 35), poly[(30 ~ 35%)-methylhydrogensiloxane-co-(65~70%)dimethylsiloxane] ([g]=25~30),
poly[(50~55%)methylhydrogensiloxane-co-(45~50%)dimethylsiloxane] ([g]=20~15) and poly- heated under reflux under nitrogen for a further 24 h. It
(methylhydrogensiloxane) ( [g]=30) were purchased was then evaporated under reduced pressure to give a
crude yellow viscous fluid. This product was purified by from United Chemical Technologies, Inc.; methanol
several precipitation with methanol, and dried under was purchased from TEDIA. All the above chemicals
vacuum. were used as received. Toluene was purchased from
TEDIA and distilled over sodium under nitrogen using benzophenone as an indicator.
2.3. Characterization
1H NMR spectra were obtained with a Bruker
2.2. Synthesis AM-400 NMR spectrometer. Transition temperatures
The synthesis and characterization of FLC monomers were determined as the maxima of the endothermic or
have been reported previously [10]. The synthesis of exothermic peaks obtained from thermal scans using a the liquid crystalline polysiloxanes is outlined in the Seiko SSC 5200 differential scanning calorimeter (DSC). scheme. These polysiloxanes were synthesized via a hydro- Heating and cooling rates were 10°C min−1 in all cases, silation reaction as reported previously [10]. One example, and the transition temperatures were obtained from the the synthesis procedure for PS312Bs15, is described specified first cooling and second heating scans. A Nikon
below. Microphoto-Fx polarizing optical microscope (POM),
FLC monomer, MD312Bs (0.5 g, 10 mol % excess equipped with a Mettler FP82 hot stage, was used to
versus the Si–H groups present in the polysiloxane), was observe the thermal transitions and anisotropic textures. dissolved in 50 ml of freshly distilled toluene together X-ray diffraction (XRD) measurements were made with
with appropriate amounts of poly[(15~18%)methyl- a Rigaku R-axis IIC powder diffractometer. A
mono-hydrogensiloxane-co-(82~85%)dimethylsiloxane]. This chromatized X-ray beam from nickel-filtered Cu K
a solution was heated under reflux under nitrogen. Then radiation with a wavelength of 0.15406 nm was used. hydrogen hexachloroplatinate(IV) hydrate (100mg) in The X-ray diffractometer was temperature controlled
with a tolerance of±0.5°C. dry THF was injected by syringe. The solution was
73 FL C polymers with halogen terminal groups
2.4. Simulation 3.3. Spacer eVect
Series PSn12Bs15 (n=1, 2 or 3) was used to investi-Molecular dynamics simulations were carried out on
a Silicon Graphics Iris O2 workstation. The molecular gate the spacer effect on mesophases. PS112Bs15 (n=1) shows enantiotropic Ch, SmC*, and SmX phases dynamic trajectories were calculated with the aid of
Cerius2 supplied by Molecular Simulations, Inc. whereas PS212Bs15 (n=2) exhibits enantiotropic Ch
and SmC* phases. Meanwhile, PS312Bs15 (n=3)
Initial models were developed from a single
macro-molecule in vacuum, and were minimized by using exhibits only the SmC* phase. All three compounds
reveal wide temperature ranges of the SmC* phase. steepest descents and conjugated gradients for 1000 steps.
The molecular dynamics was performed under a canon- These temperature ranges were wider than that of FLC monomer MDn12Bs [10]. It is important to note that ical (NVT) ensemble by the Nose´ thermal coupling
method [12, 13]. The Dreiding II force field was used the temperature range of the SmC* phase was more
than 100°C for PS312Bs15. A flexible polysiloxane back-for the energy calculation [14]. Molecular dynamics
were run at 333 K for 1×10⁵ ps; ten cycles of molecular bone enhances the decoupling of the motions of the side chain and main chain, which tends to give rise to a dynamics were carried out for each model structure.
better thermal stability of mesophases such as the SmC* phase [15].
2.5. Dielectric properties The temperature range and thermal stability of the
The dielectric spectroscopy was determined by a liquid crystal phase were increased with increasing spacer
Novocontrol GmbH spectrophotometer. Measurements length. The glass transition temperatures (T
g) of these were performed on a Schlimberger SI 1260 impedance/ polymers were observed in DSC thermograms; it decreased gain-phase analyser (frequency 10−1 to 106 Hz) with a with increasing spacer repeat units due to the plasticizer Quatro temperature controller. The measurement system effect. The temperature range of Ch phases increased was fully computer controlled. A nitrogen gas heating with decreasing spacer length. A shorter spacer increased system ranging from −100 to 215°C was used; tem- the molecular interaction of side chain mesogenic groups, peratures were adjusted within a tolerance of±0.05°C. and hindering the lateral packing of the SmC* phase.
FLCP samples were sandwiched between two parallel XRD measurements and POM were used to verify
metal electrode plates with a spacer of 50mm. the assignment of the mesophase for these polymers. For
PS112Bs15, the POM micrograph reveals a focal-conic texture at 96°C (figure 1). Figure 2 presents temperature-3. Results and discussion
dependent XRD diagrams obtained from a powder 3.1. Synthesis
sample of PS112Bs15 at 35, 55, 70, 95, 110 and 130°C. Chemical structures of the compounds were identified
Upon further cooling from the cholesteric phase, two
by 1H NMR spectra. In one example of PS312Bs15,
sharp reflections at low angle and two broad reflections chemical shift appearing at 4.02 ppm could be associated
at wide angle were assigned as the lateral packing and the with the KCHBrK proton of the chiral centre. On the
smectic layer, respectively. This indicates the microscopic other hand, the Si–H peak at 4.7 ppm and vinyl protons
of the CH
2LCHK group, appearing between 5.23 and 5.90 ppm, vanished after reaction. This confirms the complete reaction between FLC monomers and Si–H groups.
3.2. T hermal properties
Phase sequences and corresponding transition tempera-tures for the FLCPs are shown in table 1. All the FLCPs exhibit a chiral smectic C phase except for the homo-polymers PS112Bs100, PS212Bs100, and PS312Bs100. PS112Bsx (x=15, 35, 55) show enantiotropic cholesteric (Ch), chiral smectic C (SmC*), and high order smectic (SmX) phases, while PS312Cs100, PS312Fs100, PS312Bs55, and PS212Bsx (x=15, 35, 55) exhibit enantiotropic Ch, and SmC* phases. It is important to note that PS312Bs15 and PS312Bs35 copolymers exhibit only the
SmC* phase. Homopolymers PS112Bs100, PS212Bs100, Figure 1. Optical polarizing micrograph of PS112Bs15
revealing SmC* phase at 96°C (800×).
and PS312Bs100 show only the Ch phase.
Table 1. Phase transition temperatures for the FLCPs.
Phase transitions temperatures/°Cb Sample na xa Za Heating
Cooling (corresponding enthalpy changes/kJ kg−1)
PS312Fs100 3 100 F g 28.6 SmC* 143 (−)c Ch 163 (−)c I I 153.34 (−)c Ch 137.4 (−)c SmC* 32.4 g PS312Cs100 3 100 Cl g 17 SmC* 131.9 (−)c Ch 149.8 (−)c I I 145.5 (−)c Ch 128.1 (−)c SmC* 12 g PS112Bs15 1 15 Br g 10.8 SmX 26.6 (1.6) SmC* 104.3 (1.7) Ch 133.3 (0.8) I I 131.5 (0.9) Ch 100.7 (1.3) SmC* 21.6(0.9) SmX 0.5 g PS112Bs35 1 35 Br g 12.2 SmX 30.2 (−)c SmC* 101.3 (0.9) Ch 131.6 (0.4) I I 128.6 (0.6) Ch 96.9 (0.6) SmC* 26.2 (−)c SmX 1.9 g PS112Bs55 1 55 Br g 15.8 SmX 35.8 (0.5) SmC* 100.3 (1.9) Ch 129.3 (0.3) I I 127.0 (0.4) Ch 95.3 (1.3) SmC* 30.4 (0.4) SmX 11.8 g PS112Bs100 1 100 Br g 16.5 Ch 133.5 (−)c I I 127.2 (−)c Ch 12.9 g PS212Bs15 2 15 Br g−15.2 SmC* 89.3 (1.7) Ch 113.7 (0.8) I I 106.2 (0.7) Ch 79.0 (1.6) SmC*−18.4 g PS212Bs35 2 35 Br g−13.3 SmC* 74.1 (−)c Ch 86.6 (−)c I I 82.1 (0.3) Ch 66.4 (0.1) SmC*−16.8 g PS212Bs55 2 55 Br g−12.5 SmC* 68.7 (1.2) Ch 81.2 (0.4) I I 79.4 (0.4) Ch 64.2 (4.6) SmC*−16.4 g PS212Bs100 2 100 Br g−8.3 Ch 102.7 (−)c I I 97.5 (−)c Ch −11.1 g PS312Bs15 3 15 Br g−34.6 SmC* 85.1 (1.2) I I 83.8 (1.1) SmC*−40 g PS312Bs35 3 35 Br g−20.4 SmC* 83.3 (1.5) I I 82.3 (2.3) SmC*−26.0 g PS312Bs55 3 55 Br g−18.2 SmC* 54.7 (1.0) Ch 62.7 (−)c I I 58.5 (−)c Ch 52.3 (−)c SmC* −21.8 g PS312Bs100 3 100 Br d I 105.4 (0.6) Ch 7.4 (0.7) a n, x, Z according to the scheme.
b I=isotropic phase; Ch=cholesteric phase; SmC*=chiral smectic C phase; SmX=unidentified smectic phase; g=glassy state. c Enthalpies were too small to be evaluated.
d No liquid crystalline phase was observed.
phase separated between the polymer backbone and the a tilted SmC* phase is confirmed. On the other hand, the d-spacing increases with increasing spacer length. LC domain [16]. Curve B exhibits a diffuse reflection
at 4.95 A˚ and a very weak reflection at 39.49 A˚, which This is due to the increase of molecular length of the side chain group.
correspond to the smectic layers. Moreover, the
d-spacing of the first order reflection falls from 39.49 Similar phase behaviour was found in the PSn12Bs35 and PSn12Bs55 series (n=1, 2 or 3). All of the FLCPs to 35.73 A˚ (curve B to curve E) as the temperature of
measurement decreases from 110 to 55°C. The tempera- exhibit the SmC* phase. The SmC* phase temperature range and thermal stability are increased with increasing ture dependence of the layer spacing for PSn12Bs15 is
presented in figure 3 (a); the d-spacing decreases as the spacer length due to increasing flexibility of the side chain group; temperature-dependent d-spacings are temperature decreases. Judging from the results of POM
micrographs and XRD measurements, the formation of presented in figure 3 (b) and 3 (c).
75 FL C polymers with halogen terminal groups
Figure 2. X-ray diffraction measurements for PS112Bs15.
3.4. EVect of grafted contents and chiral centres As an example, PS312Bsx is used to describe the effect of grafted content on thermal properties. T
g increases with increasing grafted content (from−40 to 7.4°C) due to the increase in rotation hindrance by the side chain mesogenic group. The PS312Bs15, PS312Bs35, and PS312Bs55 samples exhibit wide SmC* temperature ranges, including room temperature. Yet PS312Bs100 shows only the cholesteric phase. The SmC* temperature range narrows (from 123.8 to 74.2°C) as the grafted content increases. This suggests that the decrease of the mesogenic group content raises the thermal stability of the SmC* phase. In addition, the phase transition temperatures of copolymers are lower than those of homopolymers because of the dilution of mesogenic groups on the polymer backbones [17].
As mentioned above, halogen(F, Cl and Br)-containing FLCP homopolymers were previously reported by us [10]. The fluorine- and chlorine-containing homopolymers show the SmC* mesophase. However, the bromine-containing PSn12Bs100 (n=1, 2, or 3) homopolymers show no smectic mesophase. Furthermore, the FLC monomer MDn12Bs (n=1, 2 or 3) exhibits a wide tem-perature range (about 80°C) SmC* mesophase. Based on the above, the use of polysiloxane as the polymer backone for FLCPs would normally increase thermal stability and widen mesomorphic temperature range. However, there is an exception; as shown previously, the bromine-containing polysiloxane homopolymer shows
no SmC* phase. This is possibly because the bulky Figure 3. Layer spacing as a function of temperature in the chiral centre disturbs lateral packing of the mesogenic SmC* phase of samples (a) PSn12Bs15, (b) PSn15Bs35
and (c) PSn12Bs55.
group and hence lowers the thermal stability of a chiral
smectic phase under the constraint of polymer chains. The size of molecules containing F, Cl and Br are shown in table 2 [18].
3.5. Molecular simulation
Following the preliminary studies of thermal properties/ molecular structure relationships, molecular simulation was performed on the equilibrated structures of the FLCPs. In this section, two extreme models of PS112Bs100 and PS112Bs15, with the respective highest and lowest molecular interactions, are discussed.
Modelling of PS112Bs100 and PS112Bs15 was carried out via single-macromolecule species in vacuum, to investigate the relaxed configuration of the FLCPs. Initially, minimization cycles using steepest descents and conjugated gradients for 1000 steps were performed. The lowest energy configurations are shown in figure 4; a fan-shaped structure for PS112Bs100 was found. This is due to the repulsive force between side chain mesogenic groups. Moreover, PS112Bs15 exhibits a fully extended smectic structure.
The molecular dynamics was run under a canonical (NVT) ensemble by the Nose´ thermal coupling method at 333 K for 1×10⁵ ps; ten cycles of molecular dynamics were carried out on each model structure. Figure 5 shows the equilibrated structures of PS112Bs100 and PS112Bs15. PS112Bs100 presents a helical configuration corresponding to the cholesteric phase, whereas PS112Bs15 still exhibits the smectic phase as mentioned in the dis-cussion of thermal properties. This further corroborates results described in the previous section.
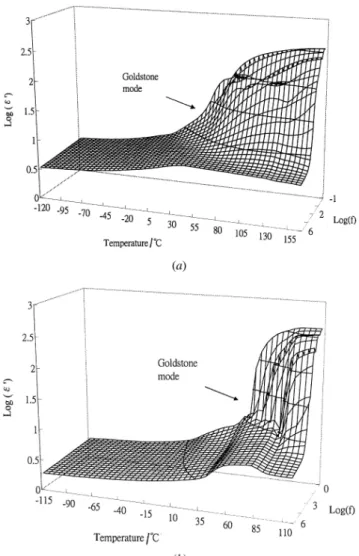
3.6. Dielectric properties of PS312Fs100, PS312Cs100, and PS312Bs100
Dielectric constant e∞ versus temperature and fre-quency for PS312Fs100 is shown in figure 6 (a). For both PS312Fs100 and PS312Cs100, the dielectric constant increases with increasing temperature in the SmC* phase due to the presence of the Goldstone mode. With the electro-induced phase transition effect, the Goldstone mode was also observed for PS312Bs100 in the Ch
phase, figure 6 (b). The Goldstone mode results from Figure 4. Lowest energy configurations of (a) PS112Bs15 and
the large fluctuation of the spontaneous polarization (b) PS112Bs100.
director of the tilt vector at constant tilt angle under an alternating electric field [19–21]. With the decreasing
viscosity and increasing fluctuation, the dielectric con-stant increases. Moreover, as the temperature increased,
Table 2. Molecular sizes of FLCPs containing F, Cl and Br.
the molecular tilt angle decreased in the SmC* phase; this is because the rotational freedom increased
some-Substitution Size/A˚
what on decreasing the steric hindrance. In addition, the
F 1.47 dielectric constant increased with increasing temperature
Cl 1.75
at low frequency ( below 1 kHz) due to the large
fluc-Br 1.85
tuation of the Goldstone mode. This Goldstone mode
77 FL C polymers with halogen terminal groups
Figure 6. Dielectric constant e∞ versus temperature and frequency for (a) PS312Fs100 and (b) PS312Bs100.
intensity and frequency of the Goldstone mode is import-ant in the electro-optical application of the FLCPs [7–10]. A bulky terminal group loosens the dense packing and increases the mobility of the tilted smectic phase under alternative electric fields for PS312Bs100.
Dielectric loss e◊ as a function of temperature and
Figure 5. Equilibrated structures of (a) PS112Bs15 and (b)
PS112Bs100 at 333 K. frequency for PS312Fs100 and PS312Bs100 is shown in
figures 7 (a) and 7 (b), respectively. At a higher tempera-ture range, the presence of the Goldstone mode in all the samples leads to an increase of the dielectric loss. requires a longer relaxation time for FLCPs. Above the
SmC*–Ch phase transition temperature, the dielectric Molecular relaxations of the PS312Fs100, PS312Cs100, and PS312Bs100 samples were also observed (see constant increased as the temperature increased, at low
frequency ( below 1 Hz), due to the ionic conductivity table 3). Thea-relaxation was associated with the glass transition T
g. This process is attributed to molecular effect of the samples. The relaxation intensity of the
Goldstone mode was increased and shifted to a higher motion involving the polymer main chain and side chain group. Thea-relaxation was shifted to a higher tempera-frequency range, due to a loosening of the dense packing
of the highly tilted smectic phase, and increasing mobility ture with increasing frequency; it was absorbed by the Goldstone mode as the temperature further increased. of the side chain groups. The increase of the relaxation
which corresponds to the reorientation of the spacer group of the FLCPs, was observed. In general, ad-relaxation is present at temperatures higher than for thea-relaxation; this corresponds to the rotation of side chain groups around the polymer backbone. However, nod-relaxation was observed in these polymers due to the overlapping of the Goldstone mode.
Analysis of the dielectric behaviour of the FLCPs by a Cole–Cole plot (e∞ versus e◊) provides valuable information about the dielectric relaxation process. The Cole–Cole plot of the c-relaxation at various tempera-tures for PS312Fs100 is shown in figure 8. The relaxation strength increased with increasing temperatures. In addition, the centre of the circle was shifted to largere∞ values at higher temperatures. However, no Cole–Cole plot could be obtained forb- and d-relaxations because theb-relaxation was too weak, and the d-relaxation was overlapped by Goldstone mode. The shape of the Cole–Cole plot can be analysed using the Havriliak– Negami relationship, equation (1):
e(v)=e∞−ie◊=e
2+ De
(1+ivt)a∞,b∞ (1)
wheree
2is the value ofe∞ at infinite frequency. De is the difference between e∞ at the 0 Hz and at infinite frequency; v, t, a∞, and b∞ are frequency, relaxation time, width parameter, and asymmetry parameter, respectively.
From the curve of the Cole–Cole plot, the dielectric relaxation intensity De at various temperatures was obtained. Figure 9 shows thec-relaxation intensity as a function of temperature, indicating that the relaxation intensity increased with decreasing molecular size of the
Figure 7. Dielectric losse◊ versus temperature and frequency chiral centre. A decrease in the size of the chiral centre for (a) PS312Fs100 and (b) PS312Bs100. favours a better reorientation of the molecular segments
toward an alternating electric field. The relaxation
Table 3. Activation energies ( kJ mol−1) of the molecular relaxations for PS312Fs100, Ps312Cs100 and PS312Bs100.
Relaxation
Sample a b c
PS312Fs100 219.56a–363.06b —c 37.74 PS312Cs100 —c —c 38.02 PS312Bs100 292.24a–369.36b —c 38.17
a The data were calculated at 103 Hz. b The data were calculated at 105 Hz.
c The relaxations were too weak or overlap with another relaxation.
The b-relaxation usually corresponds to the reorienta-tion of the mesogenic group of the FLCPs. Due to the highly rigid mesogenic group and overlapping of the
c-relaxation at lower temperatures, no b-relaxation was Figure 8. Cole–Cole plot of the c-relaxation at various temperatures for PS312Fs100.
found for FLCPs. In these polymers, the c-relaxation,
79 FL C polymers with halogen terminal groups
clearing and phase transition temperatures; the SmC* phase range narrows as the grafted content increases.
The dielectric properties of a series of FLCPs with different halogenated chiral centres were investigated in this work. The collective and molecular relaxation of these FLCPs were also observed. The dielectric constant was markedly enhanced because of the occurrence of the Goldstone mode in the SmC* phase. The Goldstone mode appears in the Ch phase for homopolymers PSn12Bs (n=1, 2 and 3) due to the electro-induced phase tran-sition effect. For PS312Bs, bulky terminal groups loosen the dense packing and increase the mobility of the tilted smectic phase under an alternating electron field. Furthermore, a decrease in the size of the chiral centre results in an increase in the relaxation intensity and decreased activation energy.
The authors thank the National Science Council of the Republic of China for financial support for this work
Figure 9. c-Relaxation intensity as a function of temperature
for PS312Fs100, PS312Cs100 and PS312Bs100. (NSC89-2216-E-007-049-).
References
intensity also decreases with increasing temperature; this [1] C, N. A., and L, S. T., 1980, Appl. Phys. is because the higher thermal energy results in the mobility L ett., 36, 899.
of the dipoles toward the alternating electric field. [2] Z, R., R, G., and R, B., 1987, L iq. Cryst., 2, 83.
Except for thea-relaxation, the relaxation activation
[3] P, D. S., C, N. A., K, P.,
energies are obtained using the Arrhenius equation. The
W, D. M., and W, M. D., 1990, J. Phys. Paris.,
a-relaxation frequency ranged from 103 to 105 Hz. A 51, 355.
non-linear curve of the a-relaxation can be fitted with [4] D, M., N, H. T., M, M.,
the Williams–Landel–Ferry (WLF) equation [22], indi- D, C., and G, H., 1991 L iq. Cryst., 10, 475.
cating that it can be identified as the glass transition
[5] N, K., N, H., and A, M., 1990,
[ 23 ]. The activation energies of the relaxations are
J. appl. Phys., 67, 996.
summarized in table 3. Activation energy indicates the
[6] Y, K., U, S., S, T., H, K., and
presence of molecular interaction; a chiral centre with a K, K., 1991 Ferroelectrics, 122, 53.
smaller molecular size would lower the activation energy [7] H, G. H., L, R. H., and H, J. C., 1996, Polymer, 37, 1095.
of the molecular motions contributing to the a- and
[8] H, G. H., L, R. H., J, R. J., and C, C. S.,
c-relaxations, and thus favours a better reorientation of
1996, J. Polym. Sci. B, 34, 555.
the molecular segments toward the alternating electric
[9] H, G. H., L, R. H., and J, R. J., 1997, Polymer,
field. 38, 887.
[10] Z, R., S, G. R., and R, H., 1985,
4. Conclusion Macromolecules, 18, 960.
[11] H, G. H., S, Y. A., H, S. R., J, R. J., and
In this work, a new series of ferroelectric liquid crystal
K, W. J., 2001, L iq. Cryst., 28, 365.
polymers containing chiral centres attached to halogens,
[12] N, S., 1984, J. chem. Phys., 81, 511.
oligooxyethylene spacers, and a three-ring aromatic ester [13] N, S., 1984, Mol. Phys., 52, 255.
core unit have been developed. Except for the homo- [14] M, S. L., O, B. D., and G, W. A., polymers, all of the copolymers exhibit the SmC* phase. 1990, J. phys. Chem., 94, 8897.
[15] H, G. H., and C, J. H., 1995, Macromolecules,
This is because the bulky substituent on the chiral centre
28, 4366.
disturbs the orientation of the side chain liquid crystal
[16] H, G. H., S, Y. A., and J, R. J., 2001,
homopolymer. The dilution of mesogenic groups in an
Macromol. Chem. Phys., 202, 287.
FLC copolymer results in wide temperature range of [17] H, F., S, G., K, P., R, H.,
SmC* phases (about 120°C). An increase in the number N, H. T., M, M., and A, M. F.,
1989, L iq. Cryst., 5, 463.
of oxyethylene spacer units favours the decrease of
[18] C, P. J., and H, M., 1997, Introduction to [21] V, S. U., K, F., S, G., S, A., K, K., and F, E. W., 1990, L iquid Crystals (London: Taylor & Francis), p. 71.
[19] V, S. U., K, F., K, H., Z, R., L iq. Cryst., 8, 719.
[22] S, L. H., 1992, Introduction to Physical Polymer andF, E. W., 1991, Ferroelectrics, 113, 231.
[20] V, S. U., Z, R., K, F., K, H., Science (Singapore: John Wiley), p. 337.
[23] M, E., L, F., B, R. H., H, A., and andF, E. W., 1989, Makromol. Chem. rapid Commun.,
10, 333. G, U. W., 1994, Polym. Bull., 32, 679.