Article
Femtosecond Dynamics on 2(2 Hydroxy4
-diethylaminophenyl)benzothiazole: Solvent Polarity in the
Excited-State Proton Transfer
Yi-Ming Cheng, Dr., Shih-Chieh Pu, Chia-Jung Hsu, Chin-Hung Lai, Dr., Pi-Tai Chou, Prof. *
Department of Chemistry National Taiwan University, Taipei Taiwan 10617, Taiwan, Fax: (+88) 62-2369-5208
email: Pi-Tai Chou ([email protected])
*
Correspondence to Pi-Tai Chou, Department of Chemistry National Taiwan
University, Taipei Taiwan 10617, Taiwan, Fax: (+88) 62-2369-5208
KEYWORDScharge transfer ?proton transfer ?solvatochromism ?solvent relaxation ?tautomerism
ABSTRACT
Detailed insights into the excited-state enol(N*)-keto(T*) intramolecular proton transfer (ESIPT) reaction in 2-(2 -hydroxy-4 -diethylaminophenyl)benzothiazole (HABT) have been investigated via steady-state and femtosecond fluorescence upconversion approaches. In cyclohexane, in contrast to the ultrafast rate of ESIPT for the parent 2(2
-hydroxyphenyl)benzothiazole (>2.9?.3?013 s-1), HABT undergoes a relatively slow rate (
5.4?.5?011 s-1) of ESIPT. In polar aprotic solvents competitive rate of proton transfer and rate
of solvent relaxation were resolved in the early dynamics. After reaching the solvation equilibrium in the normal excited state (Neq*), ESIPT takes place with an appreciable barrier.
The results also show Neq*(enol) Teq*(keto) equilibrium, which shifts toward Neq* as the
solvent polarity increases. Temperature-dependent relaxation dynamics further resolved a solvent-induced barrier of 2.12 kcal mol-1 for the forward reaction in CH
2Cl2. The observed
spectroscopy and dynamics are rationalized by a significant difference in dipole moment between Neq* and Teq*, while the dipolar vector for the enol form in the ground state (N) is in
between that of Neq* and Teq*. Upon N N* Franck-Condon excitation, ESIPT is energetically
favorable, and its rate is competitive with the solvation relaxation process. Upon reaching equilibrium configurations Neq* and Teq*, forward and/or backward ESIPT takes place with an
appreciable solvent polarity induced barrier due to differences in polarization equilibrium between Neq* and Teq*.
Received: 9 January 2006
10.1002/cphc.200600017 About DOI
ARTICLE TEXT
1. Introduction
The proton transfer reaction is ubiquitous in numerous chemical reactions as well as in living systems. [1], [2] Among the ample number of relevant studies, the excited-state intramolecular proton transfer (ESIPT) has received considerable attention.[3] Numerous ESIPT molecules have been explored and investigated to shed light on their corresponding fundamental and applications. Most ESIPT molecules possess a strong intramolecular hydrogen bond (HB) between O H (or N H) and C O (or pyridinic nitrogen) groups, in which the intrinsic proton transfer in the 1 * state[4] is essentially
barrierless in nonpolar solvents[5] and may proceed either during the periods of low frequency, large-amplitude vibrational motions associated with the hydrogen bond,[6] or coherently, as proposed by Elsaesser,[7] Lochbrumer,[8] and more recently by Tahara and co-workers.[9]
Recently, another research direction regarding solvent induced ESIPT has also made significant progress.[10]-[13] Considering the possibly large differences in the dipolar vector between excited normal ( N*) and tautomer ( T*) species, the normal and tautomer equilibrium polarizations should be
far separated. Since the dipolar change in solute (i.e. the ESIPT molecules) is often coupled to solvent polarization effects, the relative energetics between normal and proton-transfer tautomer is expected to be a function of solvent polarization coordinate. Thus, the long-range polarization interactions may result in a solvent induced barrier channeling into the proton transfer reaction. In this regard, several relevant examples have recently been explored via anchoring the ESIPT molecules with a strong electron-donating substituent such as dialkylamines, so that upon Franck-Condon excitation, excited-state intramolecular charge transfer (ESICT) may take place. The net effect may introduce significant solvation perturbation, which may accordingly fine-tune the dynamics of the ESIPT. To probe this fundamental issue, studies of the ESIPT reaction in N,N-dialkyllamino-3-hydroxyflavones,[14]-[18]
7-N,N-diethylamino-3-hydroxyflavone[19] and 2-hydroxy-4-(di-p-tolyl-amino)benzaldehyde[20] have recently been carried out with femtosecond techniques to investigate the dynamics of the ESIPT reactions. For the cases of N,N-dialkyllamino-3-hydroxyflavones and
7-N,N-Diethylamino-3-hydroxyflavone, it has been concluded that equilibrated ground-state normal (Neq) and excited
proton-transfer tautomer (T*) species possess a similar dipole moment (in terms of magnitude and orientation), whereas due to the excited-state charge-transfer property, the equilibrated normal excited state (Neq*)
possesses a significantly different dipole moment with respect to that of Neq. The ESIPT is thus
solvation relaxation process. After reaching the solvent equilibration, due to the difference in equilibrium polarization between Neq* and Teq*, Neq* Teq* ESIPT is associated with an appreciable solvent induced
barrier. Thus, despite the simple intramolecular type of reaction, the results have drawn attention because solvent polarity must play a crucial role in manipulating the dynamics of the ESIPT.
As a continuous effort, it is of fundamental importance to examine whether the mechanism can be generalized and extended to other ESIPT systems. In this regard, the ESIPT molecule 2(2 hydroxy4 -diethylaminophenyl)benzothiazole (HABT) has attracted our attention. HABT has been studied with steady-state and sub-nanosecond time-resolved approaches.[21] Instead of a unique proton transfer emission resulting from ultrafast ESIPT (>1?013 s-1) in its parent molecule 2(2
-hydroxyphenyl)benzothiazole (HBT, see Scheme 1),[8], [22] the observation of dual emission for HABT in nonpolar solvent such as cyclohexane, in combination with the ratiometric change of the dual emission as a function of temperature, leads to the extraction of an ESIPT barrier of, for example, 1 kcal mol-1 in CH
2Cl2.[21a] Two possible ESIPT mechanisms have been proposed, in which one
incorporates state mixing between OH and N(C2H5)2 charge-transfer states, reducing the -OH
acidity and hence retarding the proton transfer process. An alternative mechanism lies in that a fast proton tunneling may take place between normal (enol form) and proton-transfer tautomer (keto form, see Scheme 1
), which are in equilibrium in the excited state. Unfortunately, due to a
lack of temporal resolution, further deduction of ESIPT dynamics is impossible.
Herein, femtosecond fluorescence upconversion was carried out, the results of which,
in combination with the steady-state and theoretical approaches, shed light on the
relaxation dynamics in HABT in various solvents, especially the role of solvent
polarity and solvent relaxation played in the ESIPT reaction. The following sections
are organized according to a sequence of steps in which we first performed
steady-state experiments to elaborate the ESICT and ESICT/ESIPT properties for MABT and
HABT, respectively. Subsequently, femtosecond dynamics were investigated and
discussed on the basis of the solvent polarity coupled ESIPT reaction, the results of
which, in combination with theoretical approaches, lead us to propose a rational
proton transfer mechanism.
Scheme 1. A) The structures of the various compounds presented in this study and B) the structures of enol and keto forms of HABT in the proton transfer tautomerism.
[Normal View 9K | Magnified View 17K]
Figures 1 and 2 depict the steady-state absorption and emission spectra of MABT and HABT in various solvents. In cyclohexane, the S0 S1 absorption band of MABT, maximized at 364 nm with an
extinction coefficient of 4.3?.4?04 M-1 cm-1, suggests a characteristic * transition. The room
temperature luminescence of MABT in cyclohexane is characterized by a normal Stokes-shifted structured emission band with a 0-0 vibronic peak wavelength at 375 nm and a high quantum yield of 0.85 ( f). Since MABT lacks hydroxyl proton to execute ESIPT, the assignment of 375 nm emission to
the enol form is unambiguous. In comparison to MABT, the 16 nm red shift of the S0 S1 peak
wavelength in HABT manifests the formation of a strong intramolecular hydrogen bond, the
consequence of which elongates the electron conjugation. In contrast to a unique enol emission in MABT, dual emission maximized at 391 and 520 nm was observed for HABT in cyclohexane. The 391 nm with a similar vibronic feature as that of MABT can clearly be assigned to the fluorescence of the enol tautomer (N*) (see Scheme 2), while the 520 nm band is absent in MABT and is accordingly ascribed to the keto emission resulting from ESIPT. Note that in contrast to f of 0.85 for MABT, both
enol and keto emissions are weak in HABT, as indicated by the apparent quantum yield of 6?0-3
upon summing the dual emission intensity in cyclohexane.
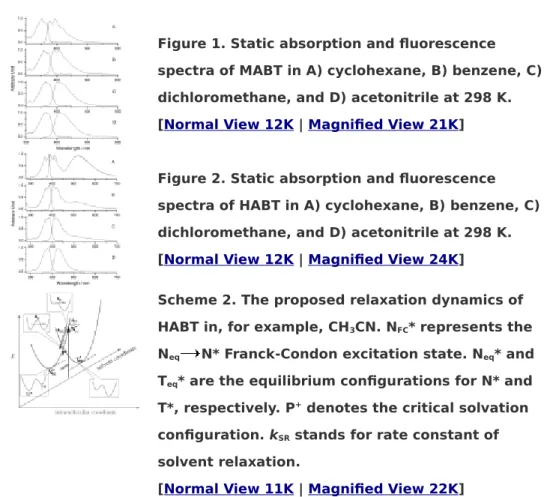
Figure 1. Static absorption and fluorescence spectra of MABT in A) cyclohexane, B) benzene, C) dichloromethane, and D) acetonitrile at 298 K.
[Normal View 12K | Magnified View 21K]
Figure 2. Static absorption and fluorescence spectra of HABT in A) cyclohexane, B) benzene, C) dichloromethane, and D) acetonitrile at 298 K.
[Normal View 12K | Magnified View 24K]
Scheme 2. The proposed relaxation dynamics of HABT in, for example, CH3CN. NFC* represents the
Neq N* Franck-Condon excitation state. Neq* and
Teq* are the equilibrium configurations for N* and
T*, respectively. P+ denotes the critical solvation
configuration. kSR stands for rate constant of
solvent relaxation.
[Normal View 11K | Magnified View 22K]
As shown in Figure 2, similar dual emission was observed for HABT in other solvents. However, as the solvent polarity increases, the intensity ratio for the keto versus enol emission intensity decreases, becoming obscure in acetonitrile. While the peak wavelength of the keto emission remains unchanged, the enol emission of HABT reveals appreciable solvent-polarity dependence, being shifted from 390 nm
in cyclohexane to 430 nm in CH3CN. Note that a similar solvent-polarity dependent emission peak
was also observed for MABT (see Figure 1). In view of the low ionization potential of the diethylamino group, the occurrence of ESICT in both MABT and HABT is expected. In the solvent polarity dependent study, the hydrogen-bonding perturbation in solvents such as CH2Cl2 or CH3CN may not be negligible.
[3j] To examine such a possibility, a detailed inspection on the excitation spectrum monitored throughout the entire emission of HABT was performed. The lack of the absorption ascribed to the deprotonated HABT in CH2Cl2 or CH3CN leads us to conclude that the H-bonding in these solvents plays a negligible
role to the results of HABT. In comparison to HBT, the addition of diethylamino substituent, forming HABT, greatly enhances the basicity of the nitrogen atom at the benzothiazol moiety and hence strengthens the intramolecular hydrogen bond, minimizing the possible solvent hydrogen bonding perturbation. The solvent-polarity-dependent emission property can be expressed quantitatively according to the theory derived from dielectric polarization, specifying that the spectral shifts of the fluorescence upon increasing the solvent polarity depend on the difference in permanent dipole moments between ground ( ) and excited ( ) states. The changes of dipole moment in magnitude between ground and excited states, that is, = , can thus be estimated by the Lippert equation expressed as Equation (1):[23]
(1) where a0 and denote the cavity radius and solvent dielectric constant, respectively. The plot of (peak
frequency of the enol emission) versus is sufficiently linear (Figure 3), and a slope of 8.12?.8?
03 cm-1 and 6.95?.7?03 cm-1 is calculated for MABT and HABT, respectively. For both MABT and HABT,
a0 was estimated to be 5.9 Å via the Hartree-Fock theories with 6-31G(d ,p ) basis sets. Accordingly,
was deduced to be 12.87 and 11.91 D for MABT and HABT, respectively,
supporting the proposed charge-transfer properties in the enol species.
Figure 3. The plot of fluorescence maximum frequencies for MABT (solid) and HABT (open) as a function of solvent polarity parameter f( ); f( )= ; cyclohexane: 0.2, tetrahydrofuran: 0.406, dichloromethane: 0.421, and acetonitrile: 0.48.
[Normal View 8K | Magnified View 14K]
Relaxation Dynamics of MABT
In nonpolar solvent such as cyclohexane, the time-resolved fluorescence of MABT is straightforward. It was established by a response-limited (<150 fs) rise and a single exponential population decay component of f 1.3 ns (see Table 1) at any monitored wavelengths of the emission band. In polar
solvents such as CH2Cl2 and CH3CN, similar trends were observed (see Figure 4 for CH2Cl2), in which
the emission dynamics were non-singly exponential. Detailed fitting parameters for both early-time relaxation dynamics and population decay rate at selected wavelengths are listed in Table 1. The
relaxation dynamics, upon monitoring at a shorter wavelength of for example, 410 nm, consists of a fast decay of 1.12?.11 ps and a rather long population decay component that can be treated as a constant value within the fitted range of <20 ps. The population decay component, measured by a single photon counting technique, was resolved to be 1.54 and 1.57 ns in CH2Cl2 and CH3CN, respectively. Note that
the population decay measured by the fluorescence upconversion technique seems to be 1 ns according to Figure 4, indicating that certain photo-decomposition takes places in MABT. This viewpoint was also supported by the observation of a decrease of 380 nm peak absorption during the
fluorescence upconversion experiments. Upon increasing the monitored wavelength, while the population decay remains unchanged, the rise time of the early (fast) components gradually increases. In this region, the best fitted time constants for the fast rise components also vary by the probed emission wavelengths. Upon monitoring at the tail of the emission of, for example, 490 nm, the relaxation dynamics consist of a fast, but resolvable, rise component of 1.03?.10 ps, which correlates well with the 1.12?.11 ps decay monitored at 410 nm. The results can be well explained by the
occurrence of charge transfer in MABT, resulting in an instant dipolar change in the excited state. In the small molecule such as MABT the coupling between locally excited and charge-transfer states must be fairly strong. Thus, under the absence of a reaction barrier, that is, a reaction ascribed to the optical electron transfer,[24
] common adiabatic solvation energetics takes place and the early
(e.g. <10 ps) relaxation dynamics are mainly governed by the solvent relaxation
process.
Table 1. The photophysical properties of HABT and MABT in various solvents.
Solvent Emission
[a]
Early dynamics[b] Population
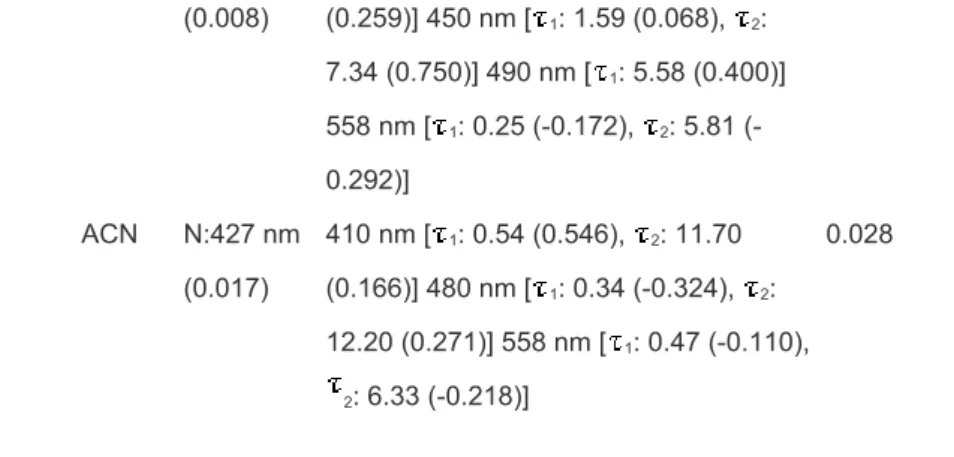
decay[c] MABT CHE N:375 nm (0.85) N/A 1.30 DCM N:405 nm (0.93) 410 nm [ 1:1.12 (0.13)] 450 nm [ 1: 0.7 (-0.202)] 490 nm [ 1: 1.03 (-0.244)] 1.54 ACN N:412 nm (0.83) 410 nm [ 1: 1.12(0.04)] 500 nm [ 1: 0.38 (-0.247)] 1.57 HABT CHE N:391 nm (0.006) 410 nm [ 1: 0.08(0.971), 2: 1.91 (0.028)] 480 nm [ 1: 2.02 (0.724)] 558 nm [ 1: 0.22 (-0.083), 2: 2.06 (-0.406)] 612 nm [ 1: 0.15 (-0.018), 2: 1.67 (-0.460)] 0.045 DCM N:412 nm 410 nm [ 1: 0.59 (0.670), 2: 7.68 0.033
(0.008) (0.259)] 450 nm [ 1: 1.59 (0.068), 2: 7.34 (0.750)] 490 nm [ 1: 5.58 (0.400)] 558 nm [ 1: 0.25 (-0.172), 2: 5.81 (-0.292)] ACN N:427 nm (0.017) 410 nm [ 1: 0.54 (0.546), 2: 11.70 (0.166)] 480 nm [ 1: 0.34 (-0.324), 2: 12.20 (0.271)] 558 nm [ 1: 0.47 (-0.110), 2: 6.33 (-0.218)] 0.028
[a] N: normal (enol) or charge transfer state emission maxima, T: tautomer (keto) state emission maxima. [b] Unit: ps. Data listed in the early dynamics are the rise (negative pre-exponential factor) and short decay components. The much longer population decay components are not shown in this column. Data in () are the fitted pre-exponential factor. The error is about 10 %. [c] Unit: ns.
Figure 4. Time-resolved sum frequency signal of fluorescence and gate pulse (750 nm) for MABT in dichloromethane. The solid lines express the corresponding best-fitted curves.
[Normal View 23K | Magnified View 46K]
Relaxation Dynamics of HABT
Due to an additional ESIPT channel, the relaxation dynamics of HABT, in comparison to MABT, are relatively complicated. In cyclohexane, the temporal resolution of HABT at the very blue side, for example, 410 nm ascribed to the enol emission, consists of a response limited (<130 fs) rise component, a fast but resolvable decay of 1.91?.19 ps, and a very small but non-negligible long population decay component (see Table 1). The 1.91 ps decay component eventually disappears when the emission wavelength is monitored at for example, 612 nm. Instead, a finite rise component of 1.67?.17 ps was resolved, followed by a population decay component (see Figure 5). The population decay components are independent of the monitored emission wavelength and were resolved to be 45 ps via a picosecond time-correlated single photon counting method. The rise (1.67?.17 ps) of the keto tautomer emission, within experimental error, correlates well with the fast decay (1.91?.19 ps) dynamics of the enol tautomer, suggesting a precursor-successor type of relationship between enol and keto tautomers emission. Since quantum yield (0.85) and lifetime (1.3 ns) in MABT drastically decrease to <6?0-3 and 1.91?.19 ps in HABT, the fact that the radiationless decay for HABT is dominated by the
rate of the ESIPT of 5.4?.5?011 s-1 (taking the average of decay (1.91 ps) and rise (1.67 ps)
CH3CN, respectively, while detailed fitting parameters of early-time relaxation dynamics and population
decay rates are listed in Table 1. In comparison to that of MABT, remarkable differences in relaxation dynamics were resolved in HABT. First of all, in CH2Cl2, upon monitoring at the short wavelength region
ascribed to the charge-transfer emission, the relaxation dynamics of HABT consist of an ultrafast [component (1), a few hundred fs, depending on the monitored wavelength] and a fast decay [
7.68?.77 ps, component (2)], accompanied by a rather short population decay of 32.6?.3 ps [component (3)]. Components (1) and (2) gradually become the rise components upon increasing the monitored wavelength toward the red edge of the proton transfer keto tautomer emission. Similar results were obtained for the case of HABT in CH3CN, consisting of component (1) [ hundred femtoseconds,
wavelength-dependent rise/decay], component (2) [ 12?.2 ps], decay in the enol form and rise in the keto form and a population decay time [component (3)] of
28?.8 ps throughout the monitored
wavelengths of 410-560 nm. It is also noteworthy that while the quantitative
correlation between decay (at short wavelength) and rise (at long wavelength) for
component (1) is difficult mainly due to their wavelength dependence, the magnitude
of component (2) (either rise or decay) and the population decay (component (3),
within the experimental error, remain unchanged throughout the monitored dual
emission of 410-560 nm.
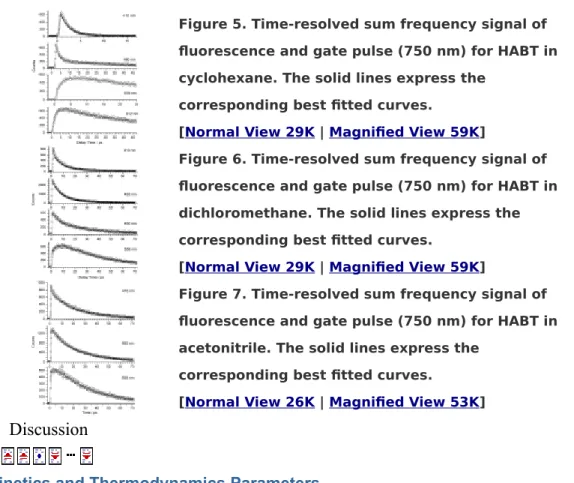
Figure 5. Time-resolved sum frequency signal of fluorescence and gate pulse (750 nm) for HABT in cyclohexane. The solid lines express the
corresponding best fitted curves.
[Normal View 29K | Magnified View 59K]
Figure 6. Time-resolved sum frequency signal of fluorescence and gate pulse (750 nm) for HABT in dichloromethane. The solid lines express the corresponding best fitted curves.
[Normal View 29K | Magnified View 59K]
Figure 7. Time-resolved sum frequency signal of fluorescence and gate pulse (750 nm) for HABT in acetonitrile. The solid lines express the
corresponding best fitted curves.
[Normal View 26K | Magnified View 53K]
3. Discussion
Kinetics and Thermodynamics Parameters
The observation of steady-state dual emission with identical excitation spectra, in combination with similar population decay times throughout the monitoring wavelengths, leads us to propose the eventual
establishment of excited-state equilibrium between enol (N*) and keto (T*) forms in all solvents studied. Neglecting the ultrafast component (1) that, in part, may be associated with internal conversion, solvent relaxation and other reaction pathways, a few hundred femtoseconds after excitation, the ESIPT reaction and its associated relaxation dynamics [Eqs. (2)-(6)] can thus be expressed by a coupling reaction depicted as follows:[10, 25]
[Normal View 2K | Magnified View 3K]
(2) (3) (4) (5) (6) where k+ and k- denote forward and backward rates of proton transfer, and as
shown in Equation (7):
(7) On the basis of Equations (4)-(7), the relationships expressed in Equations (8) and (9) can be established:
(8) (9)
Since and , we can then derive Equation (10):
(10) Note that values of , , and can be obtained experimentally. As a result, and can be deduced from Equations (8) and (9). In most ESIPT cases such as
N,N-dialkyllamino-3-hydroxyflavones[14]-[18] and 2-hydroxy-4-(di-p-tolyl-amino)benzaldehyde[20], where the rate of the
ESIPT reaction is much faster than the radiative and nonradiative deactivation processes, that is, k+
and k- , and can be simplified and assumed to be equivalent to k+ and k-, respectively.
In contrast, the fast value of >1010 s-1 in all solvents studied indicates that the excited-state enol-keto
equilibrium was not well established prior to the relaxation of N*(or T*). Thus, instead of k+ and k- being
deduced individually, the product of k+?I >k- ( ) has to be dealt with
concurrently, the value of which was calculated to be 3.4?.3 ?021 s-2 in CH
3CN. Since it is not feasible to
access k+ and k- exactly, we thus carried out an approximation. Under the boundary condition of
or , both the upper and lower limits of k+ (or k-) can thus be qualitatively estimated. In
CH3CN, k+ and k- were calculated to be in the range of 3.0?010-8.1?010 s-1 and 4.3?010-1.1?011 s-1,
respectively. As a result, we could use both upper and lower limits of k+ and k- to estimate Keq directly
procedure, ranges of , and Keq in other solvents could also be calculated, and the resulting
parameters are summarized in Table 2. The result concludes that the energetic level between Neq* and
Teq* is strongly solvent polarity dependent, and the equilibrium constants (upper limits) were deduced to
be 29.9, 5.3, and 1.88 in C6H12, CH2Cl2, and CH3CN, respectively. In other words, unlike the case in
nonpolar solvents, that is, cyclohexane, in which the excited-state equilibrium strongly favors the keto form (i.e. Teq*), the equilibrium shifts to the enol form (Neq*) for HABT in CH3CN. This, in combination
with dominant radiationless deactivation of Teq*, qualitatively verifies the steady-state measurement, in
which the keto form emission of HABT in CH3
CN is hardly observable.
Table 2. The dynamic parameters of HABT in various solvents.
Solvent k+ [s-1] k- [s-1] Keq
HABT CHE 3.0?011-6.0?0112.0?010-4.0?0107.6-29.9
DCM 8.0?010-1.7?0113.1?010-6.6?0101.2-5.3
ACN 3.0?010-8.1?0104.3?010-1.1?0110.3-1.9
We further performed a temperature dependent study of the proton transfer rate, that is, component (2) based on a ps time-correlated single photon counting experiment. Since the system response is 15 ps, signals contributing to the ultrafast pathway [i.e. component (1)] cannot be resolved. We then monitored at the decay of the enol and rise of the keto components, whose rates, as a function of the temperature in CH2Cl2, are shown in Figure 8. Apparently, throughout the temperature range from 303 to
213 K, the decay component (2) of the enol form (monitored at 410 nm) correlates well with respect to the rise of the keto form (monitored at 550 nm). For either case, the logarithm of the rate constant (ln k) versus the reciprocal of the temperature (1/T) reveals a linear relationship. Accordingly, the slope gives an activation energy of 2.12 kcal mol-1 in CH
2Cl2. Moreover, we also deuterated HABT at the OH
site, forming DABT (see experimental section). As shown in Figure 8, the temperature dependent experiment was also performed for DABT and an activation energy of 2.07 kcal mol-1 was deduced,
whose value, within the experimental error, is identical with the non-deuterated HABT. The lack of the kinetic isotope effect supports the reaction barrier
s origin from solvent reorganization to
achieve a favorable polarization configuration for the ESIPT.
Figure 8. Temperature-dependent time-correlated single photon counting experiment results of HABT in dichloromethane [ OH( ) and OD( )]. The linear relation between lnk and T-1 is
k=A exp[- Ea/KT]. Note that the data at 303 K
was measured from fluorescence upconversion measurements.
[Normal View 9K | Magnified View 16K]
According to the above coupling reaction scheme, the solvent-dependent, few hundred fs decay component (1) resolved at short wavelengths of the charge-transfer emission and the corresponding ultrafast rise component (1) monitored at longer wavelengths may spontaneously be ascribed to the dynamics of the solvent relaxation. However, careful comparison with respect to MABT in this early time domain leads to several salient differences. First, for HABT, despite the wavelength-dependent decay rate of the major constituent of component (1), its time constant, under the same monitoring wavelength and detection condition, is always faster than the solvation dynamics obtained for MABT. For example, the ultrafast decay component at 410 nm was fitted to be 540?0 fs for HABT in CH3CN, which is nearly
twice as fast as that of 1.12?.12 ps measured in MABT (see Table 1). Upon monitoring at 500 nm for HABT, in which, as indicated by the spectrum and dynamics of MABT in the same solvent, the contribution of the charge-transfer emission is negligible, an appreciable portion of the ultrafast rise components was still observed. Upon monitoring at a very red side of the tautomer emission of 558 nm, which is free from the charge-transfer emission, an ultrafast rise component of 470?0 fs was still resolved, with an initial contribution of 10 %. Apparently, in addition to a channel of solvent relaxation and a pathway of solvent-polarity-induced ESIPT which takes place in the equilibrium polarization described in Scheme 2, another ultrafast deactivation pathway in HABT, possibly incorporating ESIPT, must play a key role to account for the observed relaxation dynamics in polar aprotic solvents.
Further support for this viewpoint is given by the spectral temporal evolution of HABT in Figure 9. The time-dependent spectral evolution of HABT in CH2Cl2, acquired at an earlier time domain of <1.0 ps, has
revealed two distinct bands: A short wavelength band gradually shifted from 400 to 420 nm upon the increase in the pump-probe delay time, accompanied by the increase of the peak intensity which reveals a typical time dependent Stokes-shifted emission due to the solvation relaxation (solvatochromism), indicating a different equilibrium polarization, that is, appreciably different dipolar vectors between Neq
and Neq*. And concurrently, an emission band with a peak wavelength at 520 nm which also gradually
increases at <1 ps; its peak wavelength seems to be independent of the temporal evolution. Compared with the steady-state spectra, the 520 nm band is unambiguously assigned to a keto-tautomer emission. The results clearly show an early growth of the keto-tautomer emission before the Franck-Condon excited N* state relaxes to the solvation equilibrated Neq* state. Thus, after the initial Franck-Condon
excitation, ESIPT should take place concurrently with solvent relaxation, and its contribution, according to the fluorescence upconversion measurement, is 10 %. After a delay time of, for example, >10 ps, the 430 nm band continuously decreases, together with an increase of the 520 nm emission band, these results support a Neq* Teq
* type of ESIPT after the solvation equilibrium. At a delay
unchanged, and the spectral feature was similar to that obtained from the steady-state
approach.
Figure 9. The temporal spectral evolution of HABT in CH2Cl2 acquired at a delay time of A) : 250 fs,
: 500 fs, : 750 fs, : 1 ps, and : 3 ps. B) : 5 ps, : 8 ps, : 14 ps, : 20 ps. The thick solid lines express the steady-state fluorescence.
[Normal View 17K | Magnified View 31K]
Proposed Reaction Mechanism
To rationalize the observed relaxation dynamics of HABT in both the picosecond and femtosecond time scales, we herein tentatively propose a reaction pathway depicted in Scheme 2. On one hand, the observation of solvatochromism and time-dependent Stokes-shifted emission supports a proposal of different dipole moments (in terms of either magnitude or orientation) between Neq and Neq*. On the
other hand, due to the significant changes in the equilibrium constant between Neq* and Teq* as a
function of the solvent polarity, it is also reasonable to expect an appreciable difference in the dipole moments of Neq* and Teq*. In order to develop firm support, we further calculated the dipolar vector of
HABT in various states at a semiempirical level based on the PM3 method. The geometry optimized structures of N and T for HABT with some critical bond distances and angles are depicted in Figure 10. The dipole moments for Neq and Teq were calculated to be 1.65 and 2.24 Debye, respectively, and the
angle between these two dipole vectors was 90? Furthermore, the dipole moments of N* and T* were probed by INDO/S-CI calculations based on a PM3 geometry optimized ground state structure which estimated a dipolar vector of 4.61 D for N*, with an orientation of 65?relative to that of Neq (see Figure
11). The substantial difference in the dipole orientation between Neq and N* supports a charge
redistribution, that is, a charge-transfer character upon excitation. The calculations also clearly revealed similar dipolar vectors between Teq (2.25 D) and T* (1.83 D), in which the angle between vectors of Teq
and T* is as small as 1.3? these results are consistent with the experimental results of near solvent polarity independence for the keto emission peak. Another salient feature is that the difference of orientation and magnitude in the dipolar vectors between N* and T* is as large as 130o and 5.97 D,
respectively. Moreover, as shown in Figure 11, the dipole vector of Neq lies between that of N* and T*,
which is important in constructing a rational mechanism. Although the level and method used in the current theoretical approach, to a certain extent, are not high enough for us to ensure the quantitative values, the results firmly support the correlation of dipole moments among various states of N and T depicted in Scheme 2. We thus feel safe to conclude that Neq, Teq, and Teq* (especially Teq, and Teq*) are
subject to similar solvent-polarization modified free energy, which, however, is quite different for Neq*
due to its charge-transfer property. Upon Franck-Condon excitation of Neq, HABT undergoes an instant
and significant dipolar change due to the charge relocalization. Subsequently, the unfavorable polarization configuration is subject to a rapid solvent relaxation/reorientation to reach an energetically
more favorable configuration. However, due to the identical polarization environments in the enol ground state (Neq) and keto tautomer state (Teq*), the solvent polarization effect may be decoupled from the
ESIPT pathway at early times after the Franck-Condon excitation. If the ESIPT is energetically allowed, then it is expected to be free from the solvent-polarity perturbation, whose rate is competitive with the rate of the solvent relaxation. After reaching a critical solvation configuration, such as point P+ depicted
in Scheme 2, the ESIPT becomes energetically uphill due to the unfavorable solvent polarization, so that the subsequent deactivation should be dominated by the solvent relaxation (reorganization), and finally achieve a solvent equilibrated enol form (Neq*). At this stage, because of the difference in
solvation configurations between Neq* and Teq*, the solvent polarity effect is expected to channel into the
ESIPT reaction pathway, resulting in a non-negligible barrier. Likewise, the ratios of equilibrium constant for Teq* versus Neq
* should be a function of solvent polarity as well, consistently with the
experimental observation.
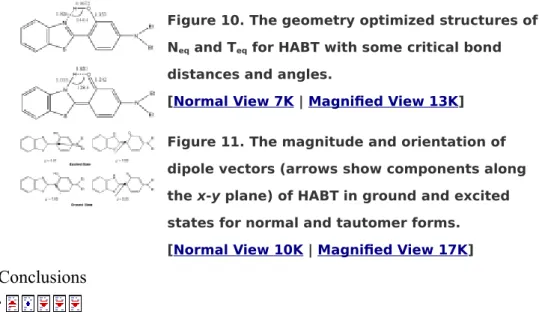
Figure 10. The geometry optimized structures of Neq and Teq for HABT with some critical bond
distances and angles.
[Normal View 7K | Magnified View 13K]
Figure 11. The magnitude and orientation of dipole vectors (arrows show components along the x-y plane) of HABT in ground and excited states for normal and tautomer forms.
[Normal View 10K | Magnified View 17K]
4. Conclusions
In conclusion, we report on the ESIPT reaction of HABT in the femtosecond time scale. In the ground state, HABT exists exclusively as an enol form (Neq) in polar aprotic solvents. Upon Franck-Condon
excitation of HABT, ESIPT is energetically allowed, and the rates of ESIPT and solvent relaxation are competitive. Once the N* state is thermally populated (i.e. Neq*), a relatively slow, solvent-polarity
dependent proton transfer takes place due to the greatly different equilibrium polarization between Neq*
and Teq*, resulting in an appreciable barrier. The core of this mechanism is within the category of a
previously proposed mechanism based on the derivatives of 3-hydroxyflavone.[17]-[19] This is also confirmed by the results obtained for HABT which re-emphasize the importance of the relationships of the dipolar vectors of Neq, Neq* and Teq* and hence the corresponding solvation energetics in order to
shed light on the overall ESIPT reaction dynamics.
Finally, a point that requires special attention is that HABT undergoes a relatively slow rate ( 5.4?.5?011
and hence that the ESIPT can be treated as an intrinsic reaction, the results are in sharp contrast to the >2.9?013 s-1 rate of the ESIPT for the parent compound HBT in the same solvent.[22], [26], [27] On one
hand, it may imply that the charge-transfer property in HABT leads to a different distribution of the charge density from that of HBT, so that the driving force, that is, the acidity of the hydroxyl proton, for the ESIPT is significantly reduced. However, this viewpoint seems contradictory to the ultrafast proton transfer competing with the rate of solvent relaxation in the very early time domain. Alternatively, it is plausible that solvent polarization may still play a role for the ESIPT in cyclohexane. Due to the appreciable dipolar change between Neq* and Teq*, the induced-dipole/dipole interaction may be
considered to be non-negligible, reducing the rate of the ESIPT for HABT in a nonpolar solvent.
Experimental Section
Syntheses of 2-(2 -hydroxy-4 -diethylaminophenyl)benzothiazole (HABT) were based on the condensation of (diethylamino)salicylaldehyde with 2-amino-thiophenol reported in literature.[28] The crude product was further purified by silica gel column chromatography. Elution with a mixture of EA/hexane (v/v=1:5) afforded HABT (81 %) as a white solid. 1H NMR (CD
2Cl2, 400 MHz): =1.23 (t, J=7.2 Hz, 6 H), 3.43 (q, J=7.2 Hz 4 H), 6.25 (d, J=2.4 Hz 1 H), 6.32 (dd, J=8.8, 2.8 Hz, 1 H), 7.32 (td, J=8.4, 0.8 Hz, 1 H), 7.45 (td, J=8.0, 0.8 Hz, 1 H), 7.48 (d, J=8.8 Hz, 1 H), 7.85 (d, J=8.0 Hz, 1 H), 12.40 (s, 1 H). 13C NMR (CD 2Cl2, 100 MHz): =13.3 (1o, CH3), 45.2 (2o, NCH2CH3), 97.8 (3o, S C N), 104.4 (3o), 105.7 (4o), 120.6 (3o), 121.3 (3o), 124.2 (3o), 126.3 (3o), 129.8 (3o), 131.9 (4o), 151.4 (4o),
152.1 (4o), 159.6 (4o), 169.5 (4o). The O H deuterated HABT, that is, DABT, was prepared by
dissolving HABT in CH3OD, followed by the evaporation of CH3OD. This process was repeated several
times until 1H NMR showed <10 % O H proton intensity ( 12).
MABT was prepared via the condensation of 4-diethylamino-2-methoxy-benzaldehyde with 2-amino-thiophenol. The crude product was purified by silica gel column chromatography. Elution with a mixture of EA/hexane (v/v=1:8) afforded compound MABT (86 %) as a white solid. 1H NMR (CD
2Cl2, 400 MHz): =1.23 (t, J=7.2 Hz, 6 H), 3.45 (q, J=7.2 Hz 4 H), 4.03 (s, 3 H), 6.24 (d, J=2.0 Hz 1 H), 6.44 (dd, J=8.8, 2.8 Hz, 1 H), 7.27 (td, J=7.6, 1.2 Hz, 1 H), 7.41 (td, J=8.4, 1.2 Hz, 1 H), 7.87 (dd, J=8.0, 0.8 Hz, 1 H), 7.90 (d, J=8.0 Hz, 1 H), 8.29 (d, J=8.8 Hz, 1 H). 13C NMR (CD 2Cl2, 100 MHz): =13.0 (1o, CH3), 45.2 (2o, NCH 2CH3), 56.0 (1o, OCH3), 94.5 (3o, S C N), 105.4 (3o), 110.5 (4o), 121.5 (3o), 122.1 (3o), 123.9 (3o), 126.1 (3o), 130.9 (3o), 136.0 (4o), 151.6 (4o), 153.1 (4o), 159.8 (4o), 164.4 (4o).
Various solvents used in the spectroscopic and dynamic measurements were of spectragrade quality (Merck Inc.) and used right after received. Benzene and acetonitrile showed traces of fluorescence impurities and were fractionally distilled prior to use.
Steady-state absorption and emission spectra were recorded by a Hitachi (U-3310) spectrophotometer and an Edinburgh (FS920) fluorimeter, respectively. Nanosecond-picosecond lifetime studies were performed with an Edinburgh OB 900 L time-correlated single photon counting system coupled with a femtosecond Ti-Sapphire oscillator (82 MHz, Spectra Physics).[6b] The fundamental pulse was used to produce second harmonics (375-425 nm) as an excitation source.
The fluorescence upconversion measurements were performed using a femtosecond optically gated system, details of which have been described in a previous report.[6b] Briefly, the fundamental of a Ti:sapphire laser (Spectra Physics) at 750-850 nm was used to produce second harmonics (SH) at 375-425 nm. The resulting fluorescence and the optical delayed remaining fundamental pulses were collected and focused on a BBO type-I crystal (0.5 mm) for the sum-frequency generation. The upconverted signal was then separated and detected via a photon counting PMT (R1527P,
Hamamatsu). The cross correlation between SH and the fundamental had a full-width at half-maximum (fwhm) of 150 fs, which was chosen as a response function of the system. A Berek s variable waveplate was placed in the pump beam path to ensure that the polarization of the pump laser was set at the magic angle (54.7? with respect to that of the probe laser to eliminate the fluorescence
anisotropy.
All semiempirical calculations were performed by HyperChem 6.03 on Win2000 Professional on an Intel PIII 800 computer. The magnitudes and angles of the dipole moment in the ground state were
calculated by the PM3 method. The complexity of molecular structure makes an ab initio approach in the excited state extremely time consuming and in some cases even unfeasible. Instead, the properties of the lowest-lying excited singlet state were estimated by an INDO/S-CI calculation based on a PM3 geometry optimized ground state structure. All singly excited configurations from the 10 highest occupied to the 10 lowest unoccupied (100 configurations) molecular orbitals were involved in the computation.
Acknowledgements
We thank the National Science Council (grant number 99-1989-2004) for the
financial support.
REFERENCES
1 In general, it is difficult to distinguish the mechanism between proton transfer and hydrogen atom transfer reactions. Herein, we simply adopted the conventional term, namely proton transfer , throughout the text, as it is particularly more suitable in describing the solvent polarity coupled proton transfer tautomerism.
2 For example, see: A. Müller, H. Ratajczak, W. Junge, E. Diemann in Studies in Physical
and Theoretical Chemistry: Electron and Proton Transfer in Chemistry and Biology, Vol. 78, Elsevier, Amsterdam, 1992.
3
3a S. Scheiner, J. Phys. Chem. A. 2000, 104, 5898-5909; Links
3b J. Waluk: Conformational Aspects of Intra- and Intermolecular Excited-State Proton
Transfer in Conformational Analysis of Molecules in Excited States (Ed.: J. Waluk),
Wiley-VCH, New York, 2000;
3c P. T. Chou, J. Chin. Chem. Soc., 2001, 48, 651-682; Links
3d K.-C. Wu, Y.-M. Cheng, Y.-S. Lin, Y.-S. Yeh, S.-C. Pu, Y.-H. Hu, J.-K. Yu, P.-T. Chou, Chem.
Phys. Lett. 2004, 384, 203-209; Links
3e M. J. Paterson, M. A. Robb, L. Blancafort, A. D. DeBellis, J. Am. Chem. Soc. 2004, 126, 2912-2922; Links
3f S. Lochbrunner, A. J. Wurzer, E. Riedle, J. Phys. Chem. A. 2003, 107, 10580-10590; Links
3g R. de Vivie-Riedle, V. De Waele, L. Kurtz, E. Riedle, J. Phys. Chem. A. 2003, 107, 10591-10599; Links
3h C.-C. Cheng, C.-P. Chang, W.-S. Yu, F.-T. Hung, Y.-I. Liu, G.-R. Wu, P.-T. Chou, J. Phys. Chem.
A. 2003, 107, 1459-1471; Links
3i M. Lukeman, P. Wan, J. Am. Chem. Soc. 2003, 125, 1164-1165; Links
3j A. Douhal, M. Sanz, L. Tormo, J. Organero, ChemPhysChem 2005, 6, 419-423. Links 4 In some ESIPT molecules, the lowest excited singlet state is in an n * configuration, in
which the rate of ESIPT is very slow in comparison to that of the * configuration. 5 ESIPT incorporating phenol O H to a -carbon atom is not included in this category,
see: M. Lukeman, P. Wan, J. Am. Chem. Soc. 2002, 124, 9458-9464. Links 6
6a C. Chudoba, E. Riedle, M. Pfeiffer, T. Elsaesser, Chem. Phys. Lett. 1996, 263, 622-628; Links
6b P.-T. Chou, Y.-C. Chen, W.-S. Yu, Y.-H. Chou, C.-Y. Wei, Y.-M. Cheng, J. Phys. Chem. A. 2001, 105, 1731-1740; Links
6c B. J. Schwartz, L. A. Peteanu, C. B. Harris, J. Phys. Chem. 1992, 96, 3591-3598. Links 7
7a M. Rini, A. Kummrow, J. Dreyer, E. T. J. Nibbering, T. Elsaesser, Faraday Discuss. 2002, 122, 27-40; Links
7b M. Rini, J. Dreyer, E. T. J. Nibbering, T. Elsaesser, Chem. Phys. Lett. 2003, 374, 13-19. Links
8 S. Lochbrunner, A. J. Wurzer, E. Riedle, J. Chem. Phys. 2000, 112, 10699-10702. Links
9 S. Takeuchi, T. Tahara, J. Phys. Chem. A. 2005, 109, 10199-10207. Links
10 V. V. Shynkar, Y. Mély, G. Duportail, E. Piémont, A. S. Klymchenko, A. P. Demchenko, J.
Phys. Chem. A. 2003, 107, 9522-9529. Links
11 A. D. Roshal, J. A. Organero, A. Douhal, Chem. Phys. Lett. 2003, 379, 53-59. Links 12 A. Douhal, M. Sanz, M. A. Carranza, J. A. Organero, L. Santos, Chem. Phys. Lett. 2004,
394, 54-60. Links
13 P. Foggi, L. Bussotti, F. V. R. Neuwahl, S. Ameer-Beg, S. M. Ormson, X. Poteau, R. G. Brown, J. Phys. Chem. A. 2004, 108, 6938-6943. Links
14 14 a
P.-T. Chou, M. L. Martinez, J. H. Clements, J. Phys. Chem. 1993, 97, 2618-2622; Links
14 b
P.-T. Chou, M. L. Martinez, J. H. Clements, Chem. Phys. Lett. 1993, 204, 395. Links
15 15 a
T. C. Swinney, D. F. Kelley, J. Chem. Phys. 1993, 99, 211-221; Links
15 b
F. Parsapour, D. F. Kelley, J. Phys. Chem. 1996, 100, 2791-2798. Links
16 S. M. Ormson, R. G. Brown, F. Vollmer, W. Rettig, J. Photochem. Photobiol. 1994, 81, 65. Links
17 P.-T. Chou, C.-H. Huang, S.-C. Pu, Y.-M. Cheng, Y.-H. Liu, Y. Wang, C.-T. Chen, J. Phys.
Chem. A. 2004, 108, 6452-6454. Links
18 P.-T. Chou, S.-C. Pu, Y.-M. Cheng, W.-S. Yu, Y.-C. Yu, F.-T. Hung, W.-P. Hu, J. Phys. Chem. A. 2005, 109, 3777-3787. Links
19 Y.-M. Cheng, S.-C. Pu, Y.-C. Yu, P.-T. Chou, C.-H. Huang, C.-T. Chen, T.-H. Li, W.-P. Hu, J.
Phys. Chem. A. 2005, 109, 11696-11706. Links
20 P.-T. Chou, W.-S. Yu, Y.-M. Cheng, S.-C. Pu, Y.-C. Yu, Y.-C. Lin, C.-H. Huang, C.-T. Chen, J.
Phys. Chem. A. 2004, 108, 6487-6498. Links 21
21 a
C. Lenoble, R. S. Becker, Photochem. Photobiol. 1990, 52, 1063; Links
21 b
P.-T. Chou, M. L. Martinez, Photochem. Photobiol. 1993, 53, 593. Links
22 22 a
R. S. Becker, C. Lenoble, A. Zein, J. Phys. Chem. 1987, 91, 3509-3517; Links
22 b
23 23 a
A. S. Klymchenko, A. P. Demchenko, Phys. Chem. Chem. Phys. 2003, 5, 461-468; Links
23 b
K.-C. Wu, Y.-M. Cheng, Y.-S. Lin, Y.-S. Yeh, S.-C. Pu, Y.-H. Hu, J.-K. Yu, P.-T. Chou, Chem.
Phys. Lett. 2004, 384, 203-209. Links
24 M. N. Paddon-Row, in Electron Transfer in Chemistry, Vol. 3 (Ed.: V. Balzani), Wiley-VCH, Weinheim, 2001, pp. 179.
25 B. Valeur, Molecular Fluorescence, Wiley-VCH, Weinheim, 2002, pp. 42.
26 S. Lochbrunner, A. J. Wurzer, E. Riedle, J. Phys. Chem. A. 2003, 107, 10580-10590. Links
27 F. Laermer, T. Elsaesser, W. Kaiser, Chem. Phys. Lett. 1988, 148, 119-124. Links 28 C. A. Mathis, Y. Wang, D. P. Holt, G. F. Huang, L. Manik, M. L. Debnath, W. E. Klunk, J. Med.