行政院國家科學委員會專題研究計畫 成果報告
全球不動產市場投資策略(第 2 年)
研究成果報告(完整版)
計 畫 類 別 : 個別型 計 畫 編 號 : NSC 98-2410-H-002-219-MY2 執 行 期 間 : 99 年 08 月 01 日至 100 年 10 月 30 日 執 行 單 位 : 國立臺灣大學國際企業學系暨研究所 計 畫 主 持 人 : 盧秋玲 計畫參與人員: 碩士級-專任助理人員:毛子睿 報 告 附 件 : 出席國際會議研究心得報告及發表論文 處 理 方 式 : 本計畫涉及專利或其他智慧財產權,2 年後可公開查詢中 華 民 國 100 年 10 月 30 日
行政院國家科學委員會補助專題研究計畫
X
成 果 報 告
□期中進度報告
(計畫名稱)
全球不動產市場投資策略
計畫類別:X 個別型計畫 □整合型計畫
計畫編號:NSC 98-2410-H-002-219-MY2
執行期間:2010 年 08 月 01 日 至 2011 年 07 月 31 日
執行機構及系所:台灣大學國際企業學系
計畫主持人:盧秋玲
共同主持人:
計畫參與人員:毛子睿
成果報告類型(依經費核定清單規定繳交):□精簡報告 x 完整報告
本計畫除繳交成果報告外,另須繳交以下出國心得報告:
□赴國外出差或研習心得報告
□赴大陸地區出差或研習心得報告
X 出席國際學術會議心得報告
□國際合作研究計畫國外研究報告
處理方式:
除列管計畫及下列情形者外,得立即公開查詢
□涉及專利或其他智慧財產權,□一年 X 二年後可公開查詢
中 華 民 國 100 年 10 月 30 日
中文摘要 我們檢驗了美國與其他 12 個國家不動產投資信託之間的互動與下方風險的傳遞 方向。結果發現美國 REITs 投資報酬率與其他地區的關連性在泡沫與崩盤時期相 當顯著,且主導報酬率傳遞方向。另外,規模較大的市場的風險值貢獻度在金融 風暴時為最大。不動產所產生的分散風險效益在經濟發生重大衝擊時遞減。 關鍵字:不動產投資信託,風險值,金融風暴。
英文摘要
We examine daily cross-market return interactions and downside risk between a U.S. REIT returns index and the return indexes of twelve international REIT markets. These relationships are investigated for a period of normal REIT market conditions as well as for periods of inflating and collapsing REIT prices. We find that U.S. REIT returns are contemporaneously correlated with other REITs most strongly during the bubble and crash market conditions where the U.S. REIT market is an almost unilateral transmitter of returns. We also find that the Value at Risk (VaR) of the least capitalized REIT markets is proportionally higher during base/normal market conditions but that the largest REIT markets have the highest VaR contribution during the crash (financial crisis) period. Overall, our evidence indicates that REIT market risk shifted to the largest REIT markets and that diversification benefits eroded considerably during turbulent market conditions.
報告內容
1 Introduction
The recent global financial crisis provides a unique opportunity to the study of real estate finance and economics given that this crisis was heavily rooted in the declines of both physical and securitized real estate prices. We seize on this opportunity by studying returns and risk relationships among international REIT markets to provide new evidence of how risk and diversification benefits behave during turbulent market conditions.
The literature on real estate in general and securitized real estate in particular is mixed as to whether international diversification benefits exist. Benefits to diversification exist for two assets when they have low levels of positive comovement and transmission. In this situation, risk levels for a given return level diminish as the optimal balance between the two assets is achieved. Most literature indicating that diversification benefits exist across real estate markets finds that international real estate assets exhibit low levels of comovement and transmission.
Liow and Webb (2009) find that returns transmission among international REIT markets is less than what would be suggested by the level of their respective economic linkages. As a result, diversification benefits exist in internationally-mixed real estate portfolios. In their study of Asian and European REITs, Liow et al. (2005) find that few cointegrating REIT price relationships exist and that only a few markets' REIT returns transmit to other markets. The general lack of returns spillover among markets suggests that country-specific shocks cannot be exported to other markets and that diversification benefits exist when allocating funds across international REITs. Liow and Sim (2006) find diversification benefits specifically for U.S. and U.K. real
estate portfolios invested in Asian REITs whereas Chua (1999) finds positive benefits for all G5 countries. Kallberg et al. (2002) consider the Asian financial crisis of the late 1990's and find that real estate shocks did not transmit across real estate markets but rather developed simultaneously within. As a result, diversification benefits exist despite financial crises. Beyond Kallberg et al., most literature explicitly taking into account financial crises and structural breaks within real estate markets find that these events impact cross-country transmissions. Specifically, cross-country impacts amplify market comovements while eroding international REIT diversification benefits. For example, Wilson and Zurbruegg (2006) note that the benefits to diversifying a U.S.-only portfolio with international real estate decrease once structural changes are considered. When financial crises are specifically examined, prior literature similarly finds that international real estate markets become increasingly interlinked and devoid of cross-market diversification benefits (Bond et al., 2006; Gerlach et al., 2006; Michayluk et al., 2006).
Our study examines diversification benefits using two approaches. The first approach focuses on traditional, pair-wise contemporaneous and causal return relationships between the U.S. and twelve other international REIT markets. The second analysis focuses on the level and relative contribution of downside risk as defined by the Value at Risk (VaR).
Specifically, we estimate the VaR for a hypothetical $1 million REIT portfolio for each country. Estimations are performed using quantile regressions for a base-line period (7/19/2002-12/30/2005), a price bubble formation period (1/2/2006-6/29/2007), and a crisis period of rapidly declining REIT prices (7/2/2007-12/31/2008). These portfolios are then used to construct a hypothetical equally-weighted international portfolio of all thirteen REITs. From there, diversification benefits are calculated for each period.
From our correlation analysis, we find that U.S. REIT returns are positively and significantly linked with most international REIT markets during the bubble and crash periods. Our returns causality results indicate that limited U.S.-to-international REIT relationships exist during the base/normal period whereas U.S. returns transmit to all countries in the crash period. The U.S. stands in contrast to other international REIT markets given that these markets' returns rarely transmit to the U.S. Our causality results are confirmed when examining Variance Decomposition Functions between U.S. and international REITs. Specifically, the U.S. is an almost unilateral influential market in all conditions, especially during the REIT crash. Further, in the crash period, U.S. REITs can explain between 5.9% and 27.1% (average: 14.1%) of international REIT returns in excess of what international REITs can explain of U.S. REIT returns. Taken together, the returns correlation and causality analyses indicate that diversification benefits eroded during the recent financial crisis.
We find that while downside risk is present and strong for most countries during the base and bubble periods, downside risk increases for all markets during the crash period. Also, the most capitalized REIT markets experienced the highest increase in risk reflecting the deteriorating nature of both their physical real estate and financial markets.
Our results additionally show that the least capitalized REIT markets generally contribute the most downside risk to an internationally diversified REIT portfolio during normal market conditions. This situation reverses during the price collapse where REITs in the largest markets contribute the most to downside risk. While always contributing a considerable amount of risk to the international REIT market, the U.S. REIT market becomes the strongest risk contributor during the crash.
comovements as well as the downside risk in each market, we find that these benefits eroded during both the bubble formation and price collapse periods. However, the loss in international REIT diversification benefits eroded most strongly during the bubble formation period. We hypothesize that this last result may be due to similar investment strategies.
This study continues in Section 2 with a description of our data and empirical methodology. Section 3 details our findings while Section 4 concludes with a results summary and the implications of our findings for REIT portfolio management.
2 Data and Methodology
2.1 Dataset
We use daily value-weighted REIT return indexes for the U.S. and 12 international markets to examine their return interactions and VaR characteristics. REITs included in each country index are provided by AME Capital which merged with Macquarie Securities in 2008. Our data originates from Datastream and CRSP and spans 7/19/2002 to 12/31/2008. Countries are selected from Datastream based on their having daily data available for all sub-samples and where each market consists of more than five REIT issues. Based on these criteria, we select Australia (AUS), Belgium (BEL), Canada (CAD), France (FRA), Japan (JPN), the Netherlands (NEL), New Zealand (NZL), Singapore (SNG), South Africa (SAF), South Korea (SKR), Turkey (TUK), the United Kingdom (UKM), and the United States (USR). Other REIT markets such as Greece, Hong Kong, Malaysia, Taiwan, and Thailand are also available from Datastream. However, data for these countries is either sparse or not available across the entire sample.
We construct value-weighted indexes of REIT returns for each country where returns are defined as the change in log close prices and where returns include periodic dividends. We do not adjust for dollar effects given that Bond et al. (2006) find no qualitative changes in their results due to currency adjustment. In addition, abnormally large outliers are deleted from the dataset on a company-by company basis before index construction.
[Insert Fig. 1 about here]
As shown in Fig. 1, both U.S. and international REIT prices have experienced a period of moderate price increases, a period of rapidly growing prices, and a period of rapidly decreasing prices. To study REIT market interactions and risk in light of these fluctuations, we split the full sample into three sub-samples corresponding to the three price phases: base/normal, bubble, and crash. The base sample spans 7/19/2002 to 12/30/2005 where the start date is chosen to coincide with consistent trading in the Singapore index. The bubble formation sample spans 1/2/2006 to 6/29/2007. The beginning of this sample corresponds to a time when both the U.S. and international REIT markets experienced accelerated price growth. The crash sample spans 7/2/2007 to 12/31/2008. The beginning of this sample is chosen to correspond to a time when both the U.S. and international markets were in steady decline and with the Bear Sterns hedge fund collapse.
In terms of REIT index composition, Stevenson (2002) finds that returns volatility transmits bidirectionally among equity and other REIT classes and that REIT markets treat all REIT sub-sector volatilities equivalently. Given that volatility can proxy for information (Ross, 1989), Stevenson's findings indicate that REIT sub-classes are informationally equivalent and transmit information efficiently. Stevenson's findings are supported by Lee and Chiang (2004) who note that REIT sub-sector information commonality
implies that REIT sub-sectors are substitutable within portfolios. Consequently, for index construction we make no adjustment for REIT composition within each index and assume that including different REIT types does not alter the returns and information characteristics of each index.
Note that we do not filter home market equity returns from REIT returns. While prior literature notes that daily REIT returns are influenced by general market sentiment and that sentiment impacts REIT returns more strongly over higher data frequencies (Cotter and Stevenson, 2006; 2007), these relationships may be time-varying, prone to structural breaks (Liow et al. 2009b), and countercyclical to general market trends (Clayton and MacKinnon, 2001; Simon and Ng, 2009). As such, the filtering process itself may introduce as many issues as it resolves. Note that Bond et al. (2006) find few qualitative differences in their results when REIT returns are filtered as opposed to when they are not. We do not incorporate each country's interest rates into our regression models. While interest rates doubtlessly impact REIT returns, we find that these relationships are of varying direction and impact (even within our three regimes).
All 13 markets trade within three rough time zones: European, American, and Asian. Given that we are using close-to-close returns, we do not need to adjust our correlation analysis for the 24-hour trading day. For our returns causality analysis, we report non-adjusted results. For robustness purposes, we analyze adjusted returns causality and find the results qualitatively similar to the non-adjusted results.
2.2 Returns Analysis
Our empirical methodology includes two segments: examining return interactions as well as VaR levels and contributions. Our returns analysis begins with examining contemporaneous return correlations.
Cross-market Granger causality tests are then performed between U.S. and international REIT return indexes using the following model:
5 1 , , 5 1 , , , 0 , , k ik it k k jk jt k it i t i r r r (1) Five lags are chosen within each estimation to capture up to one trading week's worth of interactions. All models are estimated using OLS with the Newey-West correction to account for remaining serial correlation and heteroskedasticity.Two hypothesis tests are performed for each causal relationship. The first test assumes that all cross-market parameters are jointly equal to zero and is defined as:
Ho: γ1 = ... = γ5 = 0.
Rejection of the above hypothesis suggests that returns from country j impact the returns of country i over one to five trading days. The second causality test employs the following hypothesis:
Ho: γ1 + ... + γ5 = 0,
which tests whether the sum of cross-market coefficients is significantly different from zero. Rejection of the second hypothesis implies cumulatively significant cross-market interactions. When statistically significant, we also examine the summed coefficients from each test given that they represent the economic significance of cross-market interactions. Note that we use a conservative 1% significance level throughout our returns analyses to minimize false rejections and due to each sub-sample sizes.
To augment our causality analysis, we examine "Excess" Variance Decomposition Functions (EVDF) between the U.S. and other international REIT markets. Specifically, we estimate bivariate Vector Autoregressions of U.S. and international REIT returns using 5 lags. We then compute the Variance
Decomposition Functions (VDF) for both variable orderings, take the average value per period, and subtract the VDF value of the international market from the VDF value of the U.S. market. Doing this gives us a measure of how much U.S. REIT returns explain international REIT returns in excess of how much international REIT returns explain U.S. REIT returns. Positive values indicate that U.S. REITs have higher explanatory power for international REITs than the reverse.
2.3 Downside Risk Analysis
To analyze tail risk in the international REIT market, we examine Value at Risk (VaR) and VaR contribution. We begin by estimating the VaR for each country's REIT index which is defined as the minimum dollar value loss we can expect from a portfolio of size X, Y% of the time. While VaR can be calculated in many ways, we estimate it using quantile regressions where the daily VaR for a $1 million portfolio of country i's value-weighted REIT index is calculated as:
VaRi = $1,000,000 * qˆY, (2) where qˆY is the expected one day 1% quantile from the following quantile regression:
5 1 , , , 0 , , k ik it k it i t i r r . (3) We estimate Eq. 3 through a bootstrapping procedure (10,000 replications) where OLS parameters serve as starting values. A Kernel sparsity estimator is chosen to relax the i.i.d. assumption normally imposed on quantile regressions. Given that data breaks may impact VaR estimations in quantile regressions at low-tail values (Tsay, 2005; Adrian and Brunnermeier, 2009), we also estimate 10% quantile regressions and find that the subsequent inferences are qualitatively the same as those from the 1% estimations. Note that quantileregressions for each index are performed separately for each sub-sample to avoid structural break estimation issues.
We perform two separate analyses to examine downside risk within and among international REITs. The first analysis examines the median VaR for each REIT index across each period as well as the median index VaR relative to the sum of index VaRs. The first measure gives us a glimpse of how downside risk changed in each REIT market across the different market conditions. The second measure provides an appraisal of how influential each REIT market was during the different market conditions.
The second downside risk analysis examines how diversification benefits changed over the bubble and crisis periods. Specifically, we calculate the following measure:
13 1 13 1 13 2 2 / i i i i i j ij i j VaR VaR VaR VaR (4)where ρij is the returns correlation between REIT portfolios i and j for a given period and VaRi is the Value at
Risk estimate for the ith individual country REIT portfolio (Tsay, 2005). The value of the numerator represents the true VaR of an equally weighted portfolio of international REITs. We stress equal allocations across all countries to avoid REIT market size distortions. The denominator is simply the sum of individual VaRs. The difference between the two quantities lies in the cross-market correlations, ρij. As long as
diversification benefits exist, cross-market return correlations will be sufficiently below unity. Thus, a ratio strictly less than one implies that diversification benefits in the international REIT market exist. Higher (lower) ratio values imply lower (greater) diversification benefits.
3 Empirical Results
3.1 Returns Correlations
Table 1 reports contemporaneous return correlations and their associated significance levels for the base, bubble formation, and crash periods. While we report the returns correlations for all country pairs, our main inferential focus will be on the U.S.
[Insert Table 1 about here]
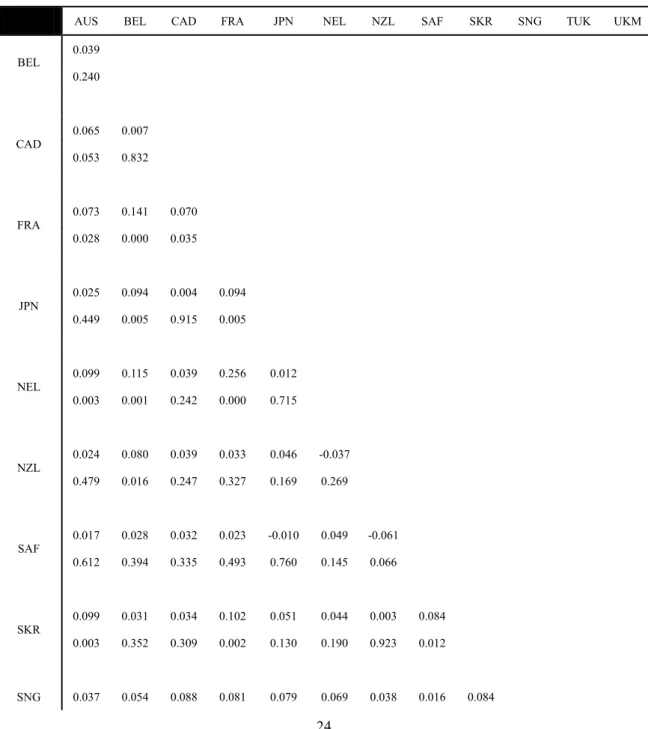
Examining Panel A, we find that most international REITs are not strongly correlated with the U.S. during the base period. Specifically, the U.S. is only significantly correlated with Canada and the United Kingdom. Further, most international REIT returns are not contemporaneously correlated with other international REIT returns. Thus, from the perspective of a U.S. investor, diversification benefits existed in the base period.
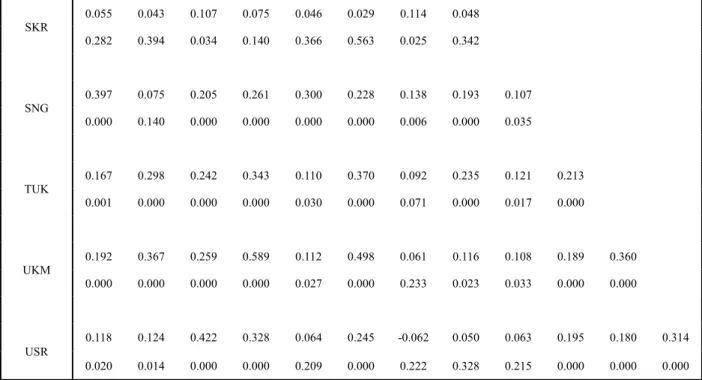
Examining Panel B for the bubble-formation period, we find that cross-market correlations become more frequently significant and of higher magnitude. For example, U.S. REITs are now additionally correlated with French, Netherland, Singapore, and Turkish REITs. Also, while the base period U.S.-Canadian correlation is 0.262, the bubble formation correlation is 0.422. We also find this pattern repeating for international REITs where correlations are larger and more frequently statistically significant. Relative to the base period, diversification benefits for U.S. REIT investors eroded in the bubble formation period.
Turning to Panel C for the crash period, we find that most U.S.-international REIT correlations remain statistically significant while the magnitudes of these correlations have not substantially changed. For the cross-international relationships, however, most are both statistically and more economically significant. From the perspective of U.S. and international investor alike, diversification opportunities still exist given that each
market pair covaries less than perfectly. However, relative to the base period, these benefits have eroded. Our return correlation results are in line with previous literature such as Liow et al. (2009a) who find that bear markets increase REIT correlations and Gordon and Canter (1999) who find that correlations among international REIT returns are not stable across time. An interesting point emerges when examining the average of significant correlations. Across all cross-country pairs, the average of significant correlations in the base, bubble, and crash periods is 0.150, 0.278, and 0.348, respectively. These results indicate that diversification benefits decreased most dramatically from the base-to-bubble formation period as opposed to from the bubble-to-crash period. We then break the average correlations into U.S. versus international markets and find that average U.S. correlations are 0.232, 0.281, and 0.302 while average international correlations are 0.140, 0.278, and 0.353. Thus, the decreases in diversification benefits are most severe for both the U.S. and other international markets from the base to the bubble formation period.
We suggest that the increase in base-to-bubble REIT market correlations may be driven by the herding behavior of portfolio managers. For example, increased REIT returns in the U.S. market may have driven REIT portfolio managers to seek international opportunities to offload country specific, idiosyncratic REIT risk. Evidence for this explanation may be found in Shen et al. (2010) who indicate that the total net assets of international real estate funds grew by 2941% from 1998 to 2008, compared with a growth rate of 221% for domestic real estate funds over the same period. Common behavior among managers might have linked REIT market returns where, fundamentally at least, these linkages would not have been created (e.g. due to real estate market commonalities or financial institution integration).
intra-REIT correlations are not simply due to the general increase in within and cross-asset correlations seen around the latter part of our sample. As we detail in Appendix A, we find that there is an "excess" level of intra-REIT correlation during the bubble and crisis periods over and above the general increase in cross-asset return correlations. Thus, our correlation results are not a result of the "risk-on/risk-off" phenomenon witnessed around the bubble and crisis REIT market conditions.
3.2 Returns Causality
While the return correlation results shed light on contemporaneous relationships, they do not address how U.S. and international REIT market returns transmit. Table 2 reports U.S.-to-international returns Granger causality tests for the base, bubble, and crash periods.
[Insert Table 2 about here]
Focusing first on U.S.-to-international market interactions, we find that the U.S. has limited influence on other REIT markets during the base period. U.S. returns influence tends to focus almost exclusively on REITs in large capital markets (e.g. Australia, Belgium, Canada, France, and the U.K.). These results are not, however, always economically significant (e.g. Belgium). Economically significant relationships indicate that a one percent increase in U.S. REIT returns cause a between a 0.207-0.251% increase in these markets' returns over a trading week.
During the bubble formation period, U.S.-to-international returns causality is less focused on large markets. Only three of these relationships, Australia, Japan, and Singapore, are economically significant. Thus, U.S. influence in the international REIT market was less substantial in the bubble formation period than in the
base period.
During the REIT crash period, however, U.S. REITs are widely influential where they directly influence all twelve international markets. Further, with the exception of South Africa, South Korea, and Turkey, the remaining nine relationships are all large and economically significant. The economic significance of the crash period influences also increase in magnitude. For instance, the U.S.-to-Australia relationship increases in magnitude from 0.213 in the base period, to 0.385 in bubble period, and to 0.610 in the crash period. Thus, the U.S. market became far more influential during the crash period relative to all other periods. This result is not surprising given that the U.S. is likely the main contributor to institutional risk in the crisis period.
[Insert Table 3 about here]
Table 3 reports international-to-U.S. REIT return relationships. With the exception of Japan in the base period and Australia in the crash period, all international-to-U.S. REIT return relationships are insignificant. Thus, the U.S. REIT market is an almost unilateral transmitter of returns across most international REIT markets during the REIT market crash.
In terms of diversification benefits, the almost exclusively unidirectional U.S.-to-international returns causality in the crash period implies that U.S. REIT investors had few REIT safe havens with which to reduce their country-specific risk. For example, in the crash period a one percent increase in U.S. returns causes a 0.762% increase in Japanese returns over the course of a week. This implies that U.S. investors holding Japanese REITs are facing an almost identical REIT market with very similar return risks. Further, those safe havens which the U.S. did not impact at all in the base period (e.g. Singapore) or did not impact in an economically significant manner (e.g. Belgium) are now strongly linked with the U.S. market. In sum,
diversification benefits eroded for U.S. REIT investors seeking international REIT diversification during turbulent market conditions.
Our results are in line with Bond et al. (2006), Gerlach et al. (2006), and Michayluk et al. (2006) who find that diversification opportunities decrease during financial crises. Our results are different from Kallberg et al. (2002) who suggest that countries during the Asian financial crisis experienced internally generated REIT shocks but not shocks from external REIT markets. Rather, our results suggest that the effects of the recent U.S. financial crisis did indeed spillover to other markets.
For robustness purposes, we perform the above causality analyses using returns adjusted for the 24-hour trading day. These results are in line with the non-adjusted results and provide the same qualitative story: the U.S. dominates U.S./international returns relationships and that the strength of U.S.-to-international relationships increased during the bubble and crash periods. Thus, regardless of adjustment, diversification benefits decreased for U.S. investors seeking international REIT opportunities during turbulent market conditions due to increased U.S. returns transmission.
3.3 Excess Variance Decomposition Functions
We plot the Excess Variance Decomposition Functions (EVDF) across ten (hypothetical) trading days where positive values indicate that U.S. REIT returns have higher explanatory power for international REIT returns than the reverse.
[Insert Fig. 2 about here]
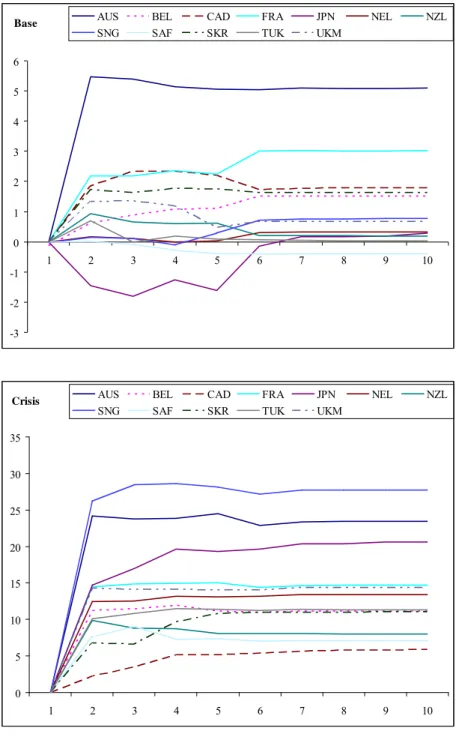
days. Thus, U.S. REIT returns have higher explanatory power for international REIT returns than the reverse in the base period. Also, fast stabilization implies that it takes approximately five to six trading days for U.S. REIT information to be fully incorporated into international REIT returns.
U.S. REITs generally have the highest excess explanatory power for larger REIT markets (e.g. Australia, Canada, and France) and almost zero excess explanatory power for smaller markets (e.g. Singapore, South Africa, and Turkey). The latter observation is likely due to U.S. REIT returns transmitting less frequently to smaller countries in the base period. The one negative EVDF during the base period is for the U.S./Japanese relationship. This finding is likely due to the Japanese REIT market being one of the few international markets that transmit to the U.S. However, Japanese REITs superior explanatory power only lasts for approximately five days and subsequently reverses.
We uncover three main findings from the EVDF analysis during the crash period. First, all EVDFs are positive throughout the hypothetical ten day window indicating that U.S. REITs posess dominant explanatory power over international REITs. This is different from the base period where U.S. REITs only had dominant explanatory power for larger markets. This finding is in line with the causality results which indicate that U.S. REITs transmit to all international REITs only during the crash period. Also, the first EVDF finding is in line with returns transmission being almost exclusively unidirectional from U.S. to international REITs.
The second EVDF finding is that the EVDFs stabilize within approximately three to four days in the crash period as opposed to five to six days in the base period. This finding indicates that most of the information transmission from U.S. to international REITs occurs faster. This may be a result of increased cross-market informational efficiency or faster reaction times by investors in the less stable economy.
The third EVDF finding is that the magnitude of the EVDFs increases dramatically during the crash period. For instance, in the base period, U.S. REITs have about 5% more explanatory power for Australian REITs than Australian REITs have for U.S. REITs. However, during the crash period, the explanatory advantage of U.S. REITs holds over Australian REITs more than quadruples to 23%. Thus, U.S. REITs have higher explanatory power for international REITs during the crash period in both an absolute and relative sense. This finding is in line with the sum of cross market coefficients in the causality tests where the sums increase in magnitude for most U.S.-to-international relationships.
Thus, the EVDF analyses are in line with the causality analysis both of which indicate that U.S. REITs are almost unilaterally influential to most REIT markets in all marketplace conditions. Also, the strength of the U.S.-to-international relationships increases dramatically during the REIT crash. It should be noted that the bubble formation EVDFs are similar to the base period's EVDFs. Therefore, the U.S. influence on international REIT markets increased most during the crash period.
Our finding that US REITs dominate returns transmission may not simply be a function of the deterioration of physical real estate prices, but due to loose banking policies. For instance, the UK pursued a "light-touch" regulatory approach along with a low interest rate policy. Thus, US REITs international influence is likely a function of both a signaling effect and a sentiment effect. With respect to the signaling effect, international REIT investors likely viewed the US market as a leading indicator of future international real estate conditions. With respect to the sentiment effect, many studies (e.g. Bodurtha et al., 1995, and many others) find that the US market impacts other markets' returns to a high degree. Future research may wish to parse out which of the three factors (fundamental, signaling, or sentiment) most influenced the US REIT
market's excessive level of transmission.
3.4 REIT VaR and VaR Contribution
Table 4 reports median VaR for each value-weighted REIT portfolio, the median sum of individual portfolio VaRs, and the median VaR of an equally-weighted portfolio of all international REITs (i.e. Portfolio VaR).
[Insert Table 4 about here]
We find that many REIT portfolios experience sharp increases in downside risk during both the bubble and crash periods. No clear pattern in downside risk increases exist in between the base and bubble periods. However, during the crash period, the top five VaR increases occur in the largest markets (e.g. U.S., Australia, Canada, Belgium, and Japan) whereas the smallest VaR increases occur in the smallest markets (e.g. the Netherlands, Singapore, Turkey, and South Africa). An explanation for the concentration of VaR increases in large markets could that these markets were at the heart of the financial crisis. For instance, the U.S. market experiences a 309.28% increase in VaR during the crisis period.
Looking beyond the individual portfolios' 1% VaR, we also examine the VaR for an equally weighted portfolio of international REITs. We find that VaR increases from $80,898 in the base period to $155,115 and $376,338 in the bubble and crash periods, respectively. These numbers equate to increases of 91.74% and 142.62% in the base-to-bubble and bubble-to-crash periods, respectively. Thus, VaR increases most severely during the REIT market crash.
portfolio VaR relies on estimated correlations that actually occurred during a given period whereas the summed VaR implies perfect correlations among the markets' returns. Thus, the ratio of the two values provides a measure of diversification benefits. During the base period, the VaR ratio is 24.02% indicating relatively unconnected REIT markets and therefore high diversification benefits. During the bubble period, the VaR ratio increased to 43.34% indicating lower diversification benefits. Finally, the VaR ratio in the crash period is 52.26% indicating that diversification benefits are roughly half of those during the base period.
Note that the increase in the VaR ratio is 19.32% and 8.92% for the base-to-bubble and bubble-to-crisis periods, respectively. These results indicate that diversification benefits decreased for both periods but that benefit losses were the greatest during the bubble formation period. These results are in line with our correlation results shown above wherein cross market correlations increase in significance and magnitude during turbulent market conditions.
[Inset Table 5 about here]
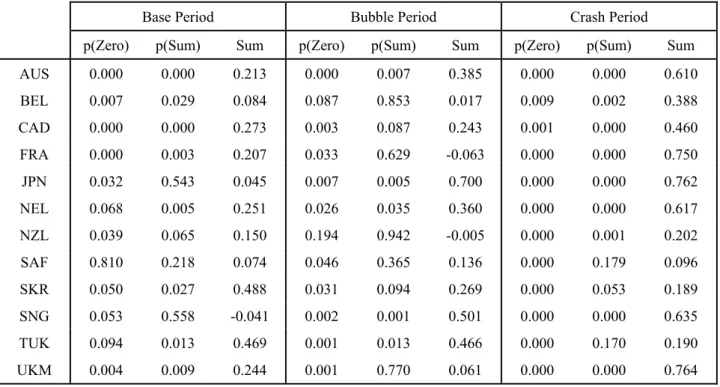
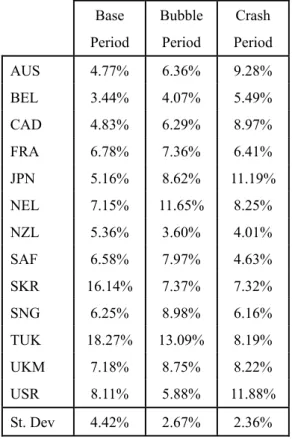
Table 5 reports each portfolio's VaR contribution relative to the sum of individual VaRs. From Table 5, we find that REITs in small markets generally contribute the highest percentage of the VaR to the (aggregate) REIT portfolio during the base period (e.g. South Korea and Turkey). These results indicate that small markets provide the most downside risk to an international REIT portfolio under normal market conditions. For the bubble period, VaR contribution for small versus large REIT markets is less obvious. However, for the crash period, VaR contributions are the highest for the most capitalized markets. For example, the U.S., Japan, Australia, Canada, and U.K. have VaR percentage contributions of 11.88%, 11.19%, 9.28%, 8.97%, and 8.22% respectively. Also, smaller markets have the lowest VaR contribution (e.g. New Zealand and South
Africa have contribution shares 4.01% and 4.63%, respectively). Note that the standard deviation of contributions decreases for both the bubble and crash periods. Taken together, these results indicate that risk contribution increased and concentrated in the largest REIT markets during turbulent market conditions.
In sum, we find that small markets provided the most risk to an international REIT investor during normal conditions. However, during the run up and especially during the crash in REIT prices, large REIT markets contributed the most to the international REIT market's downside risk. These results are likely a reflection of the deteriorated physical real estate and financial markets in these countries at the time of the crash.
As detailed in Appendix B, our three period results are similar to the result of a yearly VaR analysis in that large REIT markets' VaR is relatively low during most of the sample periods and increase exponentially during the bubble formation and crisis periods. In addition, smaller REIT markets are most risky during the beginning of the sample (base period) and only increase moderately in 2008. We also find evidence that VaR has a measure of persistency and, at least statistically, can predict future VaR for a given country. Further, this persistency is highest for the largest REIT markets and increases during the bubble and crisis periods. We leave the issue of VaR predictability in international REIT markets for future research.
It should be noted that, from a market microstructure point of view, our findings that VaR contribution is greatest in the largest REIT markets is somewhat of a puzzle. Specifically, one would expect that, holding all else constant, the largest REIT markets would have relatively higher liquidity and actively traded issues than the smaller REIT markets do. Further, one may argue that the physical real estate markets (on which the REIT prices are based) in larger REIT markets are larger and more liquid. The fact that REIT markets with superior
liquidity and lower market frictions produced higher levels of VaR contribution highlight the role that these large markets played in propagating the crisis. That is, despite the ease of trading in the individual REITs in larger markets, these markets' REITs still retained their destabilizing nature due to fundamental factors such as overheated (physical) real estate prices and risky banking practices. Also of benefit to our study is the fact that real estate, and by extension REITs, in a given country is a type of "pure play". As a result, our study of REIT precludes industry or contagion effects that may affect empirical results on multidivisional or multinational firms' equities.
4 Conclusion
Results from prior literature are mixed as to whether diversification benefits exist when allocating funds across international REITs. Ultimately, the debate boils down to issues of comovement and transmission whereby increased market interactions lead to decreased diversification benefits. The literature is also mixed as to whether abnormal market conditions (general market or REIT-specific) impact international diversification opportunities.
We study 13 international REIT markets across normal, bubble, and crash market conditions. Our findings show that return comovements increased between the U.S. and other international REIT markets during the recent financial crisis. We also show that U.S. REITs are almost exclusive, unidirectional transmitters of returns during the base, bubble formation, and price crash periods. These results suggest that U.S. REITs are more influential than their international counterparts and that U.S. REITs contribute the most to international REIT risk.
significant increases in VaR (downside risk) for most REITs. Further, REITs in the least capitalized markets initially provide the most downside risk to an international REIT investor during normal market conditions. However, the largest REITs markets become the highest risk contributors during the financial crisis. These results likely reflect that REITs in large markets were reasonably stable in normal and even inflating price periods. However, these markets became the least stable during deteriorating REIT prices as well as deteriorating financial system conditions.
Based on our findings, we recommend that portfolio managers seeking international REIT diversification opportunities remain alert to precipitous drops in diversification benefits during both market bubbles and crashes. Also, it is important to not only consider market interactions as measured by returns correlations and causality, but also the level of risk contribution as measured by Value at Risk. Thus, we caution portfolio managers that reducing market-specific, idiosyncratic REIT risk may not be as simple as allocating funds to other REIT markets and that doing so during abnormal market conditions may have both unanticipated and adverse consequences.
Of interest for future research is the evolving European debt crisis and the possibility that one or more Euro-zone members may default. Specifically, given that these countries' default issues are, to some degree, related to risky real estate loans, future research could examine how both the physical real estate and REIT markets' risk contribution, transmission, and comovement changed during the crisis. We leave this for future research.
References
Adrian T, Brunnermeier MK (2009) CoVaR. Federal Reserve Bank of New York Staff Report, no 348
Bodurtha JN, Kim DS, Lee CMC (1995) Closed-end country funds and U.S. market sentiment. Rev Financ Stud 8:879-918
Bond SA, Dungey M, Fry R (2006) A web of shocks: Crises across Asian real estate markets. J Real Estate Finance Econ 32:253-274
Chua A (1999) The role of international real estate in global mixed-asset investment portfolios. J Real Estate Portfol Manage 5:129-137
Clayton J, MacKinnon G (2001) The time-varying nature of the link between REIT, real estate, and financial asset returns. J Real Estate Portfol Manage 7:43-54
Cotter J, Stevenson S (2006) Multivariate modeling of daily REIT volatility. J Real Estate Finance Econ 32:305-325
Cotter J, Stevenson S (2007) Uncovering volatility dynamics in daily REIT returns. J Real Estate Portfol Manage 13: 119-128
Gerlach R, Wilson P, Zurbruegg R (2006) Structural breaks and diversification: The impact of the 1997 Asian financial crisis on the integration of Asia-Pacific real estate markets. J Int Money Finance 25: 974-991
Gordon JN, Canter TA (1999) International real estate securities: A test of capital markets integration. J Real Estate Portfol Manage 5:161-170
Kallberg JG, Liu CH, Pasquariello P (2002) Regime shifts in Asian equity and real estate markets. Real Estate Econ 30:263-286
Lee ML, Chiang KCH (2004) Substitutability between equity REITs and mortgage REITs. J Real Estate Res 26:95-113
Liow KH, Chen Z, Liu J (2009a) Multiple regimes and volatility transmission in securitized real estate markets. J Real Estate Finance Econ Online:1-34
estate securities markets. J Real Estate Finance Econ 39:202-223
Liow KH, Ooi J, Gong Y (2005) Cross-market dynamics in property stock markets: Some international evidence. J Property Invest Financ 23:55-75
Liow KH, Sim MC (2006) The risk and return profile of Asian real estate stocks. Pacific Rim Property Res J 12:283-310
Liow KH, Webb JR (2009) Common factors in international securitized real estate markets. Rev Finan Econ 18: 80-89
Michayluk D, Wilson PJ, Zurbruegg R (2006) Asymmetric volatility, correlation and returns dynamics between the U.S. and U.K. securitized real estate markets. Real Estate Econ 34:109-131
Ross SA (1989) Information and volatility: The No-Arbitrage Martingale approach to timing and resolution irrelevancy. J Financ 44:1-17
Shen YP, Lu C, Lin ZH (2010) International real estate mutual fund performance: Diversification or costly information? J Real Estate Finance Econ forthcoming
Simon S, Ng WL (2009) The effect of the real-estate downturn on the link between REITs and the stock market. J Real Estate Portfol Manage 15:211-219
Stevenson S (2002) An examination of volatility spillovers in REIT returns. J Real Estate Portfol Manage 8:229-238
Tsay RS (2005) Analysis of Financial Time Series: Second Edition. John Wiley and Sons Hoboken, NJ
Wilson PJ, Zurbruegg R (2006). Structural breaks, diversification, and international real estate markets: Some new evidence. Briefings in Real Estate Financ 1:348-366
Table 1 Contemporaneous Return Correlations
The following tables report contemporaneous return correlations between 13 international REIT portfolios. Upper values represent correlation magnitudes while bottom values represent correlation p-values. Panels A, B, and C report correlations for the base (7/19/2002-12/30/2005), bubble formation (1/2/2006-6/29/2007), and crash periods (7/2/2007-12/31/2008). AUS, BEL, CAD, FRA, JPN, NEL, NZL, SAF, SKR, SNG, TUK, UKM, and USR stand for Australia, Belgium, Canada, France, Japan, the Netherlands, New Zealand, South Africa, South Korea, Singapore, Turkey, the United Kingdom, and the United States, respectively.
Table 1 - Panel A: Base Period
AUS BEL CAD FRA JPN NEL NZL SAF SKR SNG TUK UKM
0.039 BEL 0.240 0.065 0.007 CAD 0.053 0.832 0.073 0.141 0.070 FRA 0.028 0.000 0.035 0.025 0.094 0.004 0.094 JPN 0.449 0.005 0.915 0.005 0.099 0.115 0.039 0.256 0.012 NEL 0.003 0.001 0.242 0.000 0.715 0.024 0.080 0.039 0.033 0.046 -0.037 NZL 0.479 0.016 0.247 0.327 0.169 0.269 0.017 0.028 0.032 0.023 -0.010 0.049 -0.061 SAF 0.612 0.394 0.335 0.493 0.760 0.145 0.066 0.099 0.031 0.034 0.102 0.051 0.044 0.003 0.084 SKR 0.003 0.352 0.309 0.002 0.130 0.190 0.923 0.012 SNG 0.037 0.054 0.088 0.081 0.079 0.069 0.038 0.016 0.084
0.262 0.107 0.008 0.015 0.018 0.040 0.253 0.625 0.012 0.099 0.076 0.041 0.072 -0.021 0.061 0.029 0.029 0.051 0.057 TUK 0.003 0.022 0.220 0.031 0.524 0.070 0.388 0.379 0.127 0.086 0.092 0.113 0.179 0.395 0.031 0.201 0.010 0.032 0.129 0.091 0.069 UKM 0.006 0.001 0.000 0.000 0.356 0.000 0.757 0.331 0.000 0.006 0.039 0.072 0.016 0.262 0.080 0.022 0.076 0.011 -0.050 0.028 0.020 0.057 0.202 USR 0.031 0.640 0.000 0.016 0.518 0.023 0.750 0.132 0.404 0.557 0.086 0.000
Table 1 - Panel B: Bubble Period
AUS BEL CAD FRA JPN NEL NZL SAF SKR SNG TUK UKM
0.172 BEL 0.001 0.187 0.205 CAD 0.000 0.000 0.252 0.465 0.294 FRA 0.000 0.000 0.000 0.284 0.139 0.034 0.098 JPN 0.000 0.006 0.507 0.053 0.250 0.473 0.257 0.638 0.098 NEL 0.000 0.000 0.000 0.000 0.053 0.133 0.106 0.076 0.083 0.121 0.092 NZL 0.008 0.037 0.135 0.103 0.017 0.070 0.035 0.102 0.094 0.175 0.135 0.178 0.002 SAF 0.492 0.045 0.064 0.001 0.008 0.000 0.962
0.055 0.043 0.107 0.075 0.046 0.029 0.114 0.048 SKR 0.282 0.394 0.034 0.140 0.366 0.563 0.025 0.342 0.397 0.075 0.205 0.261 0.300 0.228 0.138 0.193 0.107 SNG 0.000 0.140 0.000 0.000 0.000 0.000 0.006 0.000 0.035 0.167 0.298 0.242 0.343 0.110 0.370 0.092 0.235 0.121 0.213 TUK 0.001 0.000 0.000 0.000 0.030 0.000 0.071 0.000 0.017 0.000 0.192 0.367 0.259 0.589 0.112 0.498 0.061 0.116 0.108 0.189 0.360 UKM 0.000 0.000 0.000 0.000 0.027 0.000 0.233 0.023 0.033 0.000 0.000 0.118 0.124 0.422 0.328 0.064 0.245 -0.062 0.050 0.063 0.195 0.180 0.314 USR 0.020 0.014 0.000 0.000 0.209 0.000 0.222 0.328 0.215 0.000 0.000 0.000
Table 1 - Panel C: Crash Period
AUS BEL CAD FRA JPN NEL NZL SAF SKR SNG TUK UKM
0.260 BEL 0.000 0.130 0.373 CAD 0.010 0.000 0.339 0.676 0.517 FRA 0.000 0.000 0.000 0.426 0.350 0.306 0.384 JPN 0.000 0.000 0.000 0.000 0.280 0.703 0.543 0.804 0.345 NEL 0.000 0.000 0.000 0.000 0.000 0.224 0.151 0.002 0.073 0.226 0.078 NZL 0.000 0.003 0.966 0.149 0.000 0.123
0.227 0.290 0.173 0.321 0.294 0.281 0.135 SAF 0.000 0.000 0.001 0.000 0.000 0.000 0.008 0.259 0.210 0.188 0.254 0.284 0.223 0.098 0.233 SKR 0.000 0.000 0.000 0.000 0.000 0.000 0.053 0.000 0.513 0.404 0.335 0.493 0.588 0.438 0.239 0.292 0.311 SNG 0.000 0.000 0.000 0.000 0.000 0.000 0.000 0.000 0.000 0.260 0.275 0.342 0.458 0.272 0.371 0.092 0.351 0.199 0.364 TUK 0.000 0.000 0.000 0.000 0.000 0.000 0.069 0.000 0.000 0.000 0.254 0.563 0.441 0.771 0.270 0.693 0.029 0.264 0.186 0.365 0.433 UKM 0.000 0.000 0.000 0.000 0.000 0.000 0.562 0.000 0.000 0.000 0.000 -0.082 0.223 0.553 0.274 0.015 0.330 -0.103 0.074 0.066 -0.017 0.184 0.250 USR 0.104 0.000 0.000 0.000 0.762 0.000 0.042 0.144 0.193 0.731 0.000 0.000
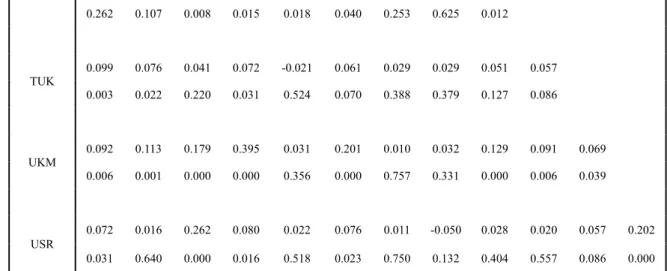
Table 2 Cross-Market Returns Granger Causality: U.S.-to-International Markets
The following table reports cross-market Granger causality test results for each country's value-weighted REIT portfolio returns relative to U.S. REIT portfolio returns. Estimation is performed for the appropriate period using the following general model with Newey-West correction:
5 1 , , 5 1 , , , 0 , , k ik it k k USk USt k it i t i r r r The base period spans 7/19/2002-12/30/2005, the bubble formation period spans 1/2/2006-6/29/2007, while the crash period spans 7/2/2007-12/31/2008. p(Zero) columns report joint zero-coefficient test p-values, p(Sum) columns report summed-coefficient p-values, while Sum columns report the sums of cross-market coefficients. AUS, BEL, CAD, FRA, JPN, NEL, NZL, SAF, SKR, SNG, TUK, and UKM stand for Australia, Belgium, Canada, France, Japan, the Netherlands, New Zealand, South Africa, South Korea, Singapore, Turkey, and the United Kingdom, respectively.
Base Period Bubble Period Crash Period
p(Zero) p(Sum) Sum p(Zero) p(Sum) Sum p(Zero) p(Sum) Sum
AUS 0.000 0.000 0.213 0.000 0.007 0.385 0.000 0.000 0.610 BEL 0.007 0.029 0.084 0.087 0.853 0.017 0.009 0.002 0.388 CAD 0.000 0.000 0.273 0.003 0.087 0.243 0.001 0.000 0.460 FRA 0.000 0.003 0.207 0.033 0.629 -0.063 0.000 0.000 0.750 JPN 0.032 0.543 0.045 0.007 0.005 0.700 0.000 0.000 0.762 NEL 0.068 0.005 0.251 0.026 0.035 0.360 0.000 0.000 0.617 NZL 0.039 0.065 0.150 0.194 0.942 -0.005 0.000 0.001 0.202 SAF 0.810 0.218 0.074 0.046 0.365 0.136 0.000 0.179 0.096 SKR 0.050 0.027 0.488 0.031 0.094 0.269 0.000 0.053 0.189 SNG 0.053 0.558 -0.041 0.002 0.001 0.501 0.000 0.000 0.635 TUK 0.094 0.013 0.469 0.001 0.013 0.466 0.000 0.170 0.190 UKM 0.004 0.009 0.244 0.001 0.770 0.061 0.000 0.000 0.764
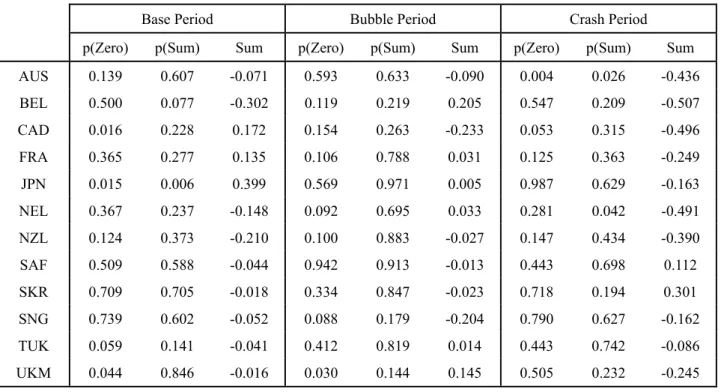
Table 3 Cross-Market Returns Granger Causality: International Markets-to-U.S.
The following table reports cross-market Granger causality test results for U.S. portfolio returns relative to each country's value-weighted REIT portfolio returns. Estimation is performed for the appropriate period using the following general model with Newey-West correction:
5 1 , , 5 1 , , , 0 , , k USk USt k k ik it k USt US t US r r r The base period spans 7/19/2002-12/30/2005, the bubble formation period spans 1/2/2006-6/29/2007, while the crash period spans 7/2/2007-12/31/2008. p(Zero) columns report joint zero-coefficient test p-values, p(Sum) columns report summed-coefficient p-values, while Sum columns report the sums of cross-market coefficients. AUS, BEL, CAD, FRA, JPN, NEL, NZL, SAF, SKR, SNG, TUK, and UKM stand for Australia, Belgium, Canada, France, Japan, the Netherlands, New Zealand, South Africa, South Korea, Singapore, Turkey, and the United Kingdom, respectively.
Base Period Bubble Period Crash Period
p(Zero) p(Sum) Sum p(Zero) p(Sum) Sum p(Zero) p(Sum) Sum
AUS 0.139 0.607 -0.071 0.593 0.633 -0.090 0.004 0.026 -0.436 BEL 0.500 0.077 -0.302 0.119 0.219 0.205 0.547 0.209 -0.507 CAD 0.016 0.228 0.172 0.154 0.263 -0.233 0.053 0.315 -0.496 FRA 0.365 0.277 0.135 0.106 0.788 0.031 0.125 0.363 -0.249 JPN 0.015 0.006 0.399 0.569 0.971 0.005 0.987 0.629 -0.163 NEL 0.367 0.237 -0.148 0.092 0.695 0.033 0.281 0.042 -0.491 NZL 0.124 0.373 -0.210 0.100 0.883 -0.027 0.147 0.434 -0.390 SAF 0.509 0.588 -0.044 0.942 0.913 -0.013 0.443 0.698 0.112 SKR 0.709 0.705 -0.018 0.334 0.847 -0.023 0.718 0.194 0.301 SNG 0.739 0.602 -0.052 0.088 0.179 -0.204 0.790 0.627 -0.162 TUK 0.059 0.141 -0.041 0.412 0.819 0.014 0.443 0.742 -0.086 UKM 0.044 0.846 -0.016 0.030 0.144 0.145 0.505 0.232 -0.245
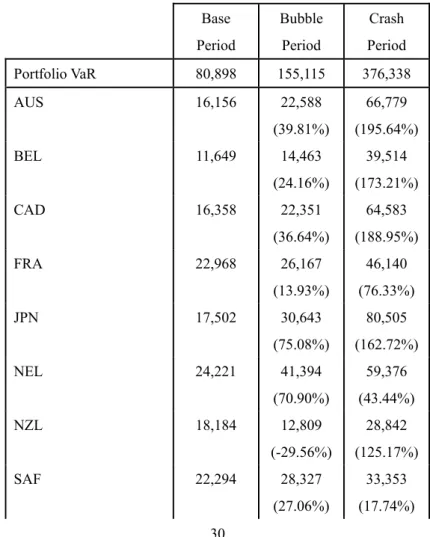
Table 4 Median REIT Portfolio Value at Risk
The following table reports median VaR estimates across the base, bubble, and crash periods. VaR estimates are calculated using predicted values from a 1% quantile regression of own-returns (5-lags). The international portfolio VaR is calculated as:
13 1 13 2 2 i i i j ij i jPortfolio VaR VaRVaR
VaR
where ρij is the returns correlation between REIT portfolios i and j for a given period and VaRi is the Value at Risk estimate for the
ith (individual) country REIT portfolio. The bottom of the table reports the median of summed individual country VaRs and the percentage of actual portfolio VaR to summed VaR (which is necessarily less than 100% given international diversification effects). Values in parentheses indicate the percentage increase in VaR relative to the prior period. The base period spans 7/19/2002-12/30/2005, the bubble formation period spans 1/2/2006-6/29/2007, while the crash period spans 7/2/2007-12/31/2008. AUS, BEL, CAD, FRA, JPN, NEL, NZL, SAF, SKR, SNG, TUK, UKM, and USR stand for Australia, Belgium, Canada, France, Japan, the Netherlands, New Zealand, South Africa, South Korea, Singapore, Turkey, the United Kingdom, and the United States, respectively. Base Period Bubble Period Crash Period Portfolio VaR 80,898 155,115 376,338 AUS 16,156 22,588 (39.81%) 66,779 (195.64%) BEL 11,649 14,463 (24.16%) 39,514 (173.21%) CAD 16,358 22,351 (36.64%) 64,583 (188.95%) FRA 22,968 26,167 (13.93%) 46,140 (76.33%) JPN 17,502 30,643 (75.08%) 80,505 (162.72%) NEL 24,221 41,394 (70.90%) 59,376 (43.44%) NZL 18,184 12,809 (-29.56%) 28,842 (125.17%) SAF 22,294 28,327 (27.06%) 33,353 (17.74%)
SKR 54,716 26,199 (-52.12%) 52,686 (101.10%) SNG 21,184 31,906 (50.61%) 44,300 (38.85%) TUK 61,926 46,512 (-24.89%) 58,953 (26.75%) UKM 24,344 31,096 (27.74%) 59,134 (90.17%) USR 27,483 20,885 (-24.01%) 85,478 (309.28%) Summed VaR 336,860 357,936 720,136
Table 5 REIT Portfolio Value at Risk Contribution
The following table reports VaR contribution for each country relative to the sum of all REIT portfolio VaRs. The base period spans 7/19/2002-12/30/2005, the bubble formation period spans 1/2/2006-6/29/2007, while the crash period spans 7/2/2007-12/31/2008. AUS, BEL, CAD, FRA, JPN, NEL, NZL, SAF, SKR, SNG, TUK, UKM, and USR stand for Australia, Belgium, Canada, France, Japan, the Netherlands, New Zealand, South Africa, South Korea, Singapore, Turkey, the United Kingdom, and the United States, respectively. Base Period Bubble Period Crash Period AUS 4.77% 6.36% 9.28% BEL 3.44% 4.07% 5.49% CAD 4.83% 6.29% 8.97% FRA 6.78% 7.36% 6.41% JPN 5.16% 8.62% 11.19% NEL 7.15% 11.65% 8.25% NZL 5.36% 3.60% 4.01% SAF 6.58% 7.97% 4.63% SKR 16.14% 7.37% 7.32% SNG 6.25% 8.98% 6.16% TUK 18.27% 13.09% 8.19% UKM 7.18% 8.75% 8.22% USR 8.11% 5.88% 11.88% St. Dev 4.42% 2.67% 2.36%
Fig. 1 Index Values
Fig. 1 reports the U.S. REIT returns index (U.S.) against the International REIT returns index (Int.).
50 100 150 200 250 300 350 2002 -08 2002 -12 2003 -04 2003 -08 2003 -12 2004 -04 2004 -08 2004 -12 2005 -04 2005 -08 2005 -12 2006 -04 2006 -08 2006 -12 2007 -04 2007 -08 2007 -12 2008 -04 2008 -08 2008 -12 Inde x V a lu e s U.S. Int.
Fig. 2 Excess Variance Decompositions
The following graphs report ten innovations of Excess Variance Decomposition Functions on REIT returns. Specifically, a VAR(5) of U.S./international REIT returns is estimated for each time period (base upper panel; crisis lower panel) and a Variance Decomposition is performed. This process is repeated using a different variable ordering. From there, the difference in averaged (across orderings) Decomposition Functions between the U.S. and a given international REIT market are computed. Positive values represent the percentage of explanatory power that U.S. REITs have over international REITs in excess of the explanatory power that international REITs have for the U.S. market. AUS, BEL, CAD, FRA, JPN, NEL, NZL, SAF, SKR, SNG, TUK, and UKM stand for Australia, Belgium, Canada, France, Japan, the Netherlands, New Zealand, South Africa, South Korea, Singapore, Turkey, and the United Kingdom, respectively. The base period spans 7/19/2002-12/30/2005 whereas the crash period spans 7/2/2007-12/31/2008. Base -3 -2 -1 0 1 2 3 4 5 6 1 2 3 4 5 6 7 8 9 10
AUS BEL CAD FRA JPN NEL NZL
SNG SAF SKR TUK UKM
Crisis 0 5 10 15 20 25 30 35 1 2 3 4 5 6 7 8 9 10
AUS BEL CAD FRA JPN NEL NZL
Appendix A The Correlation Alpha and Excess REIT Comovement
Our REIT return correlation analysis indicated that intra-REIT correlations increased during both the REIT price bubble and crisis periods. Yet, a valid concern regarding our correlation results is that they may not be due to an underlying economic phenomenon within the REIT or physical real estate market, but are instead due to the general increase in cross-asset correlations seen around the time of the REIT price bubble and crash.
The chart below plots rolling 30-day correlations among REITs and "other" asset classes:
-20% -10% 0% 10% 20% 30% 40% 50% 20020 906 20021 202 20030 318 20030 627 20030 919 20031 217 20040 325 20040 702 20040 922 20041 222 20050 331 20050 629 20050 920 20051 212 20060 317 20060 620 20060 908 20061 201 20070 227 20070 529 20070 820 20071 115 20080 225 20080 521 20080 811 20081 105 Other REIT
Specifically for the "REIT" comovement series, we calculate rolling 30-day correlations between US REIT returns and the returns of 13 international REIT markets. The series plotted above is the average of those different rolling correlations. The "Other" series is the average pair-wise correlation among S&P 500 (spot), crude oil futures, and gold futures returns as well as changes in US 10-year Treasury bond yields. The figure above shows that both intra-REIT and cross-asset correlations increased markedly starting at the beginning of
2005.
Thus, we need to ensure that our intra-REIT correlations are not a by-product of the general increase in cross-asset comovement. To accomplish this, we follow the appreciated guidance of an anonymous referee and calculate a "correlation alpha" for each market by estimating the following regression with Newey-West correction:
US,j,t j jOther,t j,t (A1)
where ρUS,j,t is the rolling 30-day correlation between US REIT returns and the REIT returns of county j while
ρOther,t is the rolling 30-day averaged cross-asset correlations (described above). Thus, each market's alpha represents an "excess" correlation measure above and beyond general cross-asset correlations.
The table below reports each market's correlation-alpha where *** (**) indicates that the correlation alpha is statistically different from zero at the 1% (5%) level:
Base Bubble Crisis
AUS 0.069 *** 0.088 *** 0.158 *** BEL 0.052 *** 0.137 *** 0.240 *** CAD 0.048 *** 0.070 *** 0.167 *** FRA 0.099 *** 0.167 *** 0.269 *** JPN 0.034 *** 0.061 *** 0.147 *** NEL 0.079 *** 0.177 *** 0.289 *** NZL 0.010 0.033 *** 0.040 ** SAF 0.023 0.024 0.084 *** SKR 0.041 *** 0.062 *** -0.008 SNG 0.045 *** 0.090 *** 0.171 *** TUK 0.043 *** 0.132 *** 0.126 *** UKM 0.103 *** 0.172 *** 0.258 ***
We find that, with few exceptions, each market's excess correlation with the US market is positive and statistically significant regardless of the period under investigation. Further, each REIT market's correlation-alpha increases over the bubble and crisis periods. These results indicate that intra-REIT correlations increased during the bubble formation and crisis periods (relative to the base period) and that these correlations are in excess of the general increase in cross-asset correlations. Thus, our correlation results are robust to a "systematic" measure of asset correlations.
Beyond the result that intra-REIT correlations exist in excess of general cross-asset correlations, we also find that US/county REIT excess correlations follow the same pattern as the unconditional correlation results. Specifically, the chart below reports the estimated alpha from Eq. A1 for each market for each of the three time periods. 0% 5% 10% 15% 20% 25% 30% 35%
AUS BEL CAD FRA JPN NEL NZL SAF SKR SNG TUK UKM
Base Bubble Crisis
We find that the correlation alphas are relatively higher for the larger REIT markets (e.g. Australia, Belgium, Canada, France, Japan, and the U.K.) and relatively lower for the smaller REIT markets. This result is consistent with our unconditional correlation finding that larger (smaller) REIT returns comove to a higher
degree with other larger (smaller) REIT markets.
We also observe that most countries' REIT market correlations are positively and significantly associated with the "other" assets' correlations and that the magnitudes of these relationships differ across REIT markets. This finding is similar to Kallberg et al. (2002) in that REIT market comovement is related to general cross-asset comovement and varies across REIT markets.
Appendix B VaR By Year and VaR Predictability
We extend our three period VaR analysis by estimating downside risk for each year and for each country. The following figures report the VaR for each country where the top (bottom) figure plots larger (smaller) REIT markets within our sample:
0 20,000 40,000 60,000 80,000 100,000 120,000 2002 2003 2004 2005 2006 2007 2008
0 20,000 40,000 60,000 80,000 100,000 120,000 2002 2003 2004 2005 2006 2007 2008
MAL NEL NZL SAF SKR SNG TUK
From the figures above, we find that, similar to our three period analysis, VaR consistently increases year-over year for the larger REIT markets around the bubble and crisis periods (2006-2008). Also, we find that the VaR associated with smaller REIT markets decreases for most of the sample and increases only during the crisis period. However, the increase in the small REIT markets' VaR usually does not surpass their high base period VaR. Thus, our three period results are reasonably robust to break-point specification. The yearly VaR results are also consistent with the three period VaR results in that US REITs exhibit the highest level of downside risk during the crisis (2008) period.
While we do not perform formal statistical break-point tests on the yearly VAR data, it's clear that most markets exhibit a trend structural break around 2006-2007. Trend structural breaks do exist for different REIT markets before the 2006-2007 period but are of widely varying magnitude and timing. Thus, at least qualitatively, our results are consistent with Kallberg et al. (2002) who find that volatility structural breaks occur concurrently among developing REIT markets during crises. Accordingly, our VaR results indicate that a common information shock impacted REIT markets around the transition from the price bubble to the price
crash. We leave it to future research to determine which effect was responsible for this commonality: fundamental conditions (e.g. banking conditions, physical real estate conditions, monetary policy, or regulatory environment), a signaling effect, or a sentiment effect.
To statistically test whether the above observations hold, we run a series of panel regressions. Specifically, we estimate the yearly 1% VaR for each country's $1M hypothetical portfolio and perform three fixed-effects estimations as follow:
VaRi,t i 1Li,t (A2)
VaRi,t i 2B3Ci,t (A3) VaRi,t i 1L*B2L*Ci,t (A4)
where VaRi,t is the yearly estimate of the 1% Value at Risk for country i, L is an indicator variable equal to one for large REIT markets (i.e. Australia, Belgium, Canada, France, Japan, the UK, and the US) while B (C) is an indicator variable equal to one during the (approximate) bubble formation (crisis) period of 2005 to 2006 (2007 to 2008). Thus, Eq. A2 tests whether there is a difference between large versus small REIT market's VaR. Eq. A3 tests whether VaR was greater during the bubble and crisis periods (relative to the base period). Eq. A4 finally tests whether an interaction effect exists wherein the largest REIT have the highest VaR during the bubble and crisis periods.
The table below reports the estimation results of Eq. A2-A4 where the standard errors have been bootstrapped using 30,000 iterations and country clustering:
(A2) (A3) (A4)
Coef. p-Value Coef. p-Value Coef. p-Value
Bubble -- -- -1,597 0.618 -- --
Crisis -- -- 20,592 0.000 -- --
Large*Bubble -- -- -- -- 3,738 0.007
Large*Crisis -- -- -- -- 36,108 0.000
R2 (Adjusted) 0.018 0.261 0.216
The results for Eq. A2 indicate that, across the overall sample there is no statistical difference between large and small REIT markets' VaR. Also, the results for Eq. A3 indicate that, across the overall sample of countries, VaR is statistically greater only during the crisis period relative to the base period. Taken together, results from A2 and A3 suggest that any VaR differences across countries and/or time frames are not statistically different; potentially weakening our prior results.
Yet, when examining the estimation results for Eq. A4, an entirely different story emerges. Specifically, we find that both interaction coefficients are positive and statistically significant. Also, the crisis interaction coefficient is almost ten times larger than the bubble interaction coefficient. These results suggest that VaR is significantly higher for larger REIT markets during the bubble and crisis periods. Also, the difference in VaR between the larger and smaller REIT markets increases substantially during the crisis period. When matched with the results from Estimations A2-A3, we get a consistent story that VaR (and therefore downside risk) was really only severe for the largest of REIT markets and that the severity of this downside risk increased during "abnormal" market conditions. Thus, our three period results are robust to structural break issues and are not simply reflecting magnitude differences.
We test this hypothesis by estimating the following panel regressions using the same sample and estimation methodology as in Eq. A2-A4:
VaRi,t i 1VaRi,t1i,t (A5)
VaRi,t i 1VaRi,t11L*B*VaRt1 2L*C*VaRt1 i,t (A6) The results of these regressions are reported in the following table:
(A5) (A6)
Coef. p-Value Coef. p-Value
Vt-1 0.867 0.002 0.324 0.016
Large*Bubble* Vt-1 -- -- 0.059 0.549
Large*Crisis* Vt-1 -- -- 1.078 0.000
R2 (Adjusted) 0.367 0.509
From the table above, we find that VaR is highly own-persistent given that the VaR for the next year is 0.867 times the VaR in the prior year. Also, despite there being no other explanatory variables, this year's VaR can explain 36.7% of the variation in next-year's VaR. Of additional interest is whether VaR predictability exhibits the asymmetric effects found in the prior panel estimations. We find that, while there is no difference in VaR predictability for larger REIT markets during the bubble formation period, we do find evidence that larger REIT markets exhibit a larger degree of persistency during the crisis period. Thus, VaR does have predictive power for future downside risk and this effect seems to vary, at least in this preliminary analysis, across both REIT market size and REIT market conditions. We leave it to future research to determine the extent of (own) VaR predictability, the additional explanatory drivers of VaR and VaR predictability, and whether/to what extent downside risk spills over in international REIT markets.