Assessment of Taiwan’s Growth and Current
Competitiveness
CHU, Yun-eng, KAO, Yuang-kuang
Summary
The World Economic Forum assesses national competitiveness on the basis of three
indexes: science and technology, public institution and system, and macroeconomic
environment. Two more indexes – enterprise competitiveness and infrastructure
construction – are included in an assessment of Taiwan’s growth and current
competitiveness. The resulting evaluation scheme comprises five factor indexes: science
and technology, public institution and system, macroeconomic environment, enterprise
competitiveness, and infrastructure construction.
The Delphi Method is adopted for this survey. Five groups of advisors have chosen
by as many groups of scholars and experts as the respondents in the survey. Altogether
150 respondents have been selected.
The assessment of Taiwan’s growth and current competitiveness on the basis of the
five factor indexes results in an overall average rating of 4.9747. In two of them, public
institution and system and macroeconomic environment, the scores are below the average.
The scores in the other three – science and technology, enterprise competitiveness, and
infrastructure construction – are above the average.
The WEF evaluation indexes are applied for a comparison in competitiveness among
six nations (regions) in East Asia (Japan, South Korea, Taiwan, Hong Kong, Singapore and
China). Their standings, as found in this study, are as follows:
1. Technology Index: Japan, South Korea, Taiwan, Singapore, Hong Kong and
China.
2. Public Institution and System Index: Singapore, Japan, Hong Kong, Taiwan, South
Korea and China.
3. Macroeconomic Environment Index: Singapore, South Korea, China, Hong Kong,
Taiwan, and Japan.
General Advisor
Chu, Yun-peng
President, Jin Wen Institute of Technology
General Monitor
Kao, Yuang-kuang
M.E.P.A Executive Director, College of Social
Sciences, National Chengchi University
Liu, Pei-yi
Assistant Professor, Hsuan Chuang University
Director
Technology Index Panel
Chien, Chao-hsin
Lecturer, Da Han Institute of Technology
Song, Sheau-yuan
Professor and Chairman , Center for General
Education, Central Police University
Director
Public Institution and
System Index Panel
Kuo, Chung-ling
Lecturer, Kuang Wu Institute of Technology
Chao, Pi-hua
Associate Professor, Soochow University
Director
Macroeconomic
Environment Index Panel
Yu, Yi-wen
Lecturer, National Taipei College of Business
Hsu, Shu-ming
Associate Professor, Taipei Municipal Teachers
College
Director
Enterprise Competitiveness
Index Panel
Wu, Ta-ping
Lecturer, Jin Wen Institute of Technology
Liu, Teng-chung
Dean for Student Affairs, Kang Ning Jr. College of
Nursing
Director
Infrastructure Construction
Index Panel
Niu, Tso-chien
Lecturer, Providence University
Content
Ⅰ. Background
1. Methodology
2. Procedures
3. Overall Assessment of Taiwan’s Growth and Current Competitiveness
Ⅱ. Technology Indexes Assessment
1. Quantitative Analysis Results for Technology Index
2. Quantitative Analysis Results of Subindices under Technology Index
3. Quantitative Analysis Results of Component Indices under Technology Index
Ⅲ. Public Institution and System Assessment
1. Quantitative Analysis Results for Public Institutions and System Index
2. Subindex Quantitative Analysis Results under Public Institution and System Index
3. Quantitative Analysis Results of Component Indices under Public Institution and System Index
Ⅳ. Macroeconomic Index Assessment
1.Macroeconomic Environment Index Analysis Results
2. Subindices Analysis Results under Macroeconomic Environment Index
3. Component Indices Analysis Results of Macroeconomic Environment Index
Ⅴ. Enterprise Competitiveness Index Assessment
1. Quantitative Analysis Results of Enterprise Competitiveness Index
2. Subindex Quantitative Analysis Results under Enterprise Competitiveness Index
3. Quantitative Analysis Results of Component Indices under Enterprise Competitiveness Index
Ⅵ. Infrastructure Construction Index Assessment
1. Infrastructure Construction Index Analysis Results
2. Subindices Analysis Results under Infrastructure Index
3. Component Indices Analysis Results under Infrastructure Construction Index
Ⅶ. Comparison Assessment of Five Indexes
Ⅷ. Comparison among Six Nations (Regions) in East Asia
1. Technology Index
2. Public Institution and System Index
3. Macroeconomic Environment Index
4. Comparison with WEF and IMD Assessments
5. Comparison with WEF Major Factor Indexes
Ⅰ.Background
With the forthcoming of the Earth Village, the commodities, services, information, technology, manpower and capital are moving from country to country at a fast speed. Each nation will have to work on promoting its national competitiveness so as to take a position here. National competitiveness is an ability of a nation to create and accumulate national wealth. The stronger the competitiveness is, the more the national wealth will become, vice versa. The units to create the national wealth include individuals, enterprises and the governments. Governments can perfect legal system, strengthen financial system, reform administration and improve infrastructure, thereby creating the sustainable environment in which enterprises operate, arouse the vigor of non-governmental societies, eventually for national sustainable development.
As regards the definition of the national competitiveness, according to Michael E. Porter, of Harvard University, it means that a nation has a good industrial development environment, thus ensure its ability to obtain competitive advantage. So how to raise productivity is an essential factor to strengthen competitiveness1. According to International Institute for Management Development located in Loussane, Switzerland, the national competitiveness means an ability of a nation to create added value and accumulate national wealth2. However, according to World Economic Forum, loated Geneva, Switzerland , national competitiveness refers to an overall ability of a nation in the high sustained economic growth rate and high national income 3 .
1 Michael E. Porter, The Competitive Advantage of Nations, New York: The Free Press, 1990.
2 IMD, The World Competitiveness Yearbook 2001. 3
WEF, The Global Competitiveness Report 2001-2002.
Since the national competitiveness is differently defined, different patterns are employed in its rating principles, rating indexes and index statistical data application. Of the patterns, the annual competitiveness reports produced by WEF and IMD have been given high weight on by the governments and enterprises, and used as their reference for decision making. So they are the most authoritative.
National competitiveness is an ability to assess whether a nation has an environment favorable for enterprises to maintain its competitiveness, thus obtain the sustainable development of the whole nation. In this case, rating indexes and methods must be expanded, so that their assessment results will be representative and generally accepted. Both WEF and IMD employ measure-based Multiple Index Overall Rating as their rating pattern for national competitiveness assessment. Their index pattern employs multi-story Tree-like Structure. The first story is overall national competitiveness. The second story is the competitiveness of major factors rating indexes. The third story is the competitiveness of sub-factor rating index. The fourth story is the competitiveness of the components rating of the subindex.
The calculation method employed by WEF and IMD for national competitiveness rating index is step integration. That is, the rating values of each component index from all the nations are calculated by weighted average method, to obtain the rankings of each nation in subindex and major index. Thus the global ranking in the overall competitiveness is given. The two organizations are quite subjective on weighted average method and weighted average set, thus naturally some controversies often arise among the rated nations.
WEF report has revealed the rankings of all the economies on two major factor indexes. In addition to the growth competitiveness index of economic growth potential in the next five years, it describes current
competitiveness index of the current productivity and economy from economical angle. Of them, growth competitiveness index is divided into three ma jor factor indexes, i.e. science and technology, public institution and system, and macroeconomic environment. The current competitiveness index introduced in 2000 is also divided into two major factor indexes, i.e, enterprise operation and strategy maturity and quality of business environment. Each major factor index is composed of subindexes and component indexes. This project is based on the WEF assessment design slightly corrected. It divides Taiwan’s Growth and Current
Competitiveness into 5 major factor indexes for assessment, namely, science and technology, public institution and system, macroeconomic environment, enterprise competitiveness, and infrastructure construction. Among them, the former three items respond to the Growth Comp etitiveness Index of the WEF and the latter two items respond to the Current Competitiveness Index of the WEF. Therefore, for Taiwan’s growth and current competitiveness, the index structure for the assessment is illustrated as follows (Table 1):
Table 1 Taiwan’s Growth and Current Competitiveness Index Structure
Subindex and component index under major factorindexes Major factor index
Subindices Component indices
Remarks Education 8 Patents 6 Information 12 Government 11 Technology index Enterprises 12 5 subindices 49 component indices Personnel 8 Quality 6 Fairness 12
Public institution and system index Efficiency 8 4 subindices 34 component indices Market 14 Society 14 Macroeconomic environment index Government 8 3 subindices 36 component indices Human resource 2 Marketing 3 R&D 4 Finance 1 Information 1 Enterprise competitiveness index Operation strategy 3 6 subindices 14 component indices Environment safety 5 Quality 20
Taiwan’s growth and current competitiveness index
Infrastructure construction index
Fairness 3
3 subindices
1.Methodology
The project adopts Delphi Method, which is based on the following basic principles:
(1) Structuring of information flow: In order to have an effective communication among participants, Delphi Method offers a kind of structured infomration flow, featuring repeated investigations by way of a continuous structured questionnaire. (2) Anonymity for the participants’ decisions. Delphi
Method offers a series of inquiries, usually by means of questionnaires. Each subsequent inquiry is accompanied by information regarding the preceding round of replies. It is a kind of research method existing between questionnaire and meeting.
(3) Expert judgment. After each survey, the respondents make new judgments based on feedback materials. Repeat such steps until the opinion discrepancies
between experts are reduced to minimum level. The final conclusion and opinion analysis presented by the participants can reflect their common recongnition as well as their different opinion areas.
2.Procedures
The respondents of this assessment project consist of 5 groups of scholars and experts selected by 5 groups of advisors (Table 2). The assessment fo r each major factor index requires 30 experts. There are a total number of 150 scholars and experts selected for the assessment of Taiwan’s growth and current competitiveness (Tables 1~5). Their specialty background covers management, economy, law, politics, society and education. They work in 17 different departments and institutes. For the experts and scholars who accepted the invitations as the respondents to the questionnaire, please see Table 3,Table 4, Table 5 , Table 6 and Table 7 .
Abbreviations of Institutions
Full Names Abbreviations
Academia Sinica SINICA
Chinese Culture University PCCU
Fu Jen Catholic University FJU
National Central University NCU
National Cheng Kung University NCKU
National Chengchi University NCCU
National Chiao Tung University NCTU
National Chung Cheng University CCU
National Sun Yat-Sen University NSYSU
National Taipei University NTPU
National Taiwan University NTU
National Tsinghua University NTHU
Soochow University SCU
Tamkang University TKU
Table 2 List of Advisors
Advisors of Technology Index PanelChen, Yu -wu Former President, Chuang-Shan Institute of Science and Technology Chao, Pi-hua Associate Professor, Department of Social Work, Soochow University
Advisors of Public Institution and System Index Panel
Chou, Yu -jen Professor, Department of Public Administration & Policy, National Taipei University Chiang, Min-hsiu Professor, Department of Public Administration, National Chengchi University
Advisors of Macroeconomic Environment Index Panel Kao, An-pang Dean, College of Social Sciences, National Chengchi University Cheng, Jen-hung Secretary General, Consumers’ Foundation, Taiwan
Huang, Jr-tsung Assistant Professor, Sun Yat-Sen Graduate Institute of Social Sciences and Humanities Advisors of Enterprise Competitiveness Index Panel
Jacob Y.H. Jou Dean, College of Business Administration, National Chiayi University Cheng, Hsing-ti Professor, Department of Public Administration, National Chengchi University
Advisors of Infrastructure Construction Index Panel Liang, Chi-yuan Research Fellow, Institute of Economics, Academia Sinica
Feng, Cheng-ming Professor, Institute of Traffic and Transportation, National Chiao Tung University Chen, Yi n-yan Chairman, Department of Political Science, National Chengchi University
Table 3 Technology Index Questionnaire
Schools NTU NCCU TPU SCU PCCU NTHU NCTU CCU NCKU NSYSU Total
Number of
Respondents 4 6 1 2 1 2 2 5 5 1 30
Number of respondents
selected by advisors 24 25 4 5 4 5 4 15 6 8 100
Percentage 16.67% 24% 25% 40% 25% 40% 50% 33.33% 83.33% 12.5% 30%
Schools NTU NCCU TPU SCU PCCU NTHU NCTU CCU NCKU NSYSU Total
Departments and institutes in which respondents work 4 6 1 2 1 1 1 4 3 1 24 Number of respondents 4 6 1 2 1 1 1 4 3 1 24 Number of departments and institutes selected
by advisors
9 10 3 4 4 2 1 6 3 4 46
Number of respondents
selected by advisors 9 10 3 4 4 2 1 6 3 4 46
Table 4 Public Institution and System Index Questionnaire
Schools NTU NCCU TPU SCU PCCU SINICA THU CCU NSYSU TOTAL
Number of respondents 5 6 4 4 2 2 1 1 5 30
Number of respondents
selected by advisors 53 47 19 14 5 2 11 8 9 168
Percentage 9.43% 12.77% 21.05% 28.57% 40% 100% 9.09% 12.50% 55.56% 17.86%
Schools NTU NCCU TPU SCU PCCU SINICA THU CCU NSYSU TOTAL
Departments and institutes
in which respondents work 3 3 1 3 2 2 1 1 3 19
Number of departments and institutes selected by
advisors
7 8 2 4 3 2 1 2 3 32
Percentage 42.86% 37.50% 50% 75% 66.67% 100% 100% 50% 100% 59.38%
Table 5 Macroeconomic Environment Index Questionnaire
Schools NTU NCCU TPU SCU FJU SINICA NTHU THU CCU NCKU NSYSU TOTAL
Number of respondents 3 9 1 3 2 2 1 1 5 2 1 30 Number of respondents selected by Advisors 26 27 8 5 14 4 3 4 10 3 3 107 Percentag 11.54% 33.33% 12.5% 60% 14.29 % 50% 33.33% 25% 50% 66.67 % 33.33% 28.04%
Schools NTU NCCU TPU SCU FJU SINICA NTHU THU CCU NCKU NSYSU TOTAL
Departments and institutes in which respondents work 3 6 1 2 1 1 1 1 3 2 1 22 Number of departments and institutes selected by advisors 9 11 3 3 1 3 2 3 4 2 2 43 Percentage 33.33% 54.55% 33.33% 66.67% 100% 33.33% 50% 33.33% 75% 100% 50% 51.16%
Table 6 Enterprise Competitiveness Index Questionnaire
Schools NTU NCCU FJU SINICA NCU THU CCU NCKU NSYSU TOTAL
Number of respondents 5 5 4 4 2 1 5 2 2 30
Number of respondents
selected by advisors 58 43 34 25 16 2 10 10 22 220
Percentage 8.62% 11.63% 11.76% 16% 12.50% 50% 50% 20% 9.09% 13.64%
School NTU NCCU FJU SINICA NCU THU CCU NCKU NSYSU TOTAL
Departments and institutes
in which respondents work 3 3 3 1 2 1 3 2 2 20
Number of departments and institutes selected by
advisors
11 11 3 3 3 2 4 5 6 48
Percentage 27.27% 27.27% 100% 33.33% 66.67% 50% 75% 40% 33.33% 41.67%
Table 7 Infrastructure Construction Index Questionnaire
Schools NTU NCCU SCU PCCU TKU SINICA NTHU NCTU NCU THU CCU NCKU NSYSU TOTAL
Number of respondents 7 2 2 1 1 2 1 3 2 1 2 4 2 30 Number of respondents selected by advisors 17 15 5 5 6 8 2 7 5 2 5 9 6 97 Percentage 41.18 % 13.33 % 40% 20% 16.67 % 25% 50% 42.86 % 40% 50% 40% 44.44 % 33.33% 30.93%
Schools NTU NCCU SCU PCCU TKU SINICA NTHU NCTU NCU THU CCU NCKU NSYSU TOTAL
Departments and institutes in which respondents work 5 1 2 1 1 1 1 3 2 1 2 3 2 25 Number of departments and institutes selected by advisors 11 12 5 5 5 3 2 5 4 2 5 6 5 70 Percentage 45.45 % 8.33% 40% 20% 20% 33.33% 50% 60% 50% 50% 40% 50% 40% 35.71%
We have carried out two surveys for this project. The first survey took place on Jan.19-29, 2003. We collected 141 copies of questionnaires at the rate of 94%, including 29 copies for technology index, 28 copies for public institution and system index, 27 for macroeconomic environment index, 30 for enterprise competitiveness and 27 for infrastructure construction. The second survey took place on Jan.31- Feb.20, 2003. We collected 143 copies of questionnaires at the rate of 95.33%, including 29 copies for technology index, 27 for public institution and system index, 29 for macroeconomic environment index, and 30 for enterprise competitiveness, 28 for infrastructure
construction.
Each index was evaluated at full score of 10. The higher the score is, the better this index performs and the higher the competitiveness is, and vice versa. By 10-score expression, it suggests that 10 scores indicates competitiveness extremely high. 9 scores indicates very high towards extremely high, 8 scores for very high, 7 scores for higher toward very high, 6 scores for higher, 5 scores for Ordinary, 4 scores for lower, 3 scores for lower towards very low, 2 scores for very low, one score for very low to very low and Zero for quite low ( see Fig.1 below).
Fig.1 10-Score Expression
0 1 2 3 4 5 6 7 8 9 10
+ - - - +
Quite low
Very low to quite low
Very low
Lower toward very low
Lower Ordinary Higher
Higher towards Very high
Very high
Very high toward extremely high
Extremely hgih
3. Overall Assessment of Taiwan’s Growth and
Current Competitiveness
From the above, the project has obtained the average value of 4.9747 based on overall assessment on five major factor indexes, including technology, public institution and system, enterprise competitiveness, infrastructure construction, and macroeconomic environment. This suggests that the performance of Taiwan’s Growth and Current Competitiveness is
Ordinary. The competitiveness performance of the 5 major factor indexes is described in 5 chapters as follows.
Ⅱ. Technology Index Assessment
1.Quantitive Analysis Results for Technology
Index
namely, education, patents, information, government and enterprise. Of them, education includes 8 component indexes; patents includes 6 component indexes; information includes 12 component indexes; government includes 11 component indexes; and enterprise includes 12 component indexes. Technology index contains a total of 49 component indexes .
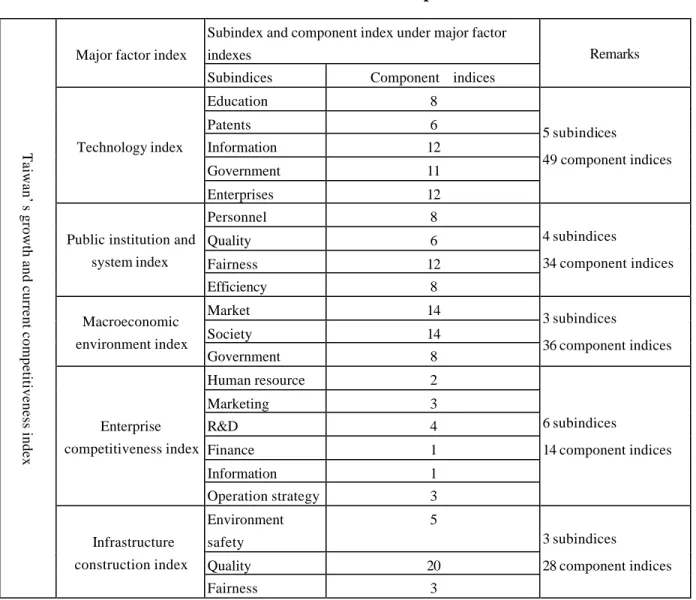
The statistic value of technology index and all of its subindexes is obtained based on its component index statistics. Analysis results show that average value of assessment on technology index is 5.2023. This indicates that the technology competitiveness under Taiwan’s growth and current competitiveness is Ordinary. For the statistics, please see Table 8.
Table 8 Technology Index Statistics
Number Valid cases
Missing cases
Mean
Median
Mode
Standard Deviation
Minimum Value
Maximum Value
Percentile 25
50
75
24
5
5.2023
5.2803
3.53a
.82233
3.53
6.7
4.8890
5.2803
5.4867
a. contains several modes, and the value shown here is the min.
2. Quantitative Analysis Results of Subindices
under Technology Index
Education under technology index is evaluated at 5.7545 on average, which suggests education competitiveness higher. Patent is evaluated at 5.0494 on average, which suggests its competitiveness
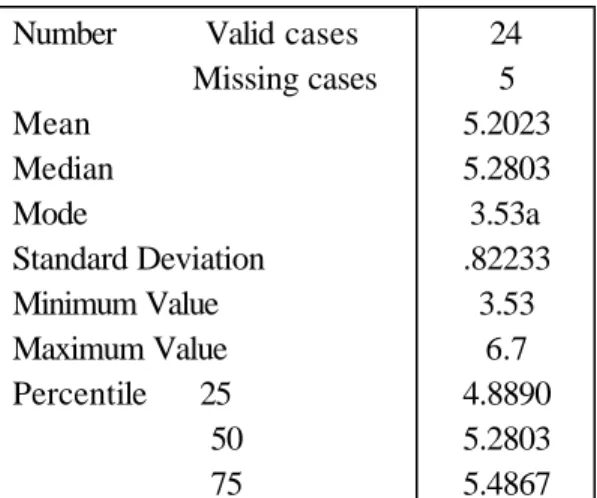
Ordinary. Information is evaluated at 5.7619 on average, which suggests its competitiveness higher. Government is evaluated at 4.6477 on average, which suggests its competitiveness Ordinary. Enterprise is evaluated at 4.4483 on average, which suggests its competitiveness lower. For statistics, please see Table 9, Table 10, Table 11, Table 12 , Table 13 , and Fig.2.
Table 9 Technology Index--- Education Subindex Statistics
Number Valid cases
Missing cases
Mean
Median
Standard Deviation
Percentile 25
50
75
28
1
5.7545
5.6875
.95409
5.1563
5.6875
6.0938
Table 10 Technology Inde x— Patent Subindex Statistics
Number Valid cases
Missing cases
Mean
Median
Standard Deviation
Percentile 25
50
75
27
2
5.0494
5.1667
1.22894
4.3333
5.1667
5.6667
Table 11 Technology Index— Information Subindex Statistics
Number Valid cases
Missing cases
Mean
Median
Standard Deviation
Percentile 25
50
75
28
1
5.7619
5.7500
.71604
5.2500
5.7500
6.1667
Table 12 Technology Index— Government Subindex Statistics
Number Valid cases
Missing cases
Mean
Median
Standard Deviation
Percentile 25
50
75
28
1
4.6477
4.7727
.89309
4.2045
4.7727
5.0682
Table 13 Technology Index— Enterprise Subindex Statistics
Number Valid cases
Missing cases
Mean
Median
Standard Deviation
Percentile 25
50
75
29
0
4.4483
4.4167
.78535
3.9583
4.4167
4.9583
Fig.2 Subindexes Statistics under Technology Index
5.7545
5.0494
5.7619
4.6477
4.4483
0
1
2
3
4
5
6
7
8
9
10
Education Subndex
Patent Subindex
Information Subindex
Government Subindex
Enterprise Subindex
Since the aggregate average of 5 subindexes is 5.2023, we can see that in technology index, Taiwan’s growth and current competitiveness was adversely affected by the subindexes of patent, government and enterprise.
3. Quantitative Analysis Results of Component
Indices under Technology Index
Please see Table 14, Fig.3 to Fig.7. Competitiveness assessment is measured by the average, with median and Mode as the reference value.
Table 14 Component Indices Statistics under Technology Index
Title Index Average Assessment Median Assessment Mode Assessment 1. Education sub-index
1 Secondary education
schooling 7.362
Higher toward
very high 8 Very high 8 Very high 2
Vocational Technological education quality
5.845 Higher 6 Higher 6 Higher
3 Higher education
enrollment 5.603 Higher 6 Higher 6 Higher
4 Higher education
popularity 5.983 Higher 6 Higher 6 Higher
5 University/industry
research collaboration 4.964 Ordinary 5 Ordinary 5 Ordinary 6
Educational policy favorable for S&T
development
5.017 Ordinary 5 Ordinary 5 Ordinary 7 Interest of young
students in S&T 6.196 Higher 6 Higher 6 Higher 8
Basic research favorable for long-term economic development
2. Patent subindex
9 Patent right protection 3.914 Lower 4 Lower 4 Lower 10 Domestic patent right 4.155 Lower 4 Lower 5 Ordinary 11 Patent acquisition 5.339 Ordinary 6 Higher 6 Higher 12
Overall ranking of number of international
patents
5.946 Higher 6 Higher 6 Higher
13
Average ranking of international patent
rights
6.259 Higher 7 Higher toward very high 7
Higher toward very high 14 Technological
sophistication 4.589 Ordinary 5 Ordinary 6 Higher 3. Information subindex
15 International phone
cost 3.983 Lower 4 Lower 3
Lower toward very low 16 Indoor telecommunication popularity 7.190 Higher toward
very high 8 Very high 8 Very high 17 Mobile communication 8.328 Very high 8 Very high 8 Very high 18 Internet access 5.845 Higher 6 Higher 5 Ordinary 19 Broad band utilization 5.534 Higher 5 Ordinary 5 Ordinary 20 Website proportion 5.125 Ordinary 5 Ordinary 5 Ordinary 21 Internet access in
schools 6.293 Higher 6 Slightly high 6 Higher 22 Broad band networking
cost 6.259 Higher 6 Higher 6 Higher
23 Quality of competition
in ISP sector 4.052 Lower 4 Lower 4 Lower
24 PC popularity 5.707 Higher 6 Higher 5 Ordinary
25 ICT standardization 5.500 Higher 5 Ordinary 5 Ordinary 26 ICT internationalization 5.500 Higher 6 Higher 6 Higher 4. Government subindex 27 Overall expenditures on R&D 3.362 Lower towards very low 3 Lower towards very low 2 Very low 28 Rent and tax
preferential treatment 4.948 Ordinary 5 Ordinary 5 Ordinary 29 Industrial water cost 4.672 Ordinary 5 Ordinary 5 Ordinary 30 Industrial electricity
cost 4.741 Ordinary 5 Ordinary 5 Ordinary
31 Domestic R&D
manpower 3.603 Lower 4 Lower 4 Lower
32 R&D manpower
growth 4.017 Lower 4 Lower 5 Ordinary
33 R&D expenditure
growth 3.741 Lower 4 Lower 4 Lower
34 Laws relating to ICT
use 3.983 Lower 4 Lower 4 Lower
35 Government
Prioritization of ICT 6.411 Higher 6 Higher 6 Higher 36
Production and technological
development Prioritization
6.362 Higher 6 Higher 6 Higher
37 International
competition 4.914 Ordinary 5 Ordinary 5 Ordinary 5. Enterprise Subindex
38 Enterprise R&D
reseachers 5.017 Ordinary 5 Ordinary 6 Higher 39 Company spending on research and development 3.534 Lower 3 Lower towards very low 2 Very low 40 R&D expenditure
percentage 3.603 Lower 4 Lower 4 Lower
41 Number of R&D
personnel 4.121 Lower 4 Lower 5 Ordinary
42 Financial resources 3.984 Lower 4 Lower 4 Lower 43 Technical cooperation
between enterprises 4.397 Lower 4 Lower 4 Lower 44 R&D growth 4.534 Ordinary 5 Ordinary 5 Ordinary 45 Increased R&D
expenditure 4.224 Lower 4 Lower 4 Lower
46 Firm-level innovation 5.362 Ordinary 6 Higher 6 Higher 47
Gap between enterprise circle and advanced
countries in R&D expenditure
6.224 Higher 6 Higher 6 Higher
48 Internet services 4.328 Lower 4 Lower 4 Lower
49 Training of technical
talents 4.086 Lower 4 Lower 4 Lower
Fig.3 Component Indices Statistics under Education Subindex
7.362
5.845
5.603
5.983
4.964
5.017
6.196
4.948
0
1
2
3
4
5
6
7
8
9 10
Secondary Education Schooling Vocational Technical Education Quality Higher Education Enrolling Higher Education Popularity University/Industry Research Collaboration Educational Policy Favourable for Technical
Development
Interest of Young Students in S&T Basic Research Favorable for Long-Term
Economic Development
The average of education subindexes is 5.7545, which suggests higher competitiveness. Of the subindex, higher education enrollment, enterprise/school collaboration, educational policies favorable for the technological development and the
basic research favorable for long-term economic development are below the average, while the secondary education schooling, vocational technical education quality, higher education popularity and the interest of young students in science and technology are
higher than the average.
Fig.4 Component Indices Statistics under Patent Subindex
3.914
4.155
5.339
5.946
6.259
4.589
0
1
2
3
4
5
6
7
8
9 10
Patent Right Protection
Domestic Patent Right
Patent Acquisition
Ranking of International Patent
Numbers
Average Ranking of International
Patents
Technological Sophistication
The average of patent subindex is 5.0494, which suggests Ordinary competitiveness. Of the subindex, patent right protection, domestic patent right and national technological level are below the average,
while patent acquisition, the ranking of international patent numbers and the average ranking of international patent right are higher than the average.
3.983
7.19
8.328
5.845
5.534
5.125
6.293
6.259
4.052
5.707
5.5
5.5
0
1
2
3
4
5
6
7
8
9
10
International Phone Cost Indoor Telecommunication Popularity Mobile Communication Internet Access Broad Band Utilization Website Proportion Internet Access in Schools Broad Band Netoworking Cost Quality of Competition in ISP Sector PC Popularity ICT Standardization ICT Internationlization
The average of information subindex is 5.7619, which suggests higher competitiveness. Of them, International telephone cost, broad band utilization, website proportion, ISP level, personal computer popularity, ICT standardization and ICT
internationalization are below the average, while indoor telecommunication popularity, mobile communication popularity, internet access popularity, internet access at school and broad band networking cost are higher than the average.
Fig.6 Component Index Statistics under Government Subindex
3.362
4.948
4.672
4.741
3.603
4.017
3.741
3.983
6.411
6.362
4.914
0
1
2
3
4
5
6
7
8
9 10
Overall Expenditure on R&D Rent and Tax Preferential Treatment Industrial Water Cost Endustrial Electricity Cost Domestic R&D Personnel R&D Manpower Growth R&D Expenditure Cost Laws Relating to ICT Use Government Prioritization of ICT Product and Technology Development Priority International Competition
The average of government subindex is 4.6477, which suggests Ordinary competitiveness. Of the subindex, overall expenditure on R&D, domestic R&D manpower, R&D manpower growth, increased R&D expenditure and governmental decrees to protect technological research and development are below the
average, while rent tax preference, industrial water cost, industrial power cost, information development prioritization, production and technological development prioritization and international competition are higher than the average.
Fig.7 Component Index Statistics under Enterprise subindex
5.017
3.534
3.603
4.121
3.984
4.397
4.534
4.224
5.362
6.224
4.328
4.086
0
1
2
3
4
5
6
7
8
9
10
Enterprise R&D Reseachers Company Spending on Research and Development R&D Expenditure Percentage Number of R&D Personnel
Financial Resources Technical Cooperation between Enterprises R&D Growth Increased R&D Expenditure Firm-Level Innovation Gap between Enterprise Circle and Advanced Countries in
R&D Expenditure
Internet Services Training of Technical Talents
The average of enterprise subindex is 4.4483, which suggests lower competitiveness. Enterprise expenditure on R&D, R&D expenditure percentage, the number of enterprise R&D personnel, enterprise financial resources, technological cooperation between enterprises, increased enterprise R&D expenditure, enterprise networking services and the chances for the
enterprise to train technicians are below the average, while R&D excellent talents, enterprise R&D growth, enterprise innovation activities and the gap between enterprise circles and advanced nations in R&D expenditures are higher than the average.
Assessment
1. Quantitative Analysis Results for Public
Institutions and System Index
Public institutions and system index is composed of 4 subindexes, namely, personnel, quality, fairness, and efficiency. Of the subindexes, personnel contains 8 component indices, quality 6 component indices, fairness 12 component indices and efficiency 8
component indices. The component indices total 34. The value of public institution and system index and all its subindex are based on their component index statistics. Analysis results show that public institution and system index is evaluated at 4.3500. This indicates that public institution and system competit iveness under Taiwan’s growth and current competitiveness is rated as lower. For its statistics, please see Table 15
H.
Table 15 Public Institutions and System Index Statistics
Number Valid cases
Missing cases
Mean
Median
Mode
Standard Deviation
Minimum Value
Maximum Value
Percentile 25
50
75
25
2
4.3500
4.2813
4.05
.58102
2.83
5.56
4.0417
4.2813
4.7708
2. Subindex Quantitative Analysis Results
under Public Institution and System
Index
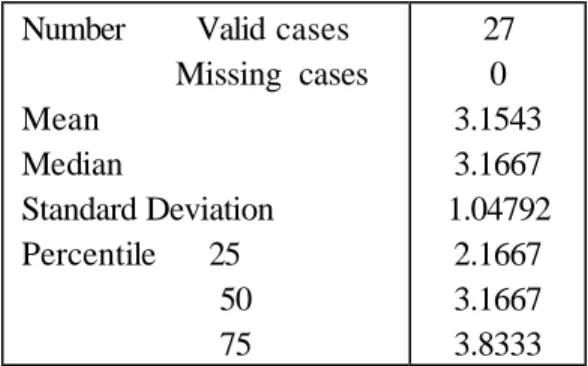
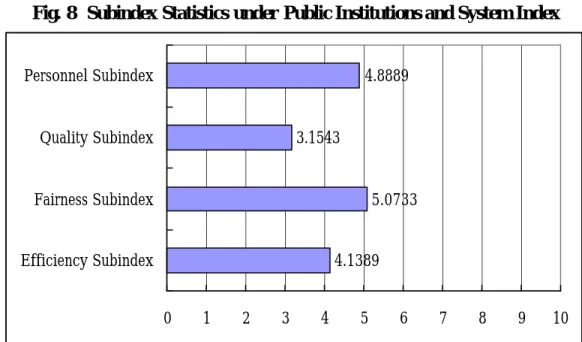
In Public institutions and system index, the evaluation value of personnel subindex is 4.8889, which suggests Ordinary competitiveness. The evaluation value of quality subindex is 3.1543, which
suggests its competitiveness lower towards very low. The evaluation value of fairness subindex is 5.0733,which suggests Ordinary competitiveness. The evaluation value of efficiency subindex is 4.1389,which suggests lower competitiveness. For statistics, please see Table 16, Table 17, Table 18, Table 19, as well as Fig. 8.
Table 16 Public Institutions and System Index- Personnel Subindex Statistics
Number Valid cases
Missing cases
Mean
Median
Standard Deviation
Percentile 25
50
75
27
0
4.8889
4.8750
.86764
4.1250
4.8750
5.3750
Table 17 Public Institutions and System Index – Quality Subindex Statistics
Number Valid cases
Missing cases
Mean
Median
Standard Deviation
Percentile 25
50
75
27
0
3.1543
3.1667
1.04792
2.1667
3.1667
3.8333
Table 18 Public Institutions and System Index – Fairness Subindex Statistics
Number Valid cases
Missing cases
Mean
Median
Standard Deviation
Percentile 25
50
75
25
2
5.0733
5.0833
1.02213
4.7083
5.0833
5.5417
Table 19 Public Institution and System Index – Efficiency subindex Statistics
Number Valid cases
Missing cases
Mean
Median
Standard Deviation
Percentile 25
50
75
27
0
4.1389
4.2500
.63580
3.7500
4.2500
4.6250
Fig. 8 Subindex Statistics under Public Institutions and System Index
4.8889
3.1543
5.0733
4.1389
0
1
2
3
4
5
6
7
8
9
10
Personnel Subindex
Quality Subindex
Fairness Subindex
Efficiency Subindex
The average of public institutions and system subindexes is 4.35. It is obvious that in public institutions and system, the efficiency and quality are below the average.
3. Quantitative Analysis Results of Component
Indices under Public Institution and System
Index
Please see Table 20, and Fig.9 to Fig.12. The competitiveness assessment is measured by the average, with median and mode as the reference values.
Table 20 Component Index Statistics under Public Institution and System Index
Title Index Average Assessment Median Assessment Mode Assessment
1.Personnel subindex
1 Public confidence 2.037 Very low 2 Very low 2 Very low 2 Ability of public
servants 4.944 Ordinary 5 Ordinary 4 Lower 3 Performance merit
fairness 4.870 Ordinary 5 Ordinary 4 Lower 4 Employment rules 5.889 Higher 6 Higher 6 Higher 5 Employment fairness 5.407 Ordinary 6 Higher 6 Higher 6 Promotion fairness 4.889 Ordinary 5 Ordinary 5 Ordinary 7 Reasonable retirement 5.333 Ordinary 6 Higher 6 Higher 8 Reasonable allowances 5.741 Higher 6 Higher 5 Ordinary
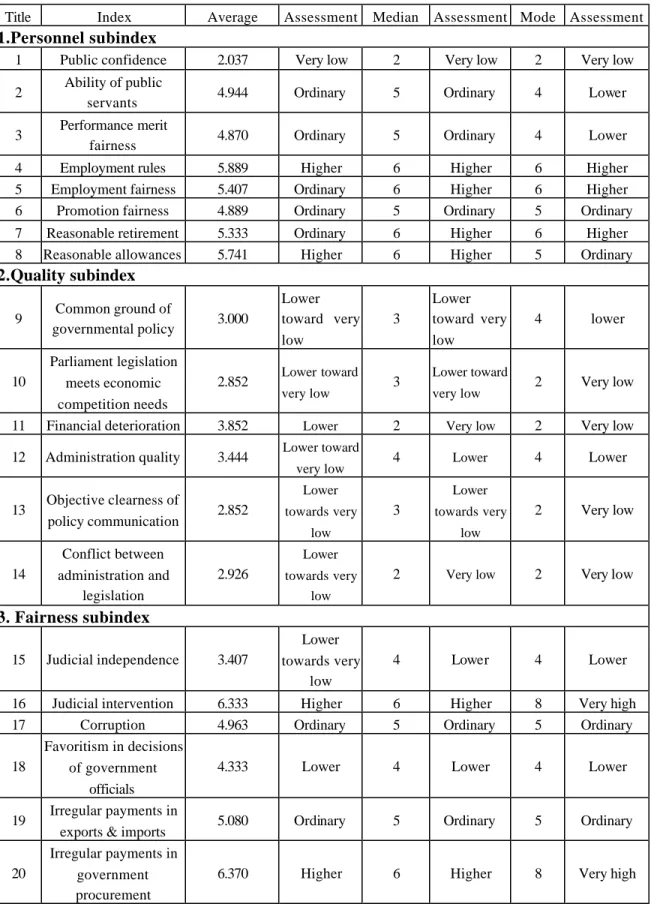
2.Quality subindex
9 Common ground of governmental policy 3.000 Lower toward very low 3 Lower toward very low 4 lower 10 Parliament legislation meets economic competition needs 2.852 Lower toward very low 3 Lower towardvery low 2 Very low
11 Financial deterioration 3.852 Lower 2 Very low 2 Very low 12 Administration quality 3.444 Lower toward
very low 4 Lower 4 Lower
13 Objective clearness of policy communication 2.852 Lower towards very low 3 Lower towards very low 2 Very low 14 Conflict between administration and legislation 2.926 Lower towards very low
2 Very low 2 Very low
3. Fairness subindex
15 Judicial independence 3.407 Lower towards very low 4 Lower 4 Lower16 Judicial intervention 6.333 Higher 6 Higher 8 Very high 17 Corruption 4.963 Ordinary 5 Ordinary 5 Ordinary 18
Favoritism in decisions of government
officials
4.333 Lower 4 Lower 4 Lower
19 Irregular payments in
exports & imports 5.080 Ordinary 5 Ordinary 5 Ordinary 20
Irregular payments in government procurement
21 Irregular payments in
tax collection 5.778 Higher 6 Higher 6 Higher 22 Government
procurement fairness 4.370 Lower 4 Lower 4 Lower 23 Election fairness 5.889 Higher 6 Higher 4 Lower 24 Government support
for fair trade 5.000 Ordinary 5 Ordinary 5 Ordinary 25 Government service
fairness 5.630 Higher 5 Ordinary 5 Ordinary 26 Policy transparency 3.889 Lower 4 Lower 4 Lower
4.Efficiency subinde x
27 Complicated Redtape operation 3.481 Lower towards very low 4 Lower 4 Lower28 Public services cost 3.815 Lower 4 Lower 4 Lower 29 Government adaptability to economic challenge 3.074 Lower towards very low 3 Lower towards very low 2 Very low 30 Government fiscal stability 3.370 Lower towards very low 3 Lower towards very low 2 Very low 31 Public institution
efficiency 4.796 Ordinary 5 Ordinary 5 Ordinary 32 Policy implementation
efficiency 4.296 Lower 4 Lower 4 Lower
33 Facilitation of
government service 5.444 Ordinary 5 Ordinary 5 Ordinary 34
Ease of access to government
information
Fig.9 Component Index Statistics under Personnel Subindex
2.037
4.944
4.87
5.889
5.407
4.889
5.333
5.741
0
1
2
3
4
5
6
7
8
9
10
Public Confidence
Ability of Public Servants
Performance Merit Fairness
Employment Rules
Employment Fairness
Promotion Fairness
Reasonable Retirement
Reasonable Allowances
The average of personnel subindexes is 4.8889, which suggests Ordinary competitiveness. Of them, the public confidence and performance merit fairness are below the average, and promotion fairness is equal to
the average, while the ability of public servants , permanent employment system, employment fairness, promotion fairness, reasonable retirement and reasonable allowance are higher than average.
Fig. 10 Component indexes statistics under Quality Subindex
3
2.852
3.852
3.444
2.852
2.926
0 1 2 3 4 5 6 7 8 9 10
Common Ground of Governmental
Ppolicy
Parliament Legislation Meets Economic
Compeitition Needs
Financial Deterioration
Administration Quality
Objective Clearness of Policy
Communication
Conflict between Administration and
Legislation
The average of quality subindex is 3.1543, which suggests lower towards very low competitiveness. Of the subindexes, the common ground of governmental policy, legislation meets the needs of economic competition, objective clearness of policy
communication and conflict between ad ministration and legislation are below the average, while financial deterioration and administration quality are higher than the average.
Fig.11 Component Index Statistics under Fairness Subindex
3.407
6.333
4.963
4.333
5.08
6.37
5.778
4.37
5.889
5
5.63
3.889
0 1 2 3 4 5 6 7 8 9 10
Judicial Independence
Judicial Intervention
Corruption
Favoritism in Decisions of Government Officials
Irregular Payments in Exports & Imports
Irregular Payments in Government Procurement
Irregular Payments in Tax Collection
Government Procurement Fairness
Election Fairness
Government Support for Fair Trade
Government Services Fairness
Policy Transparency
The average of fairness subindex is 5.0733, which suggests Ordinary competitiveness. Of the index, judicial independence, corruption, election fairness, governmental procurement fairness, governmental support for fair trade and policy transparency are below the average, while governmental intervention in judicial
system, irregular payment for issuing output license, irregular payment for application for water and electricity, irregular payment for tax collection, election fairness and governmental services fairness are higher than average.
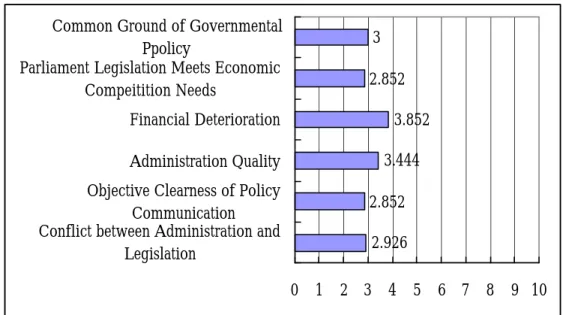
Fig. 12 Component Index under Efficiency Subindex
3.481
3.815
3.074
3.37
4.796
4.296
5.444
4.833
0
1
2
3
4
5
6
7
8
9 10
Complicated Red Tape Operation
Public Services Cost
Government Adaptability to Econonomic
Challenge
Government Fiscal Stability
Public Institution Efficiency
Policy Implementation Efficiency
Facilitation of Government Service
Ease of Access to Government Information
The average of efficiency subindexes is 4.1389, which suggests lower competitiveness. Of them, the complicated red tape operation, the cost of official duty, the ability of government meeting economical challenge and financial stability are below the average, while public institution efficiency, policy implementation efficiency, facilitation of government services and ease of access to government information are higher than the average.
Ⅳ. Macroeconomic Index Assessment
1. Macroeconomic Environment Index Analysis
Results
Macroeconomic environment index is divided into
three subindexes, namely, market, society and government. Of them, market subindex contains 14 component indices, society 14 component indices and Government 8 component indices. Component indices total 36.
The values for macroeconomic environment index and all of its subindices are based on its component indices statistics. The analysis results show that macroeconomic environment index is evaluated at 4.2738. This indicates that in Taiwan’s growth and current competitiveness, the competitiveness for the macroeconomic environment is rated as lower. For statistics, please see Table 21.
Table 21 Macroeconomic Environment Index Statistics
Number Valid cases
Missing cases
Mean
Median
Mode
Standard Deviation
Minimum Value
Maximum Value
Percentile 25
50
75
27
2
4.2738
4.4107
4.23a
.54839
2.99
5.05
4.0952
4.4107
4.5357
a contains several modes, and the value shown here is the min.
2. Subindices Analysis Results under
Macroeconomic Environment Index
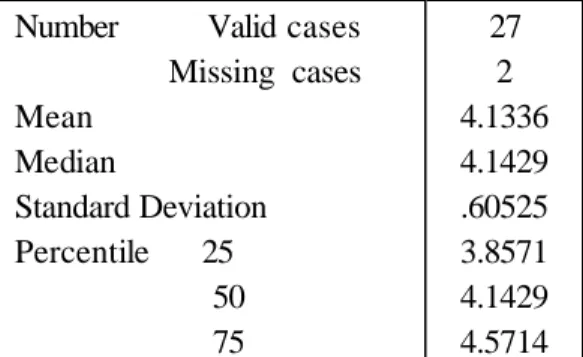
In macroeconomic environmental index, market subindex is evaluated at 4.1336, which indicates lower market competitiveness. Society subindex is evaluated
at 5.1342, which indicates Ordinary social competitiveness. Government subindex is evaluated at 3.5388, which indicates lower governmental competitiveness. For analysis statistics, please see Table 22, Table 23, Table 24 and Fig.13 .
Table 22 Macroeconomic Environment Index--- Market Subindex Statistics
Number Valid cases
Missing cases
Mean
Median
Standard Deviation
Percentile 25
50
75
27
2
4.1336
4.1429
.60525
3.8571
4.1429
4.5714
Table 23 Macroeconomic Environment Index--- Society Subindex Statistics
Number Valid cases
Missing cases
Mean
Median
Standard Deviation
Percentile 25
50
75
29
0
5.1342
5.1429
.72414
4.7143
5.1429
5.6071
Table 24 Macroeconomic Environment Index---Government Subindex Statistics
Number Valid cases
Missing cases
Mean
Median
Standard Deviation
Percentile 25
50
75
29
0
3.5388
3.6250
.65814
3.1250
3.6250
3.9375
Fig. 13 Subindices Statistics under Macroeconomic Environment Index
4.1336
5.1342
3.5388
0
1
2
3
4
5
6
7
8
9
10
Market Subindex
Society Subindex
Government Subindex
The average of macroeconomic environment subindices is 4.2738. It is obvious that in macroeconomic environment, government and market subindices are below average. Of them, government is the most unfavorable factor.
3. Component Indices Analysis Results of
Macroeconomic Environment Index
Please see Table 25, Fig.14 to Fig.16. (The competitiveness assessment is measured by the average, with the median and mode as the reference values.)
Table 25 Component Indices Statistics under Macroeconomic Environment Index
Title Index Average Assessment Median Assessment Mode Assessment 1. Market Subindex
1 Exchange rate
fluctuation 4.776 Ordinary 5 Ordinary 5 Ordinary 2 Exchange rate
subsidy 4.648 Ordinary 5 Ordinary 5 Ordinary 3 Financial market
openness 4.621 Ordinary 5 Ordinary 4 Lower
4 Soundness of insurance
practices
4.017 Lower 4 Lower 4 Lower
5 Soundness of
bond markets 3.983 Lower 4 Lower 4 Lower
6 Stock interval transaction 2.552 Lower towards very low 3 Lower towards very low 3 Lower towards very low 7 Access to credit 4.586 Ordinary 4 Lower 4 Lower 8 Attracting foreign
capital 4.155 Lower 4 Lower 4 Lower
9 Ease of FDI 4.534 Ordinary 4 Lower 4 Lower
10
Government intervention in
market
3.879 Lower 4 Lower 4 Lower
11 Soundness of banks 3.103 Lower towards very low 3 Lower towards very low 3 Lower towards very low 12 International call
cost 4.483 Lower 5 Ordinary 5 Ordinary
13 Industrial water 3.793 Lower 4 Lower 3 Lower towards very low 14 Industrial
electricity 4.793 Ordinary 5 Ordinary 4 Lower 2. Society Index
15 Living cost 3.931 Lower 4 Lower 5 Ordinary
16 Manpower
utilization 3.966 Lower 4 Lower 5 Ordinary
17 Unemployment rate 3.103 Lower towards very low 3 Lower towards very low 3 Lower towards very low 18 Well-educated people emigrate abroad
19 Running water
drinking 2.000 Very lower 2 Very lower 2 Very lower
20 Living quality 3.690 Lower 4 Lower 4 Lower
21 Inflation 5.414 Ordinary 5 Ordinary 5 Ordinary
22 Higher education
enrollment 6.586
Higher toward
very high 6 Higher 6 Higher
23 Weight on
technical courses 6.397 Higher 7
Higher toward
very high 6 Higher 24
Loss res ulting from labor
disputes
5.052 Ordinary 5 Ordinary 5 Ordinary
25 Mobile phone
subscribers 8.466 Very high 9
Very high towards extremely high 9 Very high towards extremely high 26
Social value for hardworking and
innovation
6.379 Higher 6 Higher 6 Higher
27 Adaptability to
challenge 6.103 Higher 6 Higher 6 Higher
28 Bank saving rate 5.931 Higher 6 Higher 6 Higher 3. Government subindex
29 Governmental
subsidy 3.845 Lower 4 Lower 4 Lower
30 Legislation activities meet economic competition 2.603 Lower towards
very low 2 Very low 2 Very low
31 Government fiscal
management 2.586
Lower towards very low 3
Lower towards
very low 2 Very low 32 Recession
expectations 2.448 Very low 2 Very low 2 Very low 33 Stable monetary
rules 3.414
Lower towards
very low 4 Very low 4 Very low
34
Environment laws obstruct enterprise
development
4.724 Ordinary 5 Ordinary 5 Ordinary
35 Tax percentage in
GDP 4.172 Very low 4 Very low 4 Very low
36
Rent and tax incentives
attracting investment
Fig. 14 Component Indices Statistics under Market Subindex
4.776
4.648
4.621
4.017
3.983
2.552
4.586
4.155
4.534
3.879
3.103
4.483
3.793
4.793
0 1 2 3 4 5 6 7 8 9 10
Exchange rate fluctuation
Exchange rate subsidy
Financial Market openness
Soundess of Insurance practices
Soundness of bond markets
Stock Interal Transaction
Access to credit
Attracting foreign capital
Ease of FDI
Government intervention in Market
Soundness of banks
International call cost
Industrial water
Industrial electricity
The average of market subindexes is 4.1336, which suggests lower competitiveness. Of the subindexes, soundness of insurance practices, soundness of bond market, the internal transaction of stocks, government intervention in market, soundness of banks and industrial water are below average, while
exchange rate fluctuation, exchange rate subsidies, monetary market openness, ease of access to loan, attracting foreign capital, the ease of foreign direct investment, international telephone cost and industrial electricity are higher than average.
Fig.15 Component Indices Statistics under Society Subindex
3.931
3.966
3.103
4.862
2
3.69
5.414
6.586
6.397
5.052
8.466
6.379
6.103
5.931
0 1 2 3 4 5 6 7 8 9 10
Living Cost
Manpower Utilization
Unemployment Rate
Well-educated People Emigrate abroad
Running Water Drinking
Living Quality
Inflation
Higher Education Enrollment
Weight on Technical Courses
Loss Resulting from Labor Disputes
Mobile Phone Subscribers
Social Value for Hardworking and Innovation
Adaptability to Challenge
Bank Savings Rate
The average of s ociety subindices is 5.1342, which suggests Ordinary competitiveness. Of them, living cost, manpower utilization, unemployment rate, well-educated people emigrate abroad, running water drinking, life quality and loss resulting from labor
disputes are below average, while inflation, higher education enrollment, weight on scientific courses, mobile telephone subscribers, social value by hardworking and innovation and savings rate are higher than average.
Fig.16 Component Indices Statistics under Government Subindex
3.845
2.603
2.586
2.448
3.414
4.724
4.172
4.517
0 1
2 3
4 5
6 7
8 9 10
Governmental Subsidy
Legislation Actitivities Meet Economic
Competition
Government Fiscal Management
Recession Expectations
Stable Monetary Rules
Environment Laws Obstruct Enterprise
Development
Tax Percentage in GDP
Rent and Tax Incentives Attracting Investment
The average of government subindexes is 3.5388, which suggests lower competitiveness. Of the subindex, the legislative activities meet economic competitive needs, government fiscal management, government ability in economic challenge and stable financial laws are below average, while government subsidies, environmental protection regulations obstruct enterprise development, tax percentage in GDP and rent and tax incentives attracting investment are higher than average.
Ⅴ. Enterprise Competitiveness Index
Assessment
1. Quantitative Analysis Results of Enterprise
Competitiveness Index
The enterprise competitiveness index is divided into 6 subindices, namely, human resource, marketing, R&D, finance, information and operation strategy. Of them, human resource contains 2 component indices; R&D, 4 component indices; finance 1 component index; information, 1 component index; operation strategy, 3 component indices and marketing, 3 component indices . There are altogether 14 component indices.
The value of the enterprise competitiveness index and all its subindices are based on their component indices statistics. The analysis results show that the evaluation value of the enterprise competitiveness index is 6.0456. This indicates that in Taiwan’s growth and current competitiveness, the enterprise is rated as higher. For its statistics, please see Table 26.
Table 26 Enterprise Competitiveness Index Statistics
Number Valid cases
Missing cases
Mean
Median
Mode
Standard Deviation
Minimum Value
Maximum Value
Percentile 25
50
75
30
0
6.0456
6.0625
4.11a
.70920
4.11
8.04
5.6215
6.0625
6.5069
a. contains several modes, and the value shown here is the min.
2. Subindex Quantitative Analysis Results
under Enterprise Competitiveness Index
The human resource subindex in the enterprise competitiveness index is evaluated at 6.1167, which suggests higher competitiveness. The marketing is evaluated at 6.8889, which rates its competitiveness as higher toward very high. R&D is evaluated at 6.1292,
which suggests R&D competitiveness higher. Finance is evaluated at 4.8500, which suggests Ordinary competitiveness. Information is evaluated at 6.1167, which suggests higher competitiveness. Operation strategy is evaluated at 6.1722, which suggests higher competitiveness. For statistics, please refer to Table 27, Table 28, Table 29, Table 30, Table 31, Table 32 and Fig. 17.
Table 27 Enterprise Competitiveness Index--- Human Resource Subindex Statistics
Number Valid cases
Missing cases
Mean
Median
Standard Deviation
Percentile 25
50
75
30
0
6.1167
6.5000
1.14232
5.5000
6.5000
6.5000
Table 28 Enterprise Competitiveness Index — Marketing Subindex Statistics
Number Valid cases
Missing cases
Mean
Median
Standard Deviation
Percentile 25
50
75
30
0
6.8889
7.0000
.95926
6.3333
7.0000
7.6667
Table 29 Enterprise Competitiveness Index — R&D Subindex Statistics
Number Valid cases
Missing cases
Mean
Median
Standard Deviation
Percentile 25
50
75
30
0
6.1296
6.1875
.78406
5.7500
6.1875
6.5000
Table 30 Enterprise Competiveness Index --- Finance Subindex Statistics
Number Valid cases
Missing cases
Mean
Median
Standard Deviation
Percentile 25
50
75
30
0
4.8500
5.0000
1.40902
4.0000
5.0000
6.0000
Table 31 Enterprise Competitiveness— Information Subindex Statistics
Number Valid cases
Missing cases
Mean
Median
Standard Deviation
Percentile 25
50
75
30
0
6.1167
6.0000
1.57394
5.0000
6.0000
7.0000
Table 32 Enterprise Competitiveness Index -- Operation Strategy Subindex Statistics
Number Valid cases
Missing cases
Mean
Median
Standard Deviation
Percentile 25
50
75
30
0
6.1722
6.3333
1.05089
5.6667
6.3333
6.6667
Fig.17 Subindex Statistics under Enterprise Competitiveness Index
6.1167
6.8889
6.1292
4.85
6.1167
6.1722
0
1
2
3
4
5
6
7
8
9
10
Human Resource Subindex
Marketing Subindex
R&D Subindex
Finance Subindex
Information Subindex
Operation Strategy SubIndex
The average of enterprise competitiveness subindices is 6.0456. It is obvious that in enterprise competitiveness, enterprise finance subindex is below the average. That is to say, the enteprise finance performs poorly.
3. Quantitative Analysis Results of Component
Indices under Enterprise Competitiveness
Index
Please refer to Table 33 and Fig.18. Competitiveness evaluation is measured by the average, with median and mode as the reference values.
Table 33 Enterprise Competitiveness Subindices Statistics
Title Index Average Assessment Median Assessment Mode Assessment 1. Human resource subindex
1 Internal merit rules 6.983 Higher toward very high 7 Higher toward very high 7 Higher toward very high 2 Labor dispute 5.250 Ordinary 5 Ordinary 5 Ordinary 2. Marketing subindex
3 Meeting market
demands 7.550 Very high 8 Very high 8 Very high 4 Customer
satisfaction 7.250
Higher toward very
high
8 Very high 8 Very high 5 Market ability 5.867 Higher 6 Higher 6 Higher 3. R&D subindex
6 Innovation
capability 5.500
Higher
6 Higher 6 Higher
7 R&D capability 4.400 Lower 4 Lower 4 Lower 8 Manufacturing
capability 7.517 Very high 8 Very high 8 Very high 9 Production capacity 7.100 Higher toward very high 7.25 Higher toward very high 8 Very high 4. Finance subindex
10 Fiscal structure 4.850 Ordinary 5 Ordinary 5 Ordinary 5. Information subindex
11 Information
technology 6.117 Higher 6 Higher 6 Higher 6. Operation strategy subindex
12 Sense of Entrepreneurship 6.483 Higher 7 Higher toward very high 7 Higher toward very high 13 Common value
of executives 5.733 Higher 6 Higher 6 Higher 14 Operation
Fig.18 Component Indices Statistics under Enterprise Competitiveness Index
6.983
5.25
7.55
7.25
5.867
5.5
4.4
7.517
7.1
4.85
6.117
6.483
5.733
6.3
0
1
2
3
4
5
6
7
8
9 10
Internal Merit Rules
Labor Dispute
Meeting Market Demands
Customer Satisfaction
Market Ability
Innovation Capability
R&D Capability
Manufacturing Capability
Production Capacity
Fisical Structure
Information Technology
Sense of EntrepreneurShip
Common Value of Executives
Operation Strategy
The average of the enterprise competitiveness indexes is 6.0456, which suggests higher competitiveness. Of them, labor dispute, enterprise marketability, enterprise innovation capability, enterprise R&D capability, fiscal structure and the common value of enterprise executives are below the average, while internal merit rules, meeting market demands, customer satisfaction, manufacturing technology, production capability, information technology, the sense of entrepreneurship and operation
strategy are higher than average.
Ⅵ. Infrastructure Construction Index
Assessment
1. Infrastructure Construction Index Analysis
Results
Infrastructure construction index is divided into 3 subindices, namely, environmental safety, quality and fairness. Of the subindices, environmental safety
subindex lists 5 component indices, 20 component indices for quality, and 3 component indices for fairness. The component indices total 28.
The values for infrastructure construction index and all of its subindices are based on the component indices
statistics. Its analysis results show that infrastructure construction index is evaluated at 5.0028. This indicates that in Taiwan’s growth and current competitiveness, infrastructure construction competitiveness is rated as Ordinary. For statistics, please see Table 34.
Table 34 Infrastructure Construction Index Statistics
Number Valid cases
Missing cases
Mean
Median
Mode
Standard Deviation
Minimum Value
Maximum Value
Percentile 25
50
75
20
6
5.0028
5.1028
4.07
.49627
4.07
5.83
4.6569
5.1028
5.4139
2. Subindices Analysis Results under
Infrastructure Index
Under the Infrastructure construction index, environmental safety subindex is evaluated at 4.0320, which shows its competitiveness is lower. Quality
subindex is evaluated at 5.1548, which shows its competitiveness Ordinary. Fairness subindex is 5.7273, which shows that its competitiveness is higher. For statistics, please see Table 35, Table 36, Table 37 as well as Fig.19.