1
The Demography of Two Chinese Clans in
Hsiao-shan, Cheking, 1650-1850
Ts’ui-jung Liu*
This paper was first presented at a conference held August 20-25, 1978, at Wadham College, Oxford. The revised version was published in Susan B. Hanley and Arthur P. Wolf eds., Family and Population
in East Asian History (Stanford, California: Stanford University Press, 1985), pp. 13-61. (In this text,
Chinese characters are added, notes are rearranged under each page, and some figures are redrawn.)
In a previous study of genealogies from Taiwan, I found that despite certain defects Chinese genealogies can be made to yield data valuable to historical demography.1 In this paper, I shall investigate two genealogies from Hisao-shan (蕭 山) county in Chekiang on the China mainland with a view to seeing, among other things, how well they fit the Princeton group’s controversial reinterpretation of John Lossing Buck’s famous 1929-33 survey of Chinese farm families. In the Princeton group’s view, “The demographic picture that emerges is of a population with high mortality, low marital fertility, and a rate of increase little different from zero, characteristics that were of sufficient persistence to have generated a stable age distribution.”2 Do the data from Chinese genealogies support this picture of the demography of pre-modern China?
Source
The genealogies I employ are the Hsiao-shan Ch’ang-hsiang Shen-shih
tsung-p’u (蕭山長巷沈氏宗譜), published in 1893 by the Shen clan of Hsiao-shan,
and the Hsiao-shan T’ang-wan Ching-t’ing Hsü-shih tsung-p’u (蕭山塘灣井亭徐氏 宗譜), published in 1911 by the Hsü clan of Hsiao-shan. Both genealogies had been revised several times before these editions were published. The Shen genealogies was compiled in 1408 and revised in 1526, 1673, and 1841; the original Hsü genealogies covers eleven generations and was updated in 1789 by a member of the thirteenth generation. The information concerning later generations was probably added when new prefaces were appended in 1805, 1820, 1836, 1859, and 1911. The attention the two clans devoted to their genealogies suggests that they are exemplary products of rules governing their genre. To exploit them the demographer must discover what
*Research Fellow, Institute of Economics, Academia Sinica.
1
Ts’ui-jung Liu, “Chinese Genealogies as a Source for the study of Historical Demography,” Studies
and Essays in Commemoration of the Golden Jubliee of Academia Sinica (June 1978), pp. 849-870. 2
George W. Barclay, Ansley J. Coale, Michael A. Stoto, and T. James Trussell, “A Reassessment of the Demography of Traditional Rural China,” Population Index, 42.4 (1976): 625.
2
these rules were and how best to translate the data they provide.
The rules governing the treatment of males who died young are particularly important. In general, boys who died before reaching seven sui (歲) were neglected entirely, whereas those aged eight to 19 sui were entered in the genealogy classified as
hsia-shang (下殤), chung-shang (中殤), or chang-shang (長殤). In fact, however,
these particular genealogies do not always follow these rules. The Shen genealogy says that in the earlier generations males who died young were commonly thrown together under the label tsao-shih (早逝 “died young”) because the old records precluded greater precision, and the Hsü genealogy tells us that boys who died before reaching 15 sui were not entered at all unless they were married.3 All we can be certain of is that males who died as infants and small children were not given a place in their clan genealogy, and are therefore lost to the demographer as well as to the clan.
To estimate the fertility of the Shen and Hsü clans I have applied the family reconstitution procedures used in the analysis of parish records in Western Europe. Since this method requires linking children to their mothers, it is important to note that despite frequent male adoption and polygyny among the wealthy, Chinese genealogies do identify the mothers of most male (but not female) children. Instances of adoption are clearly noted because of the strong interest in descent, and the male offspring of polygynous families are usually linked with their own mothers.4 Problems arise only when the first of two or more wives fails to bear a male child. Under these conditions the male offspring of a concubine may be listed as the son of the first wife. Since concubines are only noted in a clan genealogy if they produce male descendants, the appearance of a concubine who has not borne a son may be taken as evidence of such a transfer. The woman has had to surrender her son to the first wife but has not lost her status as the mother of a clansman.
The format of the Shen and Hsü genealogies is simple. The names of the male members are listed generation by generation, and for each member the genealogy notes his birth and death dates and, if relevant, the names and dates of his wives, the number of sons borne by each wife, and the sons’ names. The number of daughters is sometimes noted but not consistently, and daughters’ names are never given. Unfortunately, many birth and death dates are missing because they were not known
3
Hsiao-shan Ch’ang-hsiang Shen-shih tsung-p’u (The genealogy of the Shen clan in Hsiao-shan), 1893 ed., ch. 40; Hsiao-shan T’ang-wan Ching-t’ing Hsü-shih tsung-p’u (The genealogy of the Hsü clan in Hsiao-shan), 1911 ed., ch. 1. Hereafter cited as Shen-shih and Hsü-shih.
4
Though clan rules urged members to adopt children from within the clan, exceptions did occur. Boys adopted from outside (ming-ling 螟蛉) were not listed individually in the genealogies, but their names were noted under the adopting father’s name. One way to avoid adopting from outside of the clan was to allow one boy to carry two lines of descent (chien-t’ao 兼祧). Instances of both practices are to be found in the Shen and Hsü genealogies; I have not tabulated frequency.
3
to the compilers, but we must not allow this to discourage us from exploiting these sources. Whatever their defects (and they are many), genealogies like those compiled by Shens and Hsüs are almost the only source we have for reconstructing China’s demographic history.
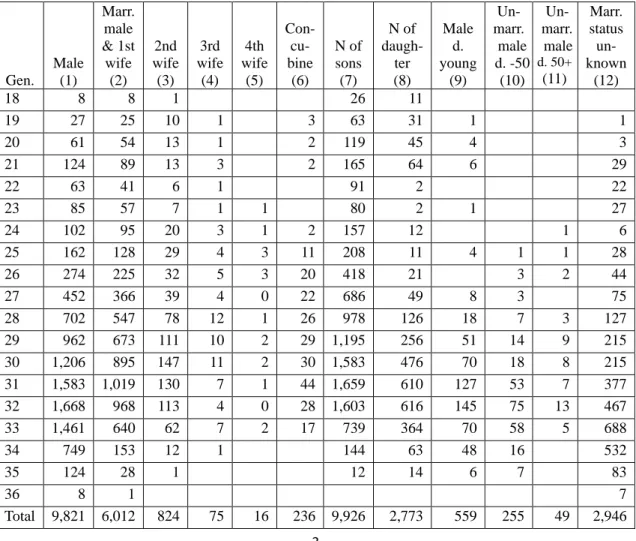
Table 1 describes the populations recorded in the Shen and Hsü genealogies. Both contain nineteen generations, the Shen compilation beginning with the eighteenth generation of the Shen descent line and the Hsü with the founding generation of the line. The earliest birth noted in the Shen genealogy is that of an eighteenth-generation member born in 1389; the earliest birth recorded in the Hsü genealogy is that of a fourth-generation member born in 1458. Columns 1 through 12 list by generation the number of males born, their wives and concubines (with wives classified by the order of the husband’s marriage), their sons and daughters, and the number of men who died young or unmarried or whose marital status is unknown. These are the major segments of the population that is the subject of the following analysis.
Table 1: Number of Members of Various Statuses Recorded in the Shen Genealogy (1893) and the Hsü Genealogy (1911)
Shen Gen. Male (1) Marr. male & 1st wife (2) 2nd wife (3) 3rd wife (4) 4th wife (5) Con- cu- bine (6) N of sons (7) N of daugh- ter (8) Male d. young (9) Un- marr. male d. -50 (10) Un- marr. male d. 50+ (11) Marr. status un- known (12) 18 8 8 1 26 11 19 27 25 10 1 3 63 31 1 1 20 61 54 13 1 2 119 45 4 3 21 124 89 13 3 2 165 64 6 29 22 63 41 6 1 91 2 22 23 85 57 7 1 1 80 2 1 27 24 102 95 20 3 1 2 157 12 1 6 25 162 128 29 4 3 11 208 11 4 1 1 28 26 274 225 32 5 3 20 418 21 3 2 44 27 452 366 39 4 0 22 686 49 8 3 75 28 702 547 78 12 1 26 978 126 18 7 3 127 29 962 673 111 10 2 29 1,195 256 51 14 9 215 30 1,206 895 147 11 2 30 1,583 476 70 18 8 215 31 1,583 1,019 130 7 1 44 1,659 610 127 53 7 377 32 1,668 968 113 4 0 28 1,603 616 145 75 13 467 33 1,461 640 62 7 2 17 739 364 70 58 5 688 34 749 153 12 1 144 63 48 16 532 35 124 28 1 12 14 6 7 83 36 8 1 7 Total 9,821 6,012 824 75 16 236 9,926 2,773 559 255 49 2,946
4 Table 1 (Continued) Hsü Gen. Male (1) Marr. male & 1st wife (2) 2nd wife (3) 3rd wife (4) 4th wife (5) Con- Cu- bine (6) N of sons (7) N of daugh- ter (8) Male d. young (9) Un- marr. male d. -50 (10) Un- marr. male d. 50+ (11) Marr. status un- known (12) 1 1 ? 2 1 1 2 3 2 2 5 4 5 4 3 1 10 1 5 10 9 2 1 34 1 6 39 38 6 1 83 1 7 77 70 12 3 152 1 1 6 8 129 115 10 2 1 1 209 6 8 9 186 164 20 5 3 310 9 8 14 10 300 271 28 1 3 491 44 8 1 20 11 478 403 59 3 6 641 136 18 21 15 21 12 602 480 71 5 7 773 249 25 60 29 8 13 738 562 87 11 3 15 815 380 10 80 18 68 14 789 532 58 5 1 12 749 365 20 92 10 135 15 740 426 34 1 2 597 239 18 55 4 273 16 577 255 22 4 305 108 1 25 2 294 17 302 82 8 1 5 90 44 5 215 18 89 11 5 3 3 75 19 5 5 Total 5,070 3,425 420 40 5 58 5,271 1,578 116 342 1,143
Though it might be rewarding to compare demography of the component parts of the Shen and Hsü clans (that is, the lineages and their branches), I have not attempted such a comparison in this paper. Moreover, the small numbers and inadequate data have forced me to confine my analysis to persons born between 1650 and 1849 with a birth date given: 4,115 males and 2,380 females from the Shen clan, and 2,965 males and 2,047 females from the Hsü clan. This amounts to approximately half the men and women named in the two genealogies. In the analysis that follows these people are organized into 40 five-year birth cohorts. I present the data in terms of birth cohorts rather than in terms of genealogical generations because generations overlap and thus distort temporal change.
Social Context
The Shen and Hsü clans have lived for centuries in Hsiao-shan, a county located southeast of Hangchow along the bank of the Ch’ien-t’ang (錢塘) River. It was during the Northern Sung dynasty that the first member of the Shen clan, a man
5
named Heng (衡), settled in Hsiao-shan. Heng was a native of Ch’ang-hsiang-li (長巷 里), a place near Soochow, and no doubt for that reason named the community he founded Ch’ang-hsiang-li. Though poverty was a common motive for migration in traditional China, Heng and his descendants in Hsiao-shan were not impoverished refugees. On the contrary, the Hsiao-shan branch of the Shen clan was long known as “prominent lineage” (wang-tsu 望族). Heng, a member of the fourth generation, earned his chin-shih (進士) degree in 1034, and one of his descendants, a member of the fifth generation, earned another degree in 1073.5 After the sixth generation, however, the fortunes of the clan declined, and it is said that they devoted themselves to farming. There is no further evidence of success in the examination stalls until the early Ch’ing period, six hundred years later.
The Hsü clan traces its descent to a man named Shih (奭), a chin-shih of 1012, but the Hsiao-shan branch of the clan was founded by a man named Pen-I (本一), said to be a fifteenth-generation descendant of Hsü Shih. It is not clear when Pen-i was born, but it was recorded that during the early Ming period he moved to Hsiao-shan from his native Shan-yin 山陰 to avoid a population census ordered by the founding emperor. Unlike Shen Heng, who came to Hsiao-shan as the holder of a prestigious
chin-shih degree, Hsü Pen-i came as a kind of male bride. The records tell us that he
married uxorilocally into a family surnamed Wen (溫).6
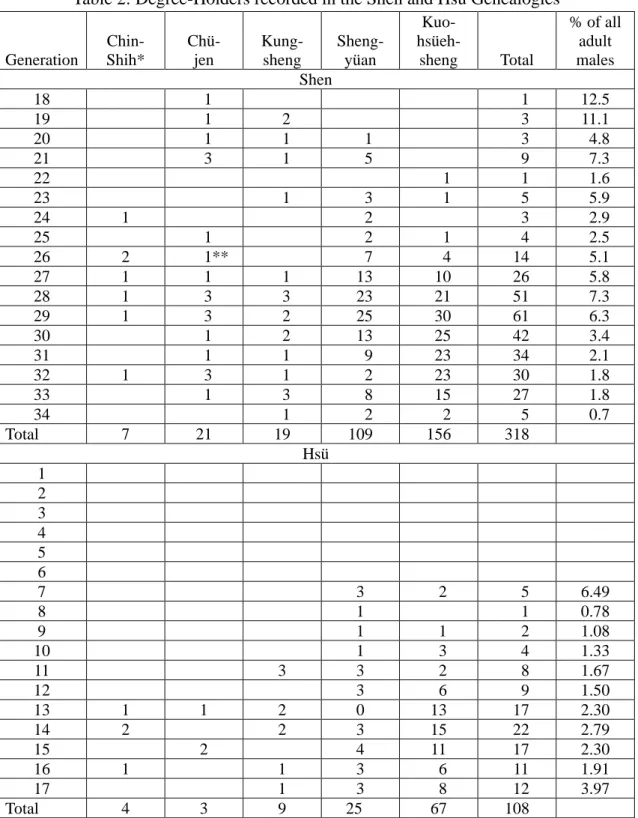
Despite the great differences in the social circumstances attending their move to Hsiao-shan, the social gap between the Shens and the Hsüs appears to have largely disappeared by the beginning of the Ch’ing Period. By then the Shens had regained something of their former eminence, and the Hsüs had overcome their lowly origin and established themselves as a prominent lineage. Table 2 compares the two clans in terms of number and kind of degrees held by clan members. The proportion of degree-holders was larger among the Shens than among the Hsüs, but the difference was not great and should not be seen as evidence of their belonging to different social strata. The two clans were equally successful at the highest levels of the examination system, each earning four chin-shih degrees, the Shens in 1685, 1733, 1772, and 1868 and the Hsüs in 1793, 1825, 1850 and 1876. (Three earlier military chin-shih of the Shen clan are excluded from the reckoning.) Moreover, the slight advantage the Shens gained in the traditional examination system was probably offset by the fact that the first graduates of the few modern schools established before the end of the Ch’ing period included several of the Hsü clan.
5 Shen-shih, ch. 32. 6 Hsü-shih, chs. 1, 3.
6
Table 2: Degree-Holders recorded in the Shen and Hsü Genealogies
Generation Chin- Shih* Chü- jen Kung- sheng Sheng- yüan Kuo- hsüeh- sheng Total % of all adult males Shen 18 1 1 12.5 19 1 2 3 11.1 20 1 1 1 3 4.8 21 3 1 5 9 7.3 22 1 1 1.6 23 1 3 1 5 5.9 24 1 2 3 2.9 25 1 2 1 4 2.5 26 2 1** 7 4 14 5.1 27 1 1 1 13 10 26 5.8 28 1 3 3 23 21 51 7.3 29 1 3 2 25 30 61 6.3 30 1 2 13 25 42 3.4 31 1 1 9 23 34 2.1 32 1 3 1 2 23 30 1.8 33 1 3 8 15 27 1.8 34 1 2 2 5 0.7 Total 7 21 19 109 156 318 Hsü 1 2 3 4 5 6 7 3 2 5 6.49 8 1 1 0.78 9 1 1 2 1.08 10 1 3 4 1.33 11 3 3 2 8 1.67 12 3 6 9 1.50 13 1 1 2 0 13 17 2.30 14 2 2 3 15 22 2.79 15 2 4 11 17 2.30 16 1 1 3 6 11 1.91 17 1 3 8 12 3.97 Total 4 3 9 25 67 108
* The three chin-shih in the 24th and 26th generations of the Shen were military chih-shih. ** Military chü-jen.
Since some descent groups were more powerful and more prestigious than others, one can usefully compare the social status of lineages and clans. However, it is important to remember that the most prominent descent groups included many people who were poor and politically important. The Shen and Hsü genealogies only note the
7
occupations of their members when they achieve official rank, but remarks contained in a few of the biographies give us a glimpse of the diversity characteristic of all Chinese descent groups.
The Shen genealogy mentions several men who became rich through trade, several others who were famed for their skill in medicine, even some who appear to have earned their living as fortune-tellers. And the Hsü genealogy tells us that several of the clan’s members supported themselves as shopkeepers, running such establishments as a copper shop, a grain and salt shop, a carpentry shop, a lantern shop, and a noodle shop. Though this evidence does not allow us to determine the social status of more than a handful of the people listed in the two genealogies, it does serve to remind us that Chinese descent groups belonged to a complex society and reflected that complexity. What follows should not be compared with T. H. Hollingsworth’s study of the English peerage.7 The people whose success in the examination took them to the top of Chinese society may have dominated the Shen and Hsü clans, but they were out-numbered 1,000 to one by merchants, shopkeepers, farmers, and farm laborers.
Marriage
Though our genealogies do not provide marriage dates for either men or women, they do yield information that reveals a good deal about marriage practices. Probably because a woman’s rights and duties with respect to her husband and his kinsmen varied with the form of her marriage, a number of terms were employed to distinguish the status of in-marrying women. A first wife was termed p’ei 配; a second wife (that is, a woman marrying a man who had lost his first wife) chi 繼; a third wife, yu-chi 又 繼; a fourth wife, san-chi 三繼. A woman who had herself married previously was dubbed ch’ü 娶 regardless of whether or not she was her husband’s first wife, and concubines were termed ts’e 側 or fu 副. The proportion of all Shen and Hsü wives occupying each of these statues is shown in Table 1. These data enable us to estimate the incidence of polygynous unions, the frequency of remarriage, and the rapidity with which widows and widowers married a second or third time.
Consider first the incidence of polygynous unions. Of a total of 7,163 women marrying into the Shen clan, 236 came as concubines; and of 3,948 women taken as wives by members of the Hsü clan, 58 entered as concubines. Concubines accordingly account for 3.3 percent of the Shen wives and 1.5 percent of the Hsü wives. Since concubines were not recorded if they did not bear a son, and since some women who
7
T. H. Hollingsworth, The Demography of the British Peerage, supplement to Population Studies, 18. 2 (1964).
8
came as concubines were later elevated to the status of second or third wife,8 these figures say that whereas monogamy was the rule, polygyny was completely acceptable and was probably very common among the elite. The fact that the Shen men took twice as many concubines as the Hsü men presumably reflects their having achieved prominence earlier and in somewhat greater numbers.
Lumping together the generations displayed in Table 1, we find that 6,012 of the men named in the Shen genealogy married at least once and that 824 of these men took a second wife. In other words, of all the men who married once, 13.7 percent married a second time. And in this case we find almost no difference between the two clans. The Hsü genealogy names 3,425 men who married at least once, 12.3 percent of whom married a second time. Given that the Shens were somewhat wealthier than the Hsüs and took almost twice as many concubines, this suggests that a concubine was a luxury, a wife a necessity. This is also evident in the relative frequency of third marriage. Of all the Shen men who married twice, 9.1 percent married a third time, and of the Hsü men who took a second wife, 9.5 percent took a third wife.
What then of remarriage by women? Though traditional ideology discouraged widow remarriage by elevating the celibate widow to the level of a minor cultural hero, both the Shen and the Hsü genealogies indicate that widows did remarry and not infrequently. We find 120 women listed under the label ch’ü in the Shen genealogy and another 51 in the Hsü genealogy. And there is also evidence that women who married into these two clans sometimes married out again after their husbands died. Twenty-eight boys (nine Shens and 19 Hsüs) are listed as sui-mu-ch’u (隨母出), that is, as having accompanied their mothers when they married out of the clan. Though these figures indicates that second marriages were far less common among women than among men, it is likely that some second marriages were passed off as first marriage. The most we can conclude with confidence is that the cult of the celibate widow did not succeed in entirely suppressing second marriages by widows.
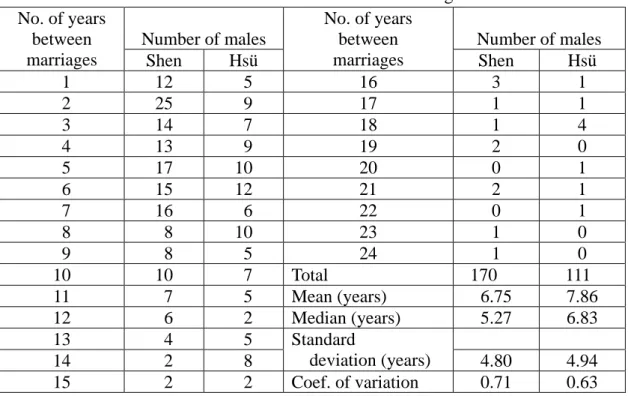
We do not have the evidence necessary to discover how quickly widows remarried, but we can estimate how long it took widowers to remarry by calculating the interval between the first wife’s death and the birth of her replacement’s eldest son. The results are shown in Table 3. Needless to say, they are not precise since they depend not only upon the accuracy of our records but also on what assumptions we make about the length of the mourning period and the birth interval. Since mourning would not have exceeded nine months,9 I have allowed three years for mourning and
8
In 24 cases of the Shen genealogy indicates that the birth of second or third wife’s first son occurred before her predecessor’s death. Though these anomalies could be the result of recording errors, it is more likely that a concubine was elevated to the status of wife after the wife’s death. In every case of the wife who died had failed to produce a male heir.
9
9
the birth interval. The means, medians, and standard deviations for the distributions shown there are (in years) 6.75, 5.27, and 4.80 for the Shen clan and 7.86, 6.83, and 4.94 for the Hsü clan. If we subtract three years from either the means or the medians, we find that the Shen and Hsü clan males remarried within three or four years. Perhaps the most interesting thing about these figures is that the behavior of the two clans is so similar. Whatever the true interval between marriages, it was the same for the Shens and the Hsüs and thus arguably characteristic of Hsiao-shan in general.
Table 3: Estimated Duration between First and Second Marriages of Males in the Shen and Hsü Genealogies
No. of years between marriages Number of males No. of years between marriages Number of males Shen Hsü Shen Hsü 1 12 5 16 3 1 2 25 9 17 1 1 3 14 7 18 1 4 4 13 9 19 2 0 5 17 10 20 0 1 6 15 12 21 2 1 7 16 6 22 0 1 8 8 10 23 1 0 9 8 5 24 1 0 10 10 7 Total 170 111 11 7 5 Mean (years) 6.75 7.86 12 6 2 Median (years) 5.27 6.83 13 4 5 Standard deviation (years) 14 2 8 4.80 4.94 15 2 2 Coef. of variation 0.71 0.63
As we have seen, the founder of the Hsiao-shan branch of the Hsü clan married into his wife’s family. There is other evidence of uxorilocal marriage to be found in the two genealogies. A fifteenth-generation member of the Hsü clan is listed as having married out of his family and the genealogy also notes two men who married into the Hsü descent group. The Shen genealogy contains no evidence of men marrying into the clan, but it does mention four men who married out. Though these few cases may represent only a tiny fraction of all uxorilocal unions, they are interesting as evidence that both clans contained some impoverished families. Only a man too poor to acquire a wife any other way would agree to marry into his wife’s family.
The traditional view of Chinese marriage practices says that marriage was nearly universal and that it occurred at an early age. Was this so? Let us see what our was free to ignore this obligation if his parents were alive. See Ch’ing-hui-tien 清會典 (Statutes of the Ch’ing), 1818 ed., 30: 30a.
10
genealogies tell us. Columns 10-12 of Table 1 list all adult men who might possibly be considered as never marrying. To calculate the proportion of men never marrying we must decide which of these men died unmarried and beyond the possibility of marriage. The men enumerated in Column 11 obviously qualify, but what of those in Columns 10 and 12? Since there is no clear answer, let us set both groups aside and count only those men whom we know to have died unmarried after age 50. Thus we assume that the men in Column 10 would have married if they had lived, and that those in column 12 either were in fact married or might have married if had lived longer. This leaves us with 49 Shens and 78 Hsüs who never married. Since these calculations involve several questionable assumptions, it is encouraging to see that the results agree with what we know about the relative affluence of the Shen and Hsü clans. The proportion of Shens failing to marry was only 0.5 percent compared to 1.5 percent among the Hsüs.
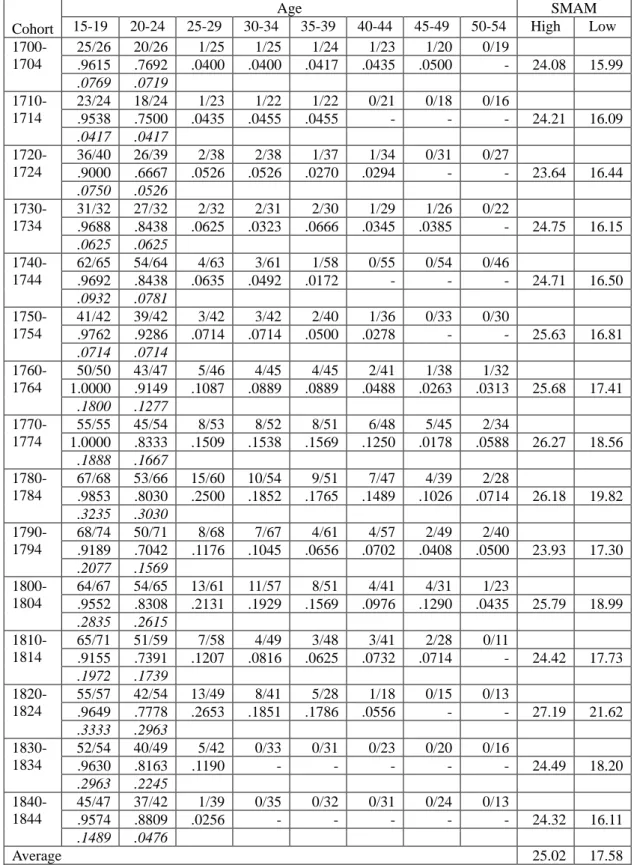
Since Chinese genealogies do not report age at marriage for either males or females, we have no choice but to resort to indirect methods of estimating the value of this important variable. The most appropriate procedure for men is to estimate the proportions single at given ages and then to apply John Hajnal’s method of calculating what he terms the “singulate mean age at marriage” (SMAM).10 The problem is to decide what assumptions to apply in estimating the proportion of single men in the critical age categories 15-19 and 20-24. One possibility is to assume that all men who did not have sons were single. Another is to assume that the only single men were those who died single. Since the two sets of assumptions produce very different results, I have calculated two sets of figures, one under the high-age-at-marriage assumption and the other under the low-age-at-marriage assumption. Our best estimate of men’s age at marriage is probably an average of these two sets of figures. Table 4 reports the results of my calculations for selected cohorts of the Hsü clan. Under the high-age-at-marriage assumption the average age at marriage for these fifteen cohorts was 25.02 years; under the low-age-at-marriage assumption it was 17.58 years; on the average it is 21.3 years, which is strikingly close to the Princeton group’s estimate of 21.39 years for South China in the 1930’s.11 Though this could be nothing more than a happy coincidence, I prefer to view it as support for my assumptions and as evidence that a low age at marriage has been characteristic of China for several centuries.
10
John Hajnal, “Age at Marriage and Proportions Marrying,” Population Studies, 7. 2 (1953): 111-136. SMAM = (15 + Si – 50S50) / (1 – S50), where Si denotes the proportion single at each age group and S50
the proportion single at age 50. S50 is calculated as the average of S45-49 and S50-54. 11
11
Table 4: Proportion Single at Each Age Group and Singulate Mean Age at Marriage (SMAM) for Selected Cohorts of Hsü clan Males, 1700-1844
Cohort Age SMAM 15-19 20-24 25-29 30-34 35-39 40-44 45-49 50-54 High Low 1700- 1704 25/26 20/26 1/25 1/25 1/24 1/23 1/20 0/19 .9615 .7692 .0400 .0400 .0417 .0435 .0500 - 24.08 15.99 .0769 .0719 1710- 1714 23/24 18/24 1/23 1/22 1/22 0/21 0/18 0/16 .9538 .7500 .0435 .0455 .0455 - - - 24.21 16.09 .0417 .0417 1720- 1724 36/40 26/39 2/38 2/38 1/37 1/34 0/31 0/27 .9000 .6667 .0526 .0526 .0270 .0294 - - 23.64 16.44 .0750 .0526 1730- 1734 31/32 27/32 2/32 2/31 2/30 1/29 1/26 0/22 .9688 .8438 .0625 .0323 .0666 .0345 .0385 - 24.75 16.15 .0625 .0625 1740- 1744 62/65 54/64 4/63 3/61 1/58 0/55 0/54 0/46 .9692 .8438 .0635 .0492 .0172 - - - 24.71 16.50 .0932 .0781 1750- 1754 41/42 39/42 3/42 3/42 2/40 1/36 0/33 0/30 .9762 .9286 .0714 .0714 .0500 .0278 - - 25.63 16.81 .0714 .0714 1760- 1764 50/50 43/47 5/46 4/45 4/45 2/41 1/38 1/32 1.0000 .9149 .1087 .0889 .0889 .0488 .0263 .0313 25.68 17.41 .1800 .1277 1770- 1774 55/55 45/54 8/53 8/52 8/51 6/48 5/45 2/34 1.0000 .8333 .1509 .1538 .1569 .1250 .0178 .0588 26.27 18.56 .1888 .1667 1780- 1784 67/68 53/66 15/60 10/54 9/51 7/47 4/39 2/28 .9853 .8030 .2500 .1852 .1765 .1489 .1026 .0714 26.18 19.82 .3235 .3030 1790- 1794 68/74 50/71 8/68 7/67 4/61 4/57 2/49 2/40 .9189 .7042 .1176 .1045 .0656 .0702 .0408 .0500 23.93 17.30 .2077 .1569 1800- 1804 64/67 54/65 13/61 11/57 8/51 4/41 4/31 1/23 .9552 .8308 .2131 .1929 .1569 .0976 .1290 .0435 25.79 18.99 .2835 .2615 1810- 1814 65/71 51/59 7/58 4/49 3/48 3/41 2/28 0/11 .9155 .7391 .1207 .0816 .0625 .0732 .0714 - 24.42 17.73 .1972 .1739 1820- 1824 55/57 42/54 13/49 8/41 5/28 1/18 0/15 0/13 .9649 .7778 .2653 .1851 .1786 .0556 - - 27.19 21.62 .3333 .2963 1830- 1834 52/54 40/49 5/42 0/33 0/31 0/23 0/20 0/16 .9630 .8163 .1190 - - - 24.49 18.20 .2963 .2245 1840- 1844 45/47 37/42 1/39 0/35 0/32 0/31 0/24 0/13 .9574 .8809 .0256 - - - 24.32 16.11 .1489 .0476 Average 25.02 17.58
Note: The first cell reads as follows: Out of 26 males in the cohort, 25 (96.15%) were single in the 15-19 age group on the high-age-of-marriage assumption. On the low-age-at-marriage assumption, only 7.79% were single. Italic figures throughout are low age assumptions.
12
With no way of estimating the proportion of women single at different ages, we cannot apply the Hajnal procedure to solve the problem of estimating age at marriage for women. However, since we know the birth dates of most husbands and wives, we can calculate the average difference in their ages and thus use the husband’s age at marriage to estimate the wife’s age at marriage.
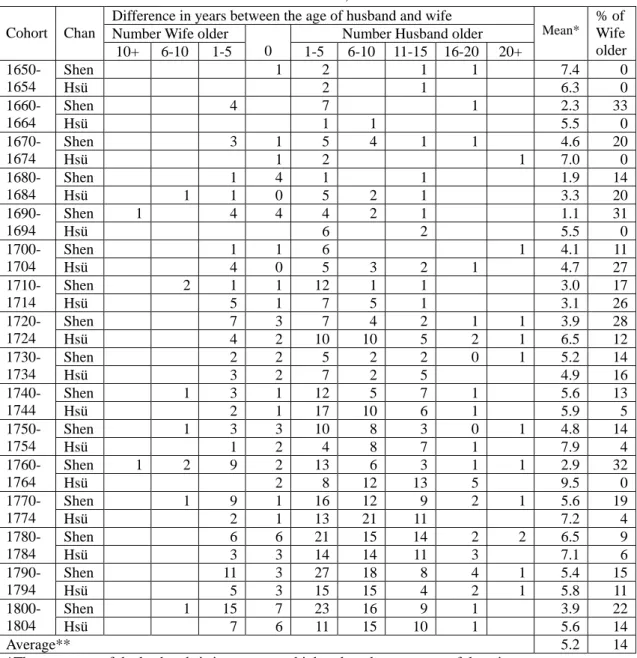
Table 5 says that on the average the men born into the Shen and Hsü clans in 1650-1804 were 5.2 years older than their wives.12 If the average age at marriage of man born into the two clans was 21.3 years, the average age at marriage of their wives was approximately 16.1 years. This is considerably lower than the 17.78 years obtained by the Princeton group for South China,13 but well within the range of possibility in a society in which marriages were arranged by the elderly and in which grandchildren and great-grandchildren were looked on as signs of prosperity and good fortune.
The figures in the last column of Table 5 indicate that a surprisingly large percentage of all wives were older than their husbands. The average for all cohorts is 14 percent (18 percent in the Shen clan and 10 percent in the Hsü clan), with some cohorts exceeding 30 percent. These figures confirm a tendency noted by Michel Cartier in his analysis of Ming biographies,14 and suggest that a preference for matches in which the wife is younger than he husband is a relatively recent phenomenon.
We can obtain another estimate of women’s age at marriage in the Hsiao-shan area by examining the biographies included in the Hsiao-shan hsien-chih kao (蕭山縣 志稿Draft gazetteer of Hsiao-shan). Age at marriage is noted for 94 of the 546 women mentioned in the biographies.15 The mean of these 94 reports is 17.83 sui, or approximately 16.83 years, a figure comfortingly close to our 16.1 years. I am therefore satisfied that the fertility estimates reported in the following section are not far from the truth in taking 17 years as the mean age at marriage for women in Hsiao-shan.
12
This difference in the age of husband and wife is confirmed by calculating their age at the birth of their eldest son. The average for the Shen clan was 25.17 for wives and 30.51 for husbands; for the Hsü clan the averages were 24.64 and 29.81. One of the Taiwan genealogies I studied yielded average of 21.18 and 26.65; the other, 22.07 and 17.06. Taken together with the statistics showing that the ages of all husbands and wives in Taiwan in 1910 and 1915 differed by 5.3 years and 5 years, see Bank of Taiwan, ed., The Population in Taiwan (1949), p. 10. This evidence says that a difference of five years was the rule in late traditional China.
13
Barclay et al., p.609.
14
See Michel Cartier, “Nouvelles données sure la demographie chinoise à l’époque des Ming (1384-1644),” Annales, 6 (Nov,.-Dec. 1973): 1344-1345.
15
Hsiao-shan hsien-chih kao (Draft gazetteer of Hsiao-shan), 1935 ed., chs. 22-24. The age distribution of the women by sui is as follows:
Sui 14 15 16 17 18 19 20 21 22 23 24 25
13
Table 5: Difference in Age Between Husband and First Wife, Selected Cohorts of Shen and Chü clans, 1650-1804
Cohort Chan
Difference in years between the age of husband and wife
Mean*
% of Wife older Number Wife older
0
Number Husband older 10+ 6-10 1-5 1-5 6-10 11-15 16-20 20+ 1650- 1654 Shen 1 2 1 1 7.4 0 Hsü 2 1 6.3 0 1660- 1664 Shen 4 7 1 2.3 33 Hsü 1 1 5.5 0 1670- 1674 Shen 3 1 5 4 1 1 4.6 20 Hsü 1 2 1 7.0 0 1680- 1684 Shen 1 4 1 1 1.9 14 Hsü 1 1 0 5 2 1 3.3 20 1690- 1694 Shen 1 4 4 4 2 1 1.1 31 Hsü 6 2 5.5 0 1700- 1704 Shen 1 1 6 1 4.1 11 Hsü 4 0 5 3 2 1 4.7 27 1710- 1714 Shen 2 1 1 12 1 1 3.0 17 Hsü 5 1 7 5 1 3.1 26 1720- 1724 Shen 7 3 7 4 2 1 1 3.9 28 Hsü 4 2 10 10 5 2 1 6.5 12 1730- 1734 Shen 2 2 5 2 2 0 1 5.2 14 Hsü 3 2 7 2 5 4.9 16 1740- 1744 Shen 1 3 1 12 5 7 1 5.6 13 Hsü 2 1 17 10 6 1 5.9 5 1750- 1754 Shen 1 3 3 10 8 3 0 1 4.8 14 Hsü 1 2 4 8 7 1 7.9 4 1760- 1764 Shen 1 2 9 2 13 6 3 1 1 2.9 32 Hsü 2 8 12 13 5 9.5 0 1770- 1774 Shen 1 9 1 16 12 9 2 1 5.6 19 Hsü 2 1 13 21 11 7.2 4 1780- 1784 Shen 6 6 21 15 14 2 2 6.5 9 Hsü 3 3 14 14 11 3 7.1 6 1790- 1794 Shen 11 3 27 18 8 4 1 5.4 15 Hsü 5 3 15 15 4 2 1 5.8 11 1800- 1804 Shen 1 15 7 23 16 9 1 3.9 22 Hsü 7 6 11 15 10 1 5.6 14 Average** 5.2 14
*The mean age of the husbands is in every case higher than the mean age of the wives.
**Cohorts 1810-14, 1820-24, 1830-34, 1840-44 are not included in the table but are counted in the average.
There is one last point about marriage as such before we turn to the question of fertility. We have seen that despite the ideal of the celibate widow, many widows did remarry. We must now ask how many women were widowed during their reproductive years, since the proportion of young widows in a population can have a significant effect on fertility and might account for some of the results reported below.
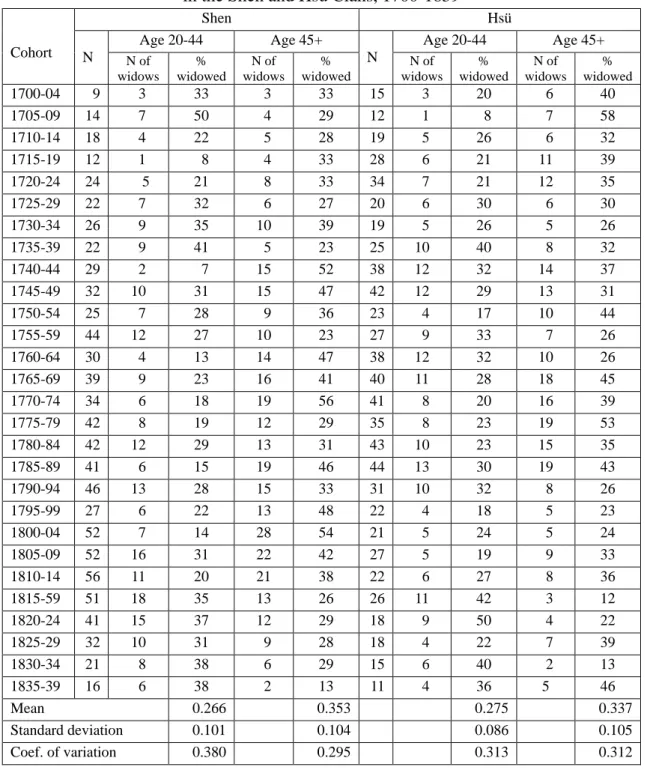
Table 6 lists the number of marriages under observation (N) and then reports the number of widows and the percent of women widowed for each of two broad age classes. The analysis is limited to the years 1700-1839 because the data for women born before 1700 and after 1840 are incomplete. The results indicate that a large
14
proportion of all women were widowed, and that this was true of both clans. The average for women aged 20-44 was 0.266 in the Shen clan and 0.275 in the Hsü clan; for women age 45 and above, the average was 0.353 among the Shens and 0.337 among the Hsüs. The fact that more than one-fourth of all women were widowed during the reproductive period should be borne in mind when we attempt to explain the relatively low fertility reported in the next section.
Table 6: Number and Proportion of Widows among First Wives in the Shen and Hsü Clans, 1700-1839
Cohort Shen Hsü N Age 20-44 Age 45+ N Age 20-44 Age 45+ N of widows % widowed N of widows % widowed N of widows % widowed N of widows % widowed 1700-04 9 3 33 3 33 15 3 20 6 40 1705-09 14 7 50 4 29 12 1 8 7 58 1710-14 18 4 22 5 28 19 5 26 6 32 1715-19 12 1 8 4 33 28 6 21 11 39 1720-24 24 5 21 8 33 34 7 21 12 35 1725-29 22 7 32 6 27 20 6 30 6 30 1730-34 26 9 35 10 39 19 5 26 5 26 1735-39 22 9 41 5 23 25 10 40 8 32 1740-44 29 2 7 15 52 38 12 32 14 37 1745-49 32 10 31 15 47 42 12 29 13 31 1750-54 25 7 28 9 36 23 4 17 10 44 1755-59 44 12 27 10 23 27 9 33 7 26 1760-64 30 4 13 14 47 38 12 32 10 26 1765-69 39 9 23 16 41 40 11 28 18 45 1770-74 34 6 18 19 56 41 8 20 16 39 1775-79 42 8 19 12 29 35 8 23 19 53 1780-84 42 12 29 13 31 43 10 23 15 35 1785-89 41 6 15 19 46 44 13 30 19 43 1790-94 46 13 28 15 33 31 10 32 8 26 1795-99 27 6 22 13 48 22 4 18 5 23 1800-04 52 7 14 28 54 21 5 24 5 24 1805-09 52 16 31 22 42 27 5 19 9 33 1810-14 56 11 20 21 38 22 6 27 8 36 1815-59 51 18 35 13 26 26 11 42 3 12 1820-24 41 15 37 12 29 18 9 50 4 22 1825-29 32 10 31 9 28 18 4 22 7 39 1830-34 21 8 38 6 29 15 6 40 2 13 1835-39 16 6 38 2 13 11 4 36 5 46 Mean 0.266 0.353 0.275 0.337 Standard deviation 0.101 0.104 0.086 0.105 Coef. of variation 0.380 0.295 0.313 0.312
15
Fertility
The information provided by the Shen and Hsü genealogies allows us to estimate both male and female fertility rates. There are, however, limitations imposed by the data. First, the lack of information on unmarried women (who are not even mentioned in the genealogies) means that our female rates must be limited to marital fertility. Second, the failure to record all second wives and concubines, together with the difficulty of determining their age at marriage, forces us to confine the female rates to the fertility of first wives; as a result, the children of second wives and concubines are reflected in the male rates but not the female rates. Third, the obvious neglect of many female births and the failure to record the dates of those births in the genealogies leaves us no choice but to estimate fertility on the basis of male births. Were we to accept at face value the data presented in Columns 7 and 8 of Table 1, we would be forced to the absurd conclusion that Chinese women bore three times as many sons as daughters. One of the most important unanswered questions about Chinese genealogies is why some female births were noted but not others. Neither the Shen nor the Hsü genealogy offers any clue to a rule or convention in this regard. A crude estimate of fertility can be obtained directly from Table 2 by calculating the son/mother ratio or the son/father ratio by generation or cohort. A more laborious but ultimately more fruitful approach is to apply family reconstitution techniques to estimate age-specific fertility and total fertility, and this is the procedure I have followed. After designating a family reconstitution sheet for each male who survived to adulthood, I recorded on that sheet his vital dates and those of his wives and sons. Gaps in the data (and fortunately there were very few of these) were filled by applying the conventions that I developed in analyzing the two Taiwanese genealogies.16 If the birth date of one of several sons, let us say the first-born, was missing, I subtracted three years from the birth date of the second-born son. The birth date of a last-born son was obtained by adding three years to the birth date of the next-to-last born, and a missing date for a boy born in the middle of a series was estimated by taking the midpoint of the interval bounded by the births of the next – oldest and next-youngest sons. Parental dates were complete for the great majority of all people born before 1820, but there were gaps in the record for those born after that date. In the case of a missing death date (the most common problem), childbearing was traced to the birth of the last son but that birth was not counted.
My next step was to calculate, first, the age of the parents at the birth of each son, and second, the date at which each period of observation terminated. For women in their first marriages (the basis of my female fertility rate) the termination date was
16
16
the date of their husband’s death, the date of their own death, or their fiftieth birthday, whichever came first; for adult men (the basis of my male fertility rate) it was simply their sixtieth birthday. I then organized my two samples (married women and adult men) into birth cohorts and estimated the two fertility rates by dividing the number of sons born to each cohort by the number of person-years experienced by the members of that cohort. An example of the results obtained is presented in Table 7.
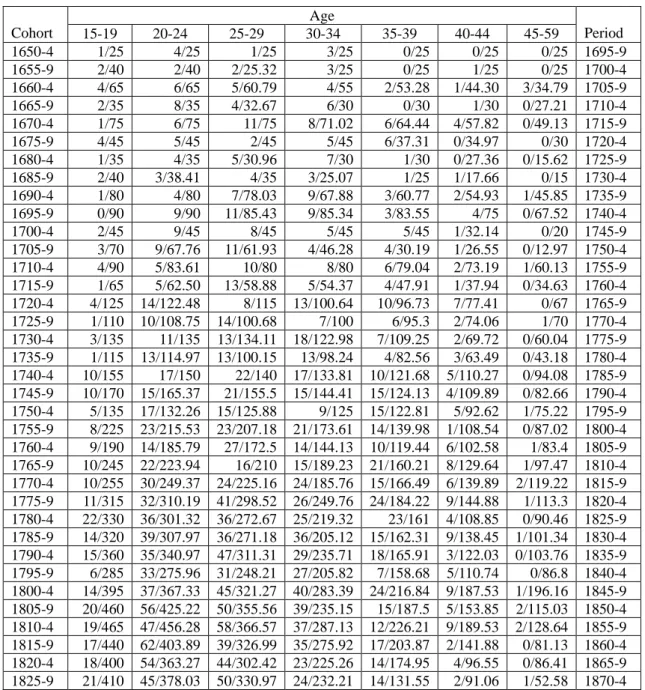
Table 7: Data Used to Estimate Age-Specific Fertility among First Wives of Shen Clan
Cohort Age Period 15-19 20-24 25-29 30-34 35-39 40-44 45-59 1650-4 1/25 4/25 1/25 3/25 0/25 0/25 0/25 1695-9 1655-9 2/40 2/40 2/25.32 3/25 0/25 1/25 0/25 1700-4 1660-4 4/65 6/65 5/60.79 4/55 2/53.28 1/44.30 3/34.79 1705-9 1665-9 2/35 8/35 4/32.67 6/30 0/30 1/30 0/27.21 1710-4 1670-4 1/75 6/75 11/75 8/71.02 6/64.44 4/57.82 0/49.13 1715-9 1675-9 4/45 5/45 2/45 5/45 6/37.31 0/34.97 0/30 1720-4 1680-4 1/35 4/35 5/30.96 7/30 1/30 0/27.36 0/15.62 1725-9 1685-9 2/40 3/38.41 4/35 3/25.07 1/25 1/17.66 0/15 1730-4 1690-4 1/80 4/80 7/78.03 9/67.88 3/60.77 2/54.93 1/45.85 1735-9 1695-9 0/90 9/90 11/85.43 9/85.34 3/83.55 4/75 0/67.52 1740-4 1700-4 2/45 9/45 8/45 5/45 5/45 1/32.14 0/20 1745-9 1705-9 3/70 9/67.76 11/61.93 4/46.28 4/30.19 1/26.55 0/12.97 1750-4 1710-4 4/90 5/83.61 10/80 8/80 6/79.04 2/73.19 1/60.13 1755-9 1715-9 1/65 5/62.50 13/58.88 5/54.37 4/47.91 1/37.94 0/34.63 1760-4 1720-4 4/125 14/122.48 8/115 13/100.64 10/96.73 7/77.41 0/67 1765-9 1725-9 1/110 10/108.75 14/100.68 7/100 6/95.3 2/74.06 1/70 1770-4 1730-4 3/135 11/135 13/134.11 18/122.98 7/109.25 2/69.72 0/60.04 1775-9 1735-9 1/115 13/114.97 13/100.15 13/98.24 4/82.56 3/63.49 0/43.18 1780-4 1740-4 10/155 17/150 22/140 17/133.81 10/121.68 5/110.27 0/94.08 1785-9 1745-9 10/170 15/165.37 21/155.5 15/144.41 15/124.13 4/109.89 0/82.66 1790-4 1750-4 5/135 17/132.26 15/125.88 9/125 15/122.81 5/92.62 1/75.22 1795-9 1755-9 8/225 23/215.53 23/207.18 21/173.61 14/139.98 1/108.54 0/87.02 1800-4 1760-4 9/190 14/185.79 27/172.5 14/144.13 10/119.44 6/102.58 1/83.4 1805-9 1765-9 10/245 22/223.94 16/210 15/189.23 21/160.21 8/129.64 1/97.47 1810-4 1770-4 10/255 30/249.37 24/225.16 24/185.76 15/166.49 6/139.89 2/119.22 1815-9 1775-9 11/315 32/310.19 41/298.52 26/249.76 24/184.22 9/144.88 1/113.3 1820-4 1780-4 22/330 36/301.32 36/272.67 25/219.32 23/161 4/108.85 0/90.46 1825-9 1785-9 14/320 39/307.97 36/271.18 36/205.12 15/162.31 9/138.45 1/101.34 1830-4 1790-4 15/360 35/340.97 47/311.31 29/235.71 18/165.91 3/122.03 0/103.76 1835-9 1795-9 6/285 33/275.96 31/248.21 27/205.82 7/158.68 5/110.74 0/86.8 1840-4 1800-4 14/395 37/367.33 45/321.27 40/283.39 24/216.84 9/187.53 1/196.16 1845-9 1805-9 20/460 56/425.22 50/355.56 39/235.15 15/187.5 5/153.85 2/115.03 1850-4 1810-4 19/465 47/456.28 58/366.57 37/287.13 12/226.21 9/189.53 2/128.64 1855-9 1815-9 17/440 62/403.89 39/326.99 35/275.92 17/203.87 2/141.88 0/81.13 1860-4 1820-4 18/400 54/363.27 44/302.42 23/225.26 14/174.95 4/96.55 0/86.41 1865-9 1825-9 21/410 45/378.03 50/330.97 24/232.21 14/131.55 2/91.06 1/52.58 1870-4 Note: The numerators are the number of sons born, the denominators the number of woman-years or years of observation.
The data for the cohorts listed at the left of the Table 7 are read horizontally; those for the periods listed at the right of the table are read obliquely. To save space and
17
deemphasized random fluctuation, the rates presented below are the average of three cohorts or three periods.17
A refined estimate of age-specific fertility was obtained by means of the “children-ever-born” technique, or what might better be termed the “sons-ever-born” technique given the limitations of my data. Taking parity (P) to equal the number of sons born to each cohort by the end of each age interval, I calculated cumulative fertility (F) by the formula Fi = ϕi + 3fi, where fi is the age-specific fertility rate and ϕi
is the cumulated fertility up to the lower boundary of the i-th age interval), and then used the P/F ratios to adjust the age-specific fertility rates.18 The results obtained for the adult males are reported as the male fertility rate, but the results for married females were divided by 1.06 (the assumed sex ratio at birth) to obtain estimates of the number of daughters born and hence that reflect both male and female births. Total fertility was also calculated for married females by multiplying the sum of the age – specific fertility rates by five.
The results of these procedures are summarized in visual form in Figures 1-3 and are reported in detail in Tables 8-11. Note that P/F ratio in Table 8 is about 1.00 for the first age group of most cohorts and that it declines steadily as the cohort ages. Clearly we cannot be far from the truth in taking 17 as the average at marriage, and in lowering our estimates of age-specific fertility among the older age groups.
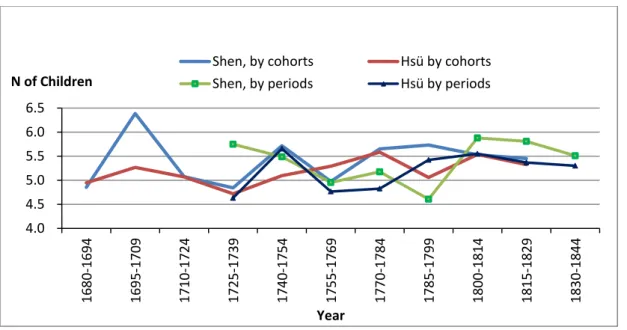
Figure 1: Total fertility of first wives by cohorts and periods, Shen and Hsü clans, 1690-1840
17
Because the number of cases is not very large, this procedure is not entirely satisfactory. Some of the remaining irregularities could be smooth by applying techniques developed by William Brass, see “The Graduation of Fertility Distribution by Polynomial Functions,” Population Studies, 14, 2 (1930): 148-162.
18
See William Brass et al., The Demography of Tropical Africa (Princeton, N. J., 1968), pp. 92-93. 4.0 4.5 5.0 5.5 6.0 6.5 16 80 -16 94 16 95 -17 09 17 10 -17 24 17 25 -17 39 17 40 -17 54 17 55 -17 69 17 70 -17 84 17 85 -17 99 18 00 -18 14 18 15 -18 29 18 30 -18 44 N of Children Year
Shen, by cohorts Hsü by cohorts Shen, by periods Hsü by periods
18
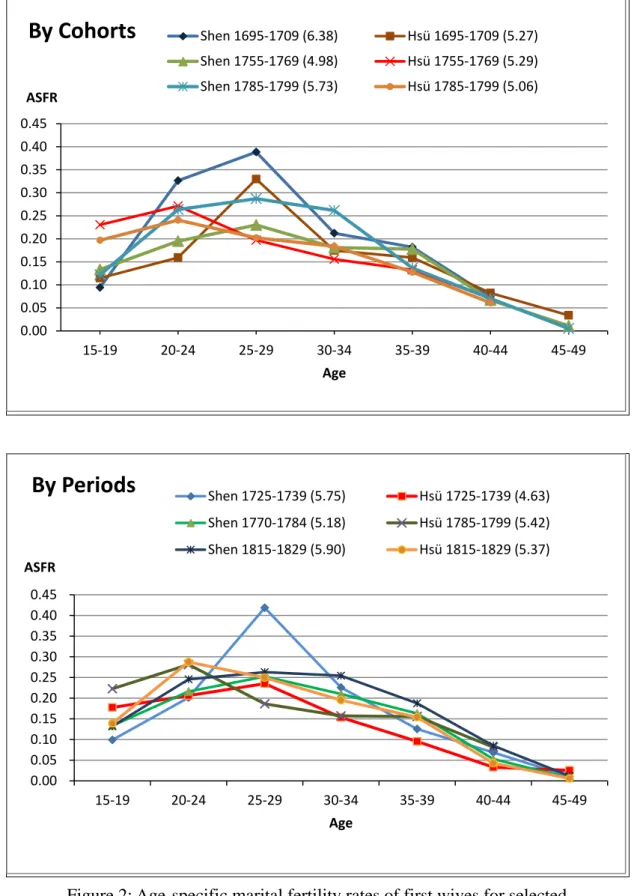
Figure 2: Age-specific marital fertility rates of first wives for selected cohorts and periods, Shen and Hsü clans, 1695-1829
(Total fertility rate in parenthesis) 0.00 0.05 0.10 0.15 0.20 0.25 0.30 0.35 0.40 0.45 15-19 20-24 25-29 30-34 35-39 40-44 45-49 ASFR Age
By Cohorts
Shen 1695-1709 (6.38) Hsü 1695-1709 (5.27) Shen 1755-1769 (4.98) Hsü 1755-1769 (5.29) Shen 1785-1799 (5.73) Hsü 1785-1799 (5.06) 0.00 0.05 0.10 0.15 0.20 0.25 0.30 0.35 0.40 0.45 15-19 20-24 25-29 30-34 35-39 40-44 45-49 ASFR AgeBy Periods
Shen 1725-1739 (5.75) Hsü 1725-1739 (4.63) Shen 1770-1784 (5.18) Hsü 1785-1799 (5.42) Shen 1815-1829 (5.90) Hsü 1815-1829 (5.37)19
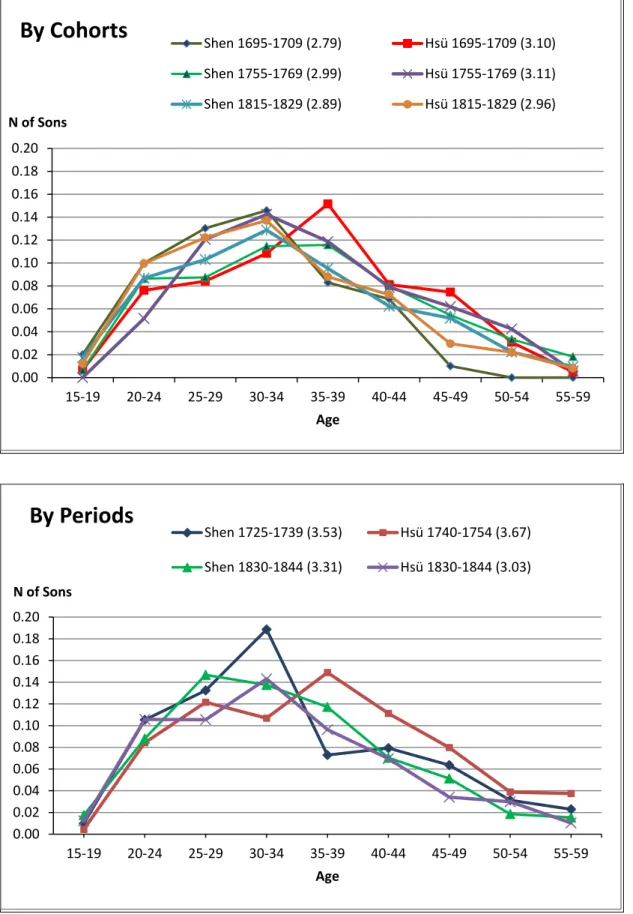
Figure 3: Adjusted male age-specific fertility rates in terms of sons for selected cohorts and Periods, Shen and Hsü clans, 1695-1844
(GRR in parenthesis) 0.00 0.02 0.04 0.06 0.08 0.10 0.12 0.14 0.16 0.18 0.20 15-19 20-24 25-29 30-34 35-39 40-44 45-49 50-54 55-59 N of Sons Age
By Cohorts
Shen 1695-1709 (2.79) Hsü 1695-1709 (3.10) Shen 1755-1769 (2.99) Hsü 1755-1769 (3.11) Shen 1815-1829 (2.89) Hsü 1815-1829 (2.96) 0.00 0.02 0.04 0.06 0.08 0.10 0.12 0.14 0.16 0.18 0.20 15-19 20-24 25-29 30-34 35-39 40-44 45-49 50-54 55-59 N of Sons AgeBy Periods
Shen 1725-1739 (3.53) Hsü 1740-1754 (3.67) Shen 1830-1844 (3.31) Hsü 1830-1844 (3.03)20
Table 8: Marital Age-Specific Fertility and Total Fertility of First Wives by Cohort, Shen and Hsü Clans, 1680-1829
Shen Cohort Measure Age Total 15-19 20-24 25-29 30-34 35-39 40-44 45-549 1680- 1694 Observed fs 0.0506 0.0808 0.1218 0.1618 0.0409 0.0310 0.0073 P/F 1.0000 1.1114 1.0771 0.9975 0.8450 0.8354 0.8154 Adj. fs 0.0506 0.0898 0.1312 0.1614 0.0346 0.0259 0.0060 2.4975 SR=1.06, fd 0.0477 0.0847 0.1238 0.1523 0.0326 0.0244 0.0057 2.3560 Both sexes 0.0983 0.1745 0.2550 0.3139 0.0672 0.0503 0.0117 4.8535 1695- 1709 Observed fs 0.0485 0.1143 0.1592 0.1010 0.0932 0.0407 - P/F 1.0000 1.4687 1.2556 1.0814 1.0043 0.9396 - Adj. fs 0.0485 0.1679 0.1999 0.1092 0.0936 0.0382 - 3.2865 SR=1.06, fd 0.0458 0.1584 0.1886 0.1030 0.0883 0.0360 - 3.1005 Both sexes 0.0943 0.3263 0.3885 0.2122 0.1819 0.0742 - 6.3870 1710- 1724 Observed fs 0.0510 0.0835 0.1367 0.1032 0.0876 0.0480 0.0055 P/F 1.0000 1.1088 1.0952 0.9819 0.9286 0.8714 0.8404 Adj. fs 0.0510 0.0926 0.1497 0.1013 0.0813 0.0418 0.0046 2.6115 SR=1.06, fd 0.0481 0.0874 0.1412 0.0956 0.0767 0.0394 0.0043 2.4635 Both sexes 0.0991 0.1800 0.2909 0.1969 0.1580 0.0812 0.0089 5.0750 1725- 1739 Observed fs 0.0222 0.0955 0.1219 0.1162 0.0585 0.0238 0.0048 P/F 1.0015 1.3645 1.1564 1.0475 0.9493 0.9118 0.8930 Adj. fs 0.0237 0.3303 0.1410 0.1217 0.0555 0.0217 0.0043 2.4910 SR=1.06, fd 0.0224 0.1229 0.1330 0.1148 0.0524 0.0205 0.0041 2.3505 Both sexes 0.0461 0.2532 0.2740 0.2365 0.1079 0.0422 0.0084 4.8415 1740- 1754 Observed fs 0.0891 0.1108 0.11371 0.1010 0.1084 0.0453 0.0044 P/F 1.0135 1.0499 1.0293 0.9554 0.9314 0.8714 0.8451 Adj. fs 0.0903 0.1163 0.1411 0.0965 0.1010 0.0395 0.0037 2.9420 SR=1.06, fd 0.0852 0.1097 0.1331 0.0910 0.0953 0.0373 0.0035 2.7755 Both sexes 0.1755 0.2260 0.2742 0.1875 0.1965 0.0768 0.0072 5.7175 1755- 1769 Observed fs 0.0687 0.0934 0.1146 0.0991 0.1049 0.0431 0.0074 P/F 1.0005 1.0734 1.0329 0.9398 0.8724 0.8008 0.7739 Adj. fs 0.0687 0.1003 0.1184 0.0931 0.0915 0.0345 0.0057 2.5610 SR=1.06, fd 0.0648 0.0946 0.1117 0.0878 0.0863 0.0325 0.0054 2.4155 Both sexes 0.1335 0.1949 0.2301 0.1809 0.1778 0.0670 0.0111 4.9765 1770- 1784 Observed fs 0.0782 0.1143 0.1253 0.1157 0.1210 0.0472 0.0085 P/F 1.0004 1.0811 1.0080 0.9268 0.8522 0.7808 0.7560 Adj. fs 0.0782 0.1236 0.1263 0.1072 0.1031 0.0369 0.0064 2.9085 SR=1.06, fd 0.0738 0.1166 0.1192 0.1011 0.0973 0.0348 0.0060 2.7440 Both sexes 0.1520 0.2402 0.2455 0.2083 0.2004 0.0717 0.0214 5.6525 1785- 1799 Observed fs 0.0591 0.1162 0.1362 0.1405 0.0817 0.0449 0.0033 P/F 1.0598 1.1674 1.0851 0.9579 0.8600 0.8069 0.7810 Adj. fs 0.0626 0.1357 0.1478 0.1346 0.0703 0.0362 0.0026 2.9490 SR=1.06, fd 0.0591 0.1280 0.1394 0.1270 0.0663 0.0342 0.0025 2.7825 Both sexes 0.1217 0.2637 0.2872 0.2616 0.1366 0.0704 0.0051 5.7315 1800- 1814 Observed fs 0.0666 0.1118 0.1463 0.1453 0.0813 0.0426 0.0127 P/F 1.0205 1.0996 1.0093 0.8763 0.7754 0.7307 0.7069 Adj. fs 0.0680 0.1229 0.1477 0.1273 0.0630 0.0311 0.0090 2.8450 SR=1.06, fd 0.0642 0.1159 0.1393 0.1201 0.0594 0.0293 0.0085 2.6835 Both sexes 0.1322 0.2388 0.2780 0.2474 0.1224 0.0604 0.0175 5.5285 1815- 1829 Observed fs 0.0749 0.1404 0.1386 0.1108 0.0899 0.0258 0.0063 P/F 1.0187 1.1299 0.9737 0.8675 0.7926 0.7425 0.7257 Adj. fs 0.0763 0.1586 0.1350 0.0961 0.0713 0.0192 0.0046 2.8055 SR=1.06, fd 0.0720 0.1496 0.1274 0.0907 0.0673 0.0181 0.0043 2.6470 Both sexes 0.1483 0.3082 0.2624 0.1868 0.1386 0.0373 0.0089 5.4525
21 Table 8 (continued) Hsü Cohort Measure Age Total 15-19 20-24 25-29 30-34 35-39 40-44 45-549 1680- 1694 Observed fs 0.0409 0.1154 0.1344 0.0950 0.0551 0.0228 0.0166 P/F 0.9992 1.2539 1.0903 0.9738 0.9108 0.8749 0.8597 Adj. fs 0.0409 0.1447 0.1465 0.0925 0.0502 0.0199 0.0143 2.5450 SR=1.06, fd 0.0386 0.1365 0.1382 0.0873 0.0474 0.0188 0.0135 2.4015 Both sexes 0.0795 0.2813 0.2847 0.1798 0.0976 0.0387 0.0278 4.9465 1695- 1709 Observed fs 0.0590 0.0777 0.1531 0.0918 0.0873 0.0478 0.0204 P/F 0.9994 1.0536 1.1000 0.9789 0.9378 0.8855 0.8532 Adj. fs 0.0590 0.0891 0.1696 0.0899 0.0819 0.0423 0.0174 2.7200 SR=1.06, fd 0.0557 0.0773 0.1600 0.0848 0.0773 0.0399 0.0164 2.5570 Both sexes 0.1147 0.1592 0.3296 0.1747 0.1592 0.0822 0.0338 5.2670 1710- 1724 Observed fs 0.0914 0.1118 0.1143 0.1100 0.0626 0.0396 - P/F 0.9996 1.0497 1.0099 0.9655 0.9080 0.8739 - Adj. fs 0.0914 0.1174 0.1154 0.1062 0.0568 0.0346 - 2.6090 SR=1.06, fd 0.0862 0.1108 0.1089 0.1002 0.0536 0.0326 - 2.4615 Both sexes 0.1776 0.2282 0.2243 0.2064 0.1104 0.0672 - 5.0705 1725- 1739 Observed fs 0.0550 0.0978 0.1017 0.0823 0.0878 0.0543 - P/F 1.0000 1.1289 1.0444 0.9824 0.9525 0.8791 - Adj. fs 0.0550 0.1114 0.1062 0.0817 0.0836 0.0477 - 2.4280 SR=1.06, fd 0.0519 0.1051 0.1002 0.0771 0.0789 0.0450 - 2.2910 Both sexes 0.1069 0.2165 0.2064 0.1588 0.1625 0.0927 - 4.7190 1740- 1754 Observed fs 0.0708 0.0949 0.1163 0.0934 0.1012 0.0495 - P/F 1.0000 1.0673 1.0509 0.9778 0.9433 0.8773 - Adj. fs 0.0708 0.1013 0.1222 0.0913 0.0955 0.0434 - 2.6225 SR=1.06, fd 0.0668 0.0956 0.1153 0.0861 0.0901 0.0409 - 2.4740 Both sexes 0.1376 0.1969 0.2375 0.1774 0.1856 0.0843 - 5.0965 1755- 1769 Observed fs 0.1186 0.1380 0.1080 0.0890 0.0787 0.0447 - P/F 0.9997 1.0223 0.9389 0.8996 0.8661 0.8181 - Adj. fs 0.1186 0.1396 0.1014 0.0810 0.0682 0.0366 - 2.7225 SR=1.06, fd 0.1119 0.1317 0.0957 0.0756 0.0643 0.0345 - 2.5685 Both sexes 0.2305 0.2713 0.1971 0.1557 0.1325 0.0711 - 5.2910 1770- 1784 Observed fs 0.1146 0.1315 0.1211 0.1073 0.0848 0.0278 0.0031 P/F 1.0003 1.0183 0.9819 0.9315 0.8724 0.8252 0.8094 Adj. fs 0.1146 0.1339 0.1189 0.0999 0.0740 0.0229 0.0025 2.8335 SR=1.06, fd 0.1081 0.1419 0.1122 0.0942 0.0698 0.0216 0.0024 2.7510 Both sexes 0.2227 0.2758 0.2311 0.1941 0.1438 0.0445 0.0049 5.5845 1785- 1799 Observed fs 0.1013 0.1213 0.1097 0.1042 0.0768 0.0390 - P/F 0.9997 1.0205 0.9476 0.9077 0.8545 0.8063 - Adj. fs 0.1013 0.1238 0.1040 0.0946 0.0656 0.0314 - 2.6035 SR=1.06, fd 0.0956 0.1168 0.0981 0.0892 0.0619 0.0296 - 2.4560 Both sexes 0.1969 0.2406 0.2021 0.1838 0.1275 0.0610 - 5.0595 1800- 1814 Observed fs 0.0716 0.1250 0.1196 0.1271 0.0999 0.0650 - P/F 1.0000 1.1314 1.0067 0.8878 0.7762 0.7100 - Adj. fs 0.0716 0.1414 0.1203 0.1128 0.0775 0.0462 - 2.8490 SR=1.06, fd 0.0675 0.1334 0.1135 0.1064 0.0731 0.0436 - 2.6875 Both sexes 0.1391 0.2748 0.2338 0.2192 0.1506 0.0898 - 5.5365 1815- 1829 Observed fs 0.0933 0.1256 0.1379 0.1275 0.0924 0.0186 0.0064 P/F 0.9996 1.0321 0.9446 0.8285 0.7449 0.6983 0.6873 Adj. fs 0.0933 0.1327 0.1303 0.1056 0.0688 0.0130 0.0044 2.7405 SR=1.06, fd 0.0880 0.1252 0.1229 0.0996 0.0649 0.0123 0.0042 2.5855 Both sexes 0.1813 0.2579 0.2532 0.2052 0.1337 0.0253 0.0086 5.3260
22
Table 9: Marital Age-Specific Fertility and Total Fertility of First Wives by Period, Shen and Hsü Clans, 1725-1844
Shen Period Measure Age Total 15-19 20-24 25-29 30-34 35-39 40-44 45-549 1725- 1739 Observed fs 0.0510 0.0897 0.1583 0.1010 0.0655 0.0488 0.0073 P/F 1.0000 1.1566 1.3605 1.1506 0.9864 0.7742 0.7723 Adj. fs 0.0510 0.1037 0.2154 0.1162 0.0646 0.0353 0.0056 2.9590 SR=1.06, fd 0.0481 0.0978 0.2032 0.1096 0.0609 0.0333 0.0053 2.7910 Both sexes 0.0991 0.2015 0.4186 0.2258 0.1255 0.0686 0.0109 5.7500 1740- 1754 Observed fs 0.0222 0.0959 0.1432 0.1032 0.0973 0.0320 - P/F 1.0015 1.4535 1.1887 1.0119 0.9776 1.0483. - Adj. fs 0.0222 0.1394 0.1702 0.1044 0.0951 0.0335 - 2.8240 SR=1.06, fd 0.0209 0.1315 0.1606 0.0985 0.0897 0.0316 - 2.6640 Both sexes 0.0431 0.2709 0.3308 0.2029 0.1848 0.0651 - 5.4885 1755- 1769 Observed fs 0.0891 0.1057 0.1279 0.1162 0.0768 0.0479 0.0055 P/F 1.0135 0.9809 0.9347 0.8257 0.7716 0.7701 0.7609 Adj. fs 0.0903 0.1037 0.1195 0.0959 0.0593 0.0369 0.0042 2.5490 SR=1.06, fd 0.0852 0.0978 0.1127 0.0905 0.0559 0.0348 0.0040 2.4045 Both sexes 0.1755 0.2015 0.2322 0.1864 0.1152 0.0717 0.0082 4.9535 1770- 1784 Observed fs 0.0687 0.1035 0.1217 0.1010 0.0838 0.0299 0.0048 P/F 1.0005 1.0749 1.0666 1.0715 1.0006 0.9050 0.7699 Adj. fs 0.0687 0.1113 0.1298 0.1082 0.0839 0.0271 0.0037 2.6635 SR=1.06, fd 0.0648 0.1050 0.1225 0.1021 0.0792 0.0256 0.0035 2.5135 Both sexes 0.1335 0.2163 0.2523 0.2103 0.1631 0.0527 0.0072 5.1770 1785- 1799 Observed fs 0.1011 0.1072 0.1131 0.0991 0.1019 0.0332 0.0044 P/F 0.7738 0.8870 0.8815 0.8296 0.8560 0.8356 0.8998 Adj. fs 0.0782 0.0951 0.0997 0.0822 0.0872 0.0277 0.0040 2.3705 SR=1.06, fd 0.0738 0.0897 0.0941 0.0775 0.0823 0.0261 0.0038 2.2365 Both sexes 0.1520 0.1848 0.1938 0.1597 0.1695 0.0538 0.0078 4.6070 1800- 1814 Observed fs 0.0591 0.1162 0.1340 0.1157 0.1171 0.0544 0.0074 P/F 1.0598 1.2577 1.0896 0.9476 0.8196 0.7331 0.6802 Adj. fs 0.0626 0.1461 0.1460 0.1096 0.0960 0.0399 0.0050 3.0260 SR=1.06, fd 0.0591 0.1378 0.1377 0.1034 0.0906 0.0376 0.0047 2.8545 Both sexes 0.1217 0.2839 0.2837 0.2130 0.1866 0.0775 0.0097 5.8805 1815- 1829 Observed fs 0.0666 0.1173 0.1386 0.1405 0.1147 0.0546 0.0085 P/F 1.0205 1.0778 0.9770 0.9320 0.8416 0.7744 0.7197 Adj. fs 0.0680 0.1264 0.1354 0.1309 0.0965 0.0437 0.0061 3.0350 SR=1.06, fd 0.0642 0.1192 0.1277 0.1235 0.0910 0.0412 0.0058 2.8630 Both sexes 0.1322 0.2456 0.2631 0.2544 0.1875 0.0849 0.0119 5.8980 1830- 1844 Observed fs 0.0749 0.1350 0.1393 0.1453 0.0783 0.0392 0.0033 P/F 1.0187 1.0971 0.9563 0.8271 0.7464 0.7254 0.7385 Adj. fs 0.0763 0.1481 0.1332 0.1202 0.0584 0.0284 0.0024 2.8350 SR=1.06, fd 0.0720 0.1397 0.1257 0.1134 0.0551 0.0268 0.0023 2.6750 Both sexes 0.1483 0.2878 0.2589 0.2336 0.1135 0.0552 0.0047 5.5100
23 Table 9 (Continued) Hsü Period Measure Age Total 15-19 20-24 25-29 30-34 35-39 40-44 45-549 1725- 1739 Observed fs 0.0914 0.1110 0.1349 0.0918 0.0588 0.0217 0.0166 P/F 0.9996 0.9556 0.8969 0.8604 0.8350 0.7872 0.7836 Adj. fs 0.0914 0.1061 0.1210 0.0790 0.0491 0.0170 0.0130 2.3830 SR=1.06, fd 0.0862 0.1001 0.1142 0.0745 0.0463 0.0160 0.0123 2.2480 Both sexes 0.1776 0.2062 0.2352 0.1535 0.0954 0.0330 0.0253 4.6310 1740- 1754 Observed fs 0.0550 0.0936 0.1177 0.1100 0.0620 0.0613 0.0204 P/F 1.0000 1.2753 1.2328 1.1143 1.0369 0.9391 0.8817 Adj. fs 0.0550 0.1194 0.1451 0.1226 0.0643 0.0576 0.0180 2.9100 SR=1.06, fd 0.0519 0.1126 0.1369 0.1157 0.0607 0.0543 0.0170 2.7455 Both sexes 0.1069 0.2320 0.2820 0.2383 0.1250 0.1119 0.0350 5.6555 1755- 1769 Observed fs 0.0708 0.1056 0.0951 0.0832 0.1051 0.0329 - P/F 1.0000 1.0720 0.9411 0.9332 0.0178 0.9852 - Adj. fs 0.0708 0.1132 0.0895 0.0776 0.1070 0.0324 - 2.4525 SR=1.06, fd 0.0668 0.1068 0.0844 0.0732 0.1009 0.0306 - 2.3135 Both sexes 0.1376 0.2200 0.1739 0.1508 0.2079 0.0630 - 4.7660 1770- 1784 Observed fs 0.1186 0.1126 0.1208 0.0934 0.0640 0.0547 - P/F 0.9997 0.9414 0.8884 0.8101 0.7727 0.7205 - Adj. fs 0.1186 0.1060 0.1073 0.0757 0.0495 0.0394 - 2.4825 SR=1.06, fd 0.1119 0.1000 0.1012 0.0714 0.0467 0.0372 - 2.3420 Both sexes 0.2305 0.2060 0.2085 0.1471 0.0962 0.0766 - 4.8245 1785- 1799 Observed fs 0.1146 0.1435 0.1020 0.0890 0.0965 0.0533 - P/F 1.0003 1.0085 0.9390 0.9094 0.8296 0.7854 - Adj. fs 0.1146 0.1447 0.0958 0.0809 0.0801 0.0419 - 2.7900 SR=1.06, fd 0.1081 0.1365 0.0904 0.0763 0.0756 0.0395 - 2.6320 Both sexes 0.2227 0.2812 0.1862 0.1572 0.1557 0.0814 - 5.4220 1800- 1814 Observed fs 0.1013 0.1276 0.1228 0.1073 0.0849 0.0429 - P/F 0.9997 1.0245 1.0243 0.9662 0.9094 0.7898 - Adj. fs 0.1013 0.1307 0.1246 0.1037 0.0772 0.0339 - 2.8570 SR=1.06, fd 0.0956 0.1233 0.1175 0.0978 0.0728 0.0320 - 2.6950 Both sexes 0.1969 0.2540 0.2421 0.2015 0.1500 0.0659 - 5.5520 1815- 1829 Observed fs 0.0716 0.1199 0.1180 0.1042 0.0839 0.0230 0.0031 P/F 1.0000 1.2338 1.0882 0.9633 0.9444 0.9625 0.9124 Adj. fs 0.0716 0.1479 0.1284 0.1004 0.0792 0.0221 0.0030 2.7630 SR=1.06, fd 0.0675 0.1395 0.1211 0.0947 0.0747 0.0208 0.0028 2.6055 Both sexes 0.1391 0.2874 0.2495 0.1951 0.1539 0.0429 0.0058 5.3685 1830- 1844 Observed fs 0.9333 0.1340 0.1205 0.1271 0.0859 0.0608 - P/F 0.9996 1.0043 0.8809 0.8214 0.7515 0.7004 - Adj. fs 0.0933 0.1346 0.1061 0.1044 0,0646 0.0426 - 2.7280 SR=1.06, fd 0.0880 0.1270 0.1001 0.0985 0.0609 0.0402 - 2.5735 Both sexes 0.1813 0.2616 0.2061 0.2029 0.1255 0.0828 - 5.3015
24
Table 10: Male Age-Specific Fertility Rates for Sons and
Gross Reproductive Rate (GRR) by Cohort, Shen and Hsü Clans, 1680-1829 Shen
Cohort Measure Age GRR
15-19 20-24 25-29 30-34 35-39 40-44 45-49 50-54 55-59 1680- 1694 Obs. fs .0086 .0483 .0787 .1086 .0844 .0775 .0403 .0177 .0183 P/F - 1.788 1.396 1.267 1.131 1.075 1.017 .988 .972 Adj. fs .0086 .0863 .1098 .1376 .0954 .0834 .0410 .0175 .0178 2.9870 1695- 1709 Obs. fs .0201 .0977 .1038 .1240 .0754 .0654 .0102 - - P/F - 1.023 1.255 1.176 1.100 1.047 .994 - - Adj. fs .0201 .0999 .1303 .1458 .0830 .0685 .0101 - - .27885 1710- 1724 Obs. fs .0098 .0406 .0819 .0993 .0991 .0639 .0388 .0251 .0203 P/F - 1.617 1.417 1.250 1.157 1.068 1.015 .985 .961 Adj. fs .0098 .0657 .1161 .1241 .1146 .0682 .0394 .0247 .0194 2.9100 1725- 1739 Obs. fs .0048 .0380 .0859 .0980 .1095 .0734 .0492 .0395 .0139 P/F - 2.009 1.417 1.260 1.168 1.065 1.012 .978 .951 Adj. fs .0048 .0763 .1217 .1235 .1279 .0782 .0498 .0386 .0132 3.1700 1740- 1754 Obs. fs .0063 .0467 .0632 .0971 .0912 .0651 .0415 .0458 .0181 P/F - 1.962 1.360 1.271 1.152 1.068 .960 .913 .882 Adj. fs .0063 .0916 .0847 .1234 .1051 .0695 .0398 .0418 .0160 2.8910 1755- 1769 Obs. fs .0065 .0545 .0681 .0953 .1039 .0778 .0559 .0357 .0199 P/F - 1.592 1.285 1.202 1.115 1.030 .975 .936 .918 Adj. fs .0065 .0864 .0875 .1146 .1158 .0801 .0545 .0334 .0183 2.9875 1770- 1784 Obs. fs .0083 .0464 .0865 .0899 .1042 .0908 .0788 .0320 .0247 P/F - 1.595 1.373 1.190 1.110 1.024 .948 .888 .867 Adj. fs .0083 .0740 .1188 .1070 .1157 .0930 ..0747 .0248 .0214 3.1885 1785- 1799 Obs. fs .0090 .0402 .0847 .1101 .1047 .0874 .0632 .0223 .0135 P/F - 1.630 1.421 1.240 1.111 1.003 .926 .875 .857 Adj. fs .0090 .0655 .1204 .1365 .1163 .0877 .0585 .0195 .0116 3.1250 1800- 1814 Obs. fs .0119 .0525 .1114 .1174 .1047 .0618 .0298 .0231 .0099 P/F - 1.653 1.411 1.184 1.047 .957 .681 .885 .867 Adj. fs .0119 .0868 .1572 .1390 .1096 .0591 .0203 .0204 .0086 3.0645 1815 1829 Obs. fs .0175 .0545 .0765 .1060 .0882 .0631 .0580 .0255 .0113 P/F - 1.593 1.346 1.215 1.080 .988 .895 .876 .852 Adj. fs .0175 .0868 .1030 .1288 .0953 .0623 .0519 .0223 .0096 2.8875
25 Table 10 (Continued)
Hsü
Cohort Measure Age GRR
15-19 20-24 25-29 30-34 35-39 40-44 45-49 50-54 55-59 1680- 1694 Obs. fs .0188 .0465 .0633 .0680 .0773 .0694 .0526 .0252 .0350 P/F - 1.413 1.252 1.165 1.120 1.061 1.006 .961 .949 Adj. fs .0188 .0657 .0793 .0792 .0866 .0736 .0529 .0242 .0332 2.5675 1695- 1709 Obs. fs .0067 .0475 .0647 .0902 .1287 .0763 ..0736 .0335 .0052 P/F - 1.605 1.302 1.213 1.177 1.065 1.014 .961 .943 Adj. fs .0067 .0762 .0842 .1084 .1515 .0812 .0746 .0309 .0049 3.0980 1710- 1724 Obs. fs .0149 .0556 .0796 .0686 .1095 .0633 .0372 .0117 .0172 P/F - 1.734 1.426 1.253 1.232 1.113 1.062 1.028 1.018 Adj. fs .0149 .0964 .1135 .0860 .1349 .0705 .0395 .0210 .0175 2.9260 1725- 1739 Obs. fs .0044 .0269 .0534 .0736 .0889 .0769 .0413 .0248 .0145 P/F - 1.828 1.615 1.480 1.383 1,301 1,208 1.165 1.138 Adj. fs .0044 .0492 .0862 .1089 .1234 .1000 .0499 .0289 .1615 2.8370 1740- 1754 Obs. fs .0050 .0242 .0415 .0926 .0918 .0851 .0415 .0304 .0090 P/F - 1.803 1.549 1.503 1.291 1.187 1.095 1.060 1.030 Adj. fs .0050 .0436 .0643 .1392 .1185 .1010 .0454 .0322 .0093 2.7925 1755- 1769 Obs. fs - .0239 .0674 .0924 .0859 .0620 .0512 .0368 .0050 P/F - 2.158 1.790 1.541 1.383 1.273 1.211 1.156 1.118 Adj. fs - .0516 .1206 .1424 .1188 .0789 .0620 .0425 .0056 3.1120 1770- 1784 Obs. fs .0040 .0420 .0774 .0883 .0837 .0450 .0401 .0228 .0103 P/F - 2.297 1.830 1.582 1.442 1.321 1.271 1.219 1.184 Adj. fs .0040 .0965 .1416 .1397 .1207 .0594 .0510 .0278 .0122 3.2645 1785- 1799 Obs. fs .0141 .0415 .0651 .0945 .0733 .0632 .0347 .0365 .0058 P/F - 2.026 1.661 1.486 1.308 1.208 1.125 1.094 1.041 Adj. fs .0141 .0841 .1081 .1404 .0959 .0764 .0391 .0399 .0060 3.0200 1800- 1814 Obs. fs .0120 .0396 .0628 .1027 .1017 .0767 .0524 .0194 .0055 P/F - 1.837 1.556 1.362 1.175 1.044 .956 .902 .886 Adj. fs .0120 .0727 .0977 .1399 .1195 1.801 .0501 .0175 .0049 2.9720 1815 1829 Obs. fs .0122 .0523 .0800 .1091 .0839 .0788 .0354 .0275 .0105 P/F - 1.904 1.528 1.257 1.049 .918 .837 .802 .779 Adj. fs .0122 .0996 .1222 .1371 .0880 .0723 .0296 .0221 .0082 2.9565
26
Table 11: Male Age-Specific Fertility Rates for Sons and
Gross Reproductive Rate (GRR) by Period, Shen and Hsü Clans, 1725-1844
Cohort Measure Age GRR 15-19 20-24 25-29 30-34 35-39 40-44 45-49 50-54 55-59 Shen 1725- 1739 Obs. fs .0098 .0603 .0844 .1240 .0598 .0739 .0657 .0335 .0265 P/F - 1.747 1.569 1.521 1.219 1.073 .969 .933 .864 Adj. fs .0098 .1053 .1324 .1886 .0729 .0793 .0636 .0313 .0229 3.5305 1740- 1754 Obs. fs .0048 .0390 .0909 .0993 .0968 .0759 .0102 .0106 .0183 P/F - 1.440 1.545 1.234 1.190 1.229 1.186 1.140 1.054 Adj. fs .0048 .0561 .1404 .1226 .1152 .0933 .0121 .0121 .0193 2.8795 1755- 1769 Obs. fs .0063 .0426 .0733 .0980 .1104 .0582 .0388 .0201 .0035 P/F - 1.657 1.306 1.306 1.133 1.112 1.034 .997 1.089 Adj. fs .0063 .0706 .0957 .1280 .1250 .0647 .0401 .0200 .0038 2.7710 1770- 1784 Obs. fs .0065 .0549 .0669 .0971 .1025 .0792 .0495 .0296 .0243 P/F - 1.850 1.266 1.182 1.151 1.060 1.018 .940 .942 Adj. fs .0065 .1016 .0847 .1148 .1180 .0840 .0504 .0278 .0229 3.0535 1785- 1799 Obs. fs .0083 .0478 .0788 .0953 .0955 .0602 .0415 .0501 .0101 P/F - 1.558 1.317 1.166 1.094 .971 .971 1.013 1.000 Adj. fs .0083 .0745 .1038 .1111 .1044 .0584 .0403 .0508 .0101 2.8085 1800- 1814 Obs. fs .0090 .0478 .0826 .0899 .1096 .0972 .0559 .0270 .0218 P/F - 1.633 1.435 1.201 1.129 1.028 .913 .846 .776 Adj. fs .0090 .0781 .1185 .1080 .1238 .0999 .0510 .0228 .0169 3.1400 1815- 1829 Obs. fs .0352 .0432 .0858 .1101 .0968 .0794 .0788 .0414 .0213 P/F - 1.014 1.066 1.077 1.020 .958 .902 .855 .846 Adj. fs .0352 .0438 .0915 .1185 .0987 .0761 .0711 .0354 .0180 2.9415 1830- 1844 Obs. fs .0175 .0564 .1047 .1174 .1227 .0838 .0632 .0231 .0196 P/F - 1.560 1.402 1.171 .955 .840 .812 .801 .786 Adj. fs .0175 .0880 .1468 .1375 .1172 .0704 .0513 .0185 .0154 3.3130 Hsü 1725- 1739 Obs. fs .0177 .0614 .0773 .0902 .1151 .0298 .0526 .0091 - P/F - 1.472 1.168 .998 1.034 .804 .891 .949 .965 Adj. fs .0177 .0904 .0903 .0901 .1190 .0239 .0469 .0086 - 2.4345 1740- 1754 Obs. fs .0044 .0413 .0670 .0686 .1091 .0910 .0730 .0413 .0470 P/F - 2.040 1.814 1.558 1.365 1.223 1.093 .941 .795 Adj. fs .0044 .0843 .1216 .1069 .1489 .1113 .0798 .0388 .0374 3.6670 1755- 1769 Obs. fs .0050 .0265 .0519 .0736 .0990 .0694 .0372 .0128 .0224 P/F - 1.767 1.509 1.495 1.504 1.480 1.264 1.249 1.283 Adj. fs .0050 .0468 .0783 .1101 .1489 .1027 .0470 .0160 .0287 2.9175 1770- 1784 Obs. fs - .0169 .0480 .0926 .0770 .0763 .0413 .0228 .0040 P/F - 2.270 2.031 1.576 1.309 1.231 1.256 1.198 1.298 Adj. fs - .0384 .0975 .1459 .1008 .0939 .0519 .0273 .0052 2.8045 1785- 1799 Obs. fs .0040 .0369 .0701 .0924 .0883 .0748 .0415 .0248 .0139 P/F - 2.178 1.488 1.358 1.192 1.107 1.021 1.007 .955 Adj. fs .0040 .0804 .1043 .1255 .1053 .0828 .0424 .0250 .0133 2.9150 1800- 1814 Obs. fs .0141 .0495 .0786 .0883 .0846 .0588 .0512 .0481 .0057 P/F - 1.766 1.636 1.429 1.312 1.137 1.040 .994 .939 Adj. fs .0141 .0874 .1286 .1262 .1110 .0668 .1533 .0478 .0054 3.2030 1815- 1829 Obs. fs .0120 .0283 .0544 .0945 .0827 .0454 .0401 .0210 .0074 P/F - 2.115 1.294 1.741 1.528 1.432 1.357 1.310 1.240 Adj. fs .0120 .0599 .0704 .1645 .1264 .0650 .0544 .0275 .0092 2.9465 1830- 1844 Obs. fs .0122 .0554 .0739 .1027 .0927 .0686 .0347 .0296 .0103 P/F - 1.907 1.428 1.180 1.039 1.014 .983 1.012 1.001 Adj. fs .0122 .1057 .1055 .1431 .0964 .0696 .0341 .0299 .0103 3.0340
27
One conclusion to be drawn from Tables 8-11 is that the fertility of the Shen and Hsü clans was quite similar and conformed closely to the age pattern found in human populations in general. Not only does this give us confidence in our sources, but our estimate of marital fertility is remarkably close to that obtained by the Princeton group. Like the wives of the Chinese farmers included in Buck’s surveys, the women taken as first wives by the Shen and Hsü clans bore an average of five children.19 Taken together with the stability displayed by both male and female fertility rates, this finding argues that Chinese reproductive behavior did not change markedly until the introduction of family planning in the 1950’s. Considering the massive and often violent social changes that shook Chinese society in the eighteenth and nineteenth centuries, one expects to find sharp fluctuations in fertility. What one finds in fact is impressive continuity.
Mortality
As we have seen, patrilineal descent did not ensure a person a place in his or her father’s genealogy. Sons were certain of notice only if they survived to age 15, and daughters were normally excluded no matter how long they lived. Thus we have no choice but to base our estimates of male mortality on the experience of those men who survived to age 15, and our estimates of female mortality on the experience of the only women regularly noted in the genealogies, their wives.
To estimate mortality with these data I first organized my population into five-year birth cohorts and then assigned all deaths to one of 14 five-year age groups (15-19 to 80 and above). There were, of course, a number of persons whose exact age at death could not be determined. Under what I term the low-mortality condition, they were assigned to the age groups 60-64 and above, with the undated deaths distributed across the age classes in the same proportions as the dated deaths. Under the alternative high-mortality condition, the undated deaths were assigned to the age groups fewer than 60, and again the distribution of the undated deaths followed that of the dated deaths.20 Where the number of undated deaths is small, as it is for the
19
Barclay et al., p. 614, Table 5.
20
For a description of the method see Louis Henry, Manuel de demographie historique (Genève-Paris, 1970), pp. 113-115; E. A. Wrigley, “Mortality in Pre-Industrial England: The Example of Colyton, Devon, Over Three Centuries,” Daedalus (Spring 1968), pp. 553-555.
The result obtained for the Shen wives born in the years 1760-64 are given in the accompanying table. Age Known Unknown Low High Age Known Unknown Low High
15-19 0 1 0 1 50-54 7 - 7 10 20-24 3 0 3 3 55-59 2 - 2 3 25-29 3 3 3 4 60-64 10 - 12 10 30-34 4 3 4 5 65-69 12 - 15 12 35-39 4 1 4 5 70-74 13 - 16 13 40-44 3 2 3 4 75-79 3 - 4 3 45-49 3 - 3 4 80+ 6 - 7 6
28
cohorts born before 1760, I have based my final calculations on dated death only. Where the number of undated deaths is larger, I have taken the average of the values obtained under the high and low mortality conditions. This has the effect of modifying an otherwise unbelievably sharp increase in mortality in the late eighteenth and early nineteenth centuries.
Having assigned all the people in my sample to birth cohorts and their deaths to age groups, I then proceeded to construct life tables for the males and females in each of the clans. The actual numbers employed in calculating the qx (probability of dying)
values of the Shen males are given in Table 12 by way of illustration.21
Table 12: Observed Number of Deaths in the Shen Clan by Age and Cohort
The figures shown in each parallelogram are the number of persons surviving to that age and the number of deaths occurring during the age interval. Though life tables based on qx values of each cohort might have revealed interesting temporal trends, I
21