269
*To whom correspondence and reprint requests should be addressed. Tel: 886-2-23637753. Fax: 886-2-23661197.
E-mail: sheanya@ntu.edu.tw
S
wordfish, Xiphias gladius (Linnaeus, 1758), is one of the most widely distributed species of oceanic fish biota, mainly due to its high tolerance of a range of seawater temperatures of from 6 to 26°
C (Carey and Robison 1981). Swordfish are commonly found not only in tropical and temperate zones of the Indian, Atlantic, and Pacific Oceans, but are also quite abundant in the Mediterranean Sea, the Sea of Marmara, the Black Sea, and the Sea of Azov (FAO 1994). It is known that swordfish resources have become one of the important economic elements for thosefish-ers capable of accessing them. Nevertheless, it was not until the early 1990s, when catches of swordfish in the Indian Ocean began to notably increase, when Taiwanese longliners became one of the major fleets capable of utilizing Indian Ocean swordfish resources. Stock identification is one of the major tasks which need to be accom-plished if an assessment of swordfish fishery resources is to be successful. As one of the major fleets fishing Indian swordfish, research efforts were devoted to in situ collection of swordfish meat samples by the Taiwanese fleet in
1999-Population Genetic Structure of the Swordfish, Xiphias gladius
(Linnaeus, 1758), in the Indian Ocean and West Pacific Inferred from the
Complete DNA Sequence of the Mitochondrial Control Region
Ching-Ping Lu1, Chaolun Allen Chen1,2, Cho-Fat Hui3, Tzong-Der Tzeng4,and Shean-Ya Yeh1,*
1Institute of Oceanography, National Taiwan University, Taipei, Taiwan 106, R.O.C. 2Research Center for Biodiversity, Academia Sinica, Nankang, Taipei, Taiwan 115, R.O.C.
3Institute of Cellular and Organismic Biology, Academia Sinica, Nankang, Taipei, Taiwan 115, R.O.C. 4College of Liberal Education, Shu-Te University, Yen-Chiao, Kaohsiung, Taiwan 824, R.O.C.
(Accepted November 16, 2005)
Ching-Ping Lu, Chaolun Allen Chen, Cho-Fat Hui, Tzong-Der Tzeng, and Shean-Ya Yeh (2006) Population genetic structure of the swordfish, Xiphias gladius (Linnaeus, 1758), in the Indian Ocean and West Pacific inferred from the complete DNA sequence of the mitochondrial control region. Zoological Studies 45(2): 269-279. The population genetic structure of the swordfish, Xiphias gladius, was studied using tissue samples col-lected from the Indian Ocean and West Pacific between 1999 and 2003 by Taiwanese longliners. In total, 175 individuals comprising 9 sampled units (2 units from the Pacific Ocean and 7 from the Indian Ocean) were sur-veyed using the complete DNA sequence of the mitochondrial control region (841 bp in length), which yielded a total of 142 haplotypes with a mean haplotypic diversity (h) of 0.9967 and nucleotide diversity of (π) of 0.01476 ± 0.00046. Significant population subdivisions detected by F-statistics (Fst) and analysis of molecular variance (AMOVA) indicated that samples drawn from the waters off northern Madagascar and the Bay of Bengal were 2 distinct groups compared to the other populations from the Indian Ocean and West Pacific. In concordance with previous studies indicating the worldwide swordfish population,s genetic structure, our study further sug-gests that the stock structure of swordfish in the Indo-Pacific region can be summarized into the following groups: an area off northern Madagascar, the Bay of Bengal, and the rest of the Indian Ocean and western Pacific, thus providing important information for management units of swordfish fisheries in the Indo-Pacific region. http://zoolstud.sinica.edu.tw/Journals/45.2/269.pdf
Key words: Swordfish, Population genetic structure, Mitochondrial control region, Fishery management, Indian Ocean.
2003 to meet the aforementioned needs.
Mitochondrial DNA (mtDNA) data have been used to infer the swordfish population structure by quantifying the degree of genetic relatedness among geographic populations (Alvarado Bremer et al. 1996, Chow et al. 1997, Chow and Takeyama 2000, Reeb et al. 2000). Alvarado Bremer et al. (1996) examined 247 individuals col-lected from the Pacific, Atlantic, and Mediter-ranean using the 330 base pairs (bp) of the hyper-variable left domain of the mtDNA control region. Results indicated that haplotypic frequencies in the samples significantly differed among populations of the Pacific, North Atlantic, South Atlantic, and Mediterranean Sea. Restriction fragment length polymorphism (RFLP) analysis performed on the polymerase chain reaction (PCR)-amplified mtDNA control region in 456 individuals comprising 13 samples from the Pacific, Atlantic, and Indian Oceans, and the Mediterranean Sea indicated that the worldwide swordfish population is genetically structured not only among but also within ocean basins (Chow et al. 1997). In addition to the mtDNA information, (Chow and Takeyama 2000) added the nuclear locus, calmodulin gene intron 4 (CaM), and concluded that at least 4 breeding units, the Mediterranean, northwestern Atlantic, tropical to South Atlantic, and Indo-Pacific, could be identified. The structure and migration corri-dors of the Pacific populations were identified by
the left and right hypervariable domains of the mtDNA control region (Reeb et al. 2000).
In this study, we collected samples from 175
X. gladius individuals from 7 sample units of the
Indian Ocean and 2 of the Pacific. The complete DNA sequence of the mtDNA control region was determined and genetic variations within and among these samples, the global population struc-ture, and gene flow are discussed for the sword-fish.
MATERIALS AND METHODS Sampling
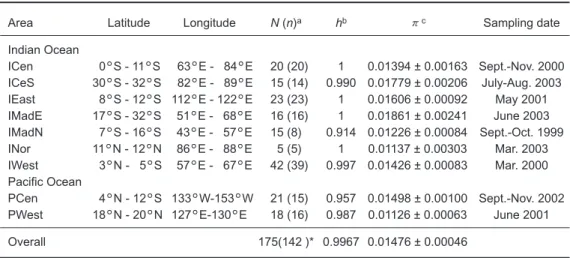
A survey of in situ collections of swordfish tis-sue samples was carried out from 1999 to 2003 by the Taiwanese fisheries research sector for collect-ing on-board swordfish tissue samples from Taiwanese longliners fishing in the Indian and Pacific Oceans. In total, 175 in situ swordfish tis-sue samples were collected (Table 1), which belonged to 9 assigned fishing operations, and these were successfully sampled and delivered to our laboratory. All on-board swordfish samples were immediately preserved in 95% ethanol by the fishing masters for further analysis. These 175 swordfish tissue samples were categorized based on their area-time attributes into 9 independent
Table 1. Detailed information of independent swordfish meat samples collected in
this study
Area Latitude Longitude N (n)a hb πc Sampling date
Indian Ocean ICen 0
°
S - 11°
S 63°
E - 84°
E 20 (20) 1 0.01394 ± 0.00163 Sept.-Nov. 2000 ICeS 30°
S - 32°
S 82°
E - 89°
E 15 (14) 0.990 0.01779 ± 0.00206 July-Aug. 2003 IEast 8°
S - 12°
S 112°
E - 122°
E 23 (23) 1 0.01606 ± 0.00092 May 2001 IMadE 17°
S - 32°
S 51°
E - 68°
E 16 (16) 1 0.01861 ± 0.00241 June 2003 IMadN 7°
S - 16°
S 43°
E - 57°
E 15 (8) 0.914 0.01226 ± 0.00084 Sept.-Oct. 1999 INor 11°
N - 12°
N 86°
E - 88°
E 5 (5) 1 0.01137 ± 0.00303 Mar. 2003 IWest 3°
N - 5°
S 57°
E - 67°
E 42 (39) 0.997 0.01426 ± 0.00083 Mar. 2000 Pacific Ocean PCen 4°
N - 12°
S 13 3°
W-153°
W 21 (15) 0.957 0.01498 ± 0.00100 Sept.-Nov. 2002 PWest 18°
N - 20°
N 127°
E-130°
E 18 (16) 0.987 0.01126 ± 0.00063June 2001 Overall 175(142 )* 0.9967 0.01476 ± 0.00046* These swordfish meat samples were kindly collected by Taiwanese longliners of Ming-Jie No.1, Tai-Yuan
No. 212, Yu-Sheng No. 1, Jin-Hung No. 116, and Hai-Tsuen No. 1.
aN is the sample size of the unit, and (n) is the number of haplotypes of the unit. bh is haplotype diversity. cπis nucleotide diversity with the standard deviation.
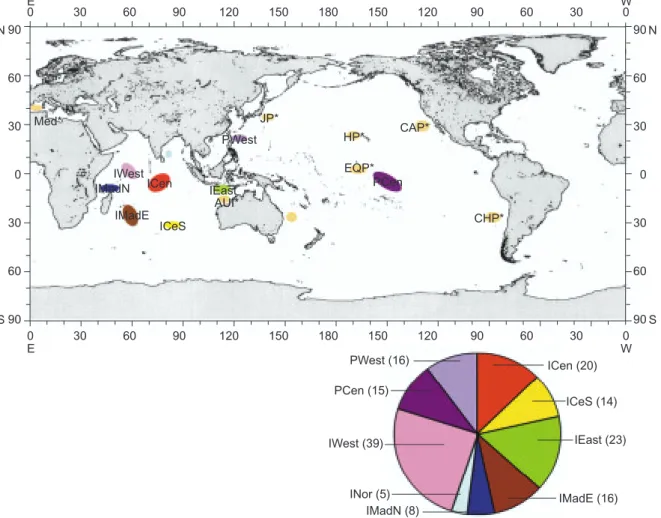
sampling units (Fig. 1). Seven units were collected from the Indian Ocean and 2 from the Pacific Ocean, including the central Indian (ICen), centro-southern Indian (ICeS), eastern Indian (IEast), northern Indian (INor), western Indian (IWest), waters off eastern Madagascar (IMadE), waters off northern Madagascar (IMadN), central Pacific (PCen), and western Pacific (PWest).
Laboratory protocols DNA extraction
Isolation of DNA was performed by a stan-dard phenol/chloroform procedure (Kocher et al. 1989). About 100 mg of meat tissue was digested in 900 µl of extraction buffer (10 mg/ml DTT, 2 mM EDTA, 10 mM Tris-HCl; pH 8.0), 50 µl proteinase
K (10 mg/ml), and 50 µl 20% SDS. The tissue was incubated overnight at 55
°
C, with gentle rotation inside a hybridization oven. It was then extracted once with an equal volume of saturated phenol, once with 1 ml phenol/chloroform/isoamyl alcohol (25: 24: 1) and once with 1 ml chloroform/isoamyl alcohol (24: 1), followed by ethanol precipitation. The extracted DNA was then suspended in 50-100 µl of sterile water.PCR amplification and DNA sequencing
Two specific primers, modified from (1) the light-strand primer, SP (5'-TAC CCC AAA CTC CCA AAG C-3'), complementary to tRNApro
(Alvarado Bremer et al. 1995) and (2) the heavy-strand primer, S12S (5'-CAG AAG GCT AGG ACC AAA C-3'), complementary to 12S rRNA (Kocher
Fig. 1. Geographic distribution of sampling units of swordfish collected in this study. ICen, central Indian Ocean; ICeS, south-central Indian Ocean; IEast, eastern Indian Ocean; IMadE, waters east of Madagascar; IMadN, waters north of Madagascar; INor, northern Indian Ocean; IWest, western Indian Ocean; PCen, central Pacific Ocean; PWest, western Pacific Ocean. (n) is the number of haplo-types of the unit. AUI*, eastern Australia; AUP*, western Australia; CAP*, southern California and Mexico; CHP*, Chile; EQP*, central equatorial Pacific Ocean; HP*, Hawaii; JP*, Japan; Med*, Mediterranean. * Sequence data from Reeb et al. (2000).
90 60 30 0 30 60 90 150 120 90 60 30 0 150 120 90 60 E IMadN IMadE IWest ICeS AUI* ICen IEast PWest JP* Med* HP* EQP* PCen CAP* CHP* PWest (16) PCen (15) IWest (39) IMadN (8) ICen (20) ICeS (14) IEast (23) IMadE (16) INor (5) N S 90 60 30 0 30 60 90 N S W 30 0 180 150 120 90 60 30 0 150 120 90 60 E W 30 0 180
et al. 1989), were developed and used in this study. Amplifications of the control region of mtDNA were performed in a final volume of 50 µl. The following ingredients were sequentially added: 200 µM dNTPs, 0.5 units of Super Taq DNA poly-merase, 5 µl of 10X buffer (50 mM KCl, 10 mM Tris-HCl (pH 8.3), 1.5 mM MgCl2, and 0.1% gelatin), 1 µl of the extracted DNA, and 0.5 µM of the aforementioned primers. The PCR program was set as (1) denaturing for 5 min at 94
°
C; (2) followed by 35 cycles of denaturing at 94°
C for 1 min, annealing at 52°
C for 70 s, and an extension at 72°
C for 80 s; with (3) a final extension at 72°
C for 10 min. The amplification procedure was performed in a Thermal Cycler System 9600 (Perkin Elmer). PCR products were purified using a QIA quick gel extraction kit (Qiagen). The sequencing reactions of the PCR products were analyzed using an Applied Biosystems Prism 377 automated sequencer. Sequences obtained from this study were deposited in GenBank under the accession numbers DQ076502-DQ076643.Data analysis
The DNA sequences were aligned with the sequence AH008720: Xiphias gladius (Reeb et al. 2000) using the program PILEUP in SeqWeb vers. 2.1 of the GCG Wisconsin Package (Accelrys), fol-lowed by manual editing using GeneDoc 2.6 (Nicholas et al. 1997).
Genetic diversity analyses
The characters of haplotype diversity (h) (Nei 1987), nucleotide diversity (π) (Nei 1987), and
FST (Hudson et al. 1992) were calculated in order to perform the genetic differentiation analysis (DnaSP vers. 4.0; Rozas et al. 2003). Phylogenetic analyses of variations in mtDNA con-trol region sequences among the swordfish sam-ples were carried out using the UPGMA tree-build-ing algorithm with Kimura,s 2-parameter (Kimura 1980) distance using MEGA (Molecular
Evolutionary Genetic Analysis, vers. 2.1; Kumar et al. 2001). The minimum spanning tree (Excoffier 1993) of haplotypes was drawn by hand based on the output using Arlequin 2.0 (Schneider et al. 2000). Average sequence divergences between populations were computed, and the resultant divergence matrix thus obtained was used, based mainly on the UPGMA algorithm, to create a clus-tering tree of populations. The multiple tests of significant were corrected by the sequential Bonferroni test (Holm 1979). The probable geo-graphic population units were then determined by the results of the molecular variance analyses.
Population genetic structure
Genetic differentiation between populations was estimated based on the results obtained by analysis of molecular variance (AMOVA, Excoffier et al. 1992). Various groupings of these popula-tions were suggested by (1) analysis of the DNA sequence, (2) population trees, and (3) geographic distribution. The grouping that revealed the maxi-mal value of ΦCTand significantly differed from a
random organization of similar groupings was assumed to represent the most-probable geo-graphic subdivisions (Stanley et al.1996).
RESULTS
Molecular characteristics of the control region
The target segment subjected to PCR using SP and S12S primers contained 969 bp, which included a portion of tRNApro, the control region or
D-loop, a segment of tRNAphe, and a portion of
12S rRNA. The control region of 841 bp in length was used for the following analyses. The nucleotide composition of the swordfish control region was slightly AT-rich (63.3%). In total, 133 polymorphic sites, including 33 singletons and 100 parsimoniously informative sites, were detected. It was also noted that 68% of the total polymorphic
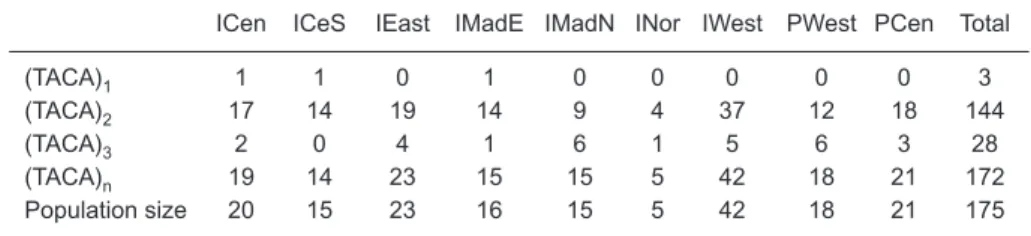
Table 2. Frequency distribution of the 3 types of TACA repeats in this study
ICen ICeS IEast IMadE IMadN INor IWest PWest PCen Total
(TACA)1 1 1 0 1 0 0 0 0 0 3
(TACA)2 17 14 19 14 9 4 37 12 18 144
(TACA)3 2 0 4 1 6 1 5 6 3 28
(TACA)n 19 14 2315 15 5 42 18 21 172
sites appeared in a 1-300 bp sequence of the 5'-strand.
Two or 3 contiguous 5'-TACA-3' repeat sequences were found at the 5'-end of the control region, which were also found in swordfish popula-tions of the Atlantic Ocean and Mediterranean Sea (Alvarado Bremer et al. 1995, Kotoulas et al.1995). In this study, only 3 samples from the Indian Ocean and none from the Pacific Ocean had one 5'-TACA-3' sequence, as shown in table 2. All of the remaining 172 swordfish specimens had 2 or three 5'-TACA-3' repeat sequences, including 28 individuals with three 5'-TACA-3'repeats and 144 individuals with two 5'-TACA-3' repeats (Table 2). The proportion of samples with 2 or 3 repeats was larger than that with only a single repeat in the Indian Ocean. One each of the 3 (TACA)1fish was from the ICen, the ICeS, and the IMadE sample units of the Indian Ocean. Previous studies (Alvarado Bremer et al. 1995, Rosel and Block
1996) also indicated that no (TACA)1 fish were dis-covered in the Pacific Ocean, and only a very few swordfish of (TACA) were also discovered off western Australian waters as reported by (Ward et al. 2001).
Among the 175 individual swordfish studied, 142 unique haplotypes were resolved. Notably, there were 29 unique haplotypes discovered among 39 individuals of swordfish collected from the Pacific Ocean and 118 unique haplotypes among 136 individuals from the Indian Ocean.
Estimation of the haplotype diversity index (h) for the 7 sampling units ranged from 0.914 (IMadN) to 1 (ICen, IEast, IMadE, and INor). The nucleotide diversity index (π) varied from 0.01126 (PWest) to 0.01861 (IMadE) among all sampling units. The π values of INor (0.01137), IMadN (0.01226), and PWest (0.01126) were smaller than those of the other units. It is evident that the IMadN sample appeared to have the lowest h
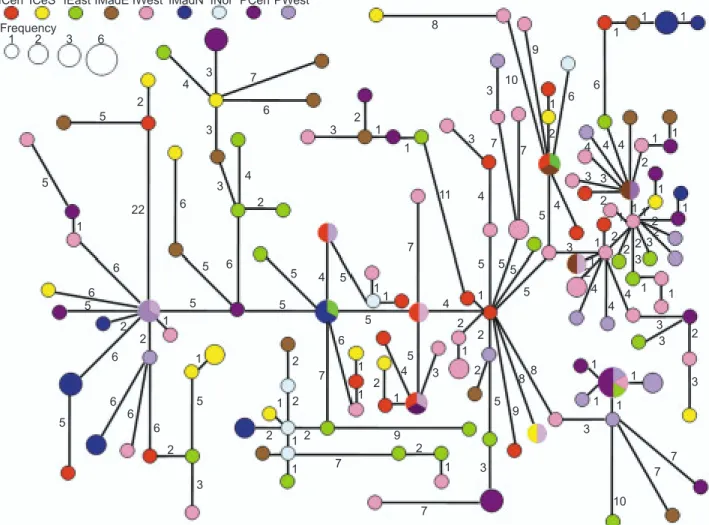
ICen Frequency
ICeS IEast IMadE IWest IMadN INor PCen PWest
Fig. 2. Haplotype network of swordfish in the Indian and Pacific Oceans. Different symbols represent different units. Details of the symbols are identified at the top of the figure. Small symbols indicate 1 individual, while large ones indicate more than 1 individual.
5 1 2 3 6 2 22 5 1 6 6 6 5 6 6 6 2 5 3 1 5 5 6 6 3 3 3 7 6 4 2 5 2 7 6 5 1 1 2 1 4 5 3 3 9 5 2 1 2 2 4 1 1 1 5 7 11 4 7 7 3 3 8 10 9 1 2 6 6 1 1 1 1 1 1 1 1 1 1 4 4 4 4 4 4 3 3 2 3 1 1 7 7 10 1 3 8 5 5 5 4 3 1 1 1 2 2 22 2 2 2 3 3 3 3 2 5 8 1 1 1 1 2 3 5 2 1 2 9 2 1 1 7 7 1 2 4 5 4 1 2 2 5
value and a lower π value. The minimum span-ning tree (MST) appeared star-like and showed no notable haplotype clustering between the Pacific and Indian Oceans (Fig. 2).
Population differentiation
The results of pairwise comparisons using FST indicated that whenever a combination included the IMadN and INor regions, it always showed a higher FST value, which ranged from 0.04910 to 0.14376 (Table 3). These results indicated that swordfish from the IMadN and INor regions greatly differed from those of the remaining locations. The comparison between INor and ICen revealed the highest FST value (0.14376). Pairwise compar-isons of the 7 regions showed that the differentia-tion was mostly due to the IMadN and INor regions, which were significantly differentiated from the remaining regions (Table 3).
The FSTvalue between PCen and PWest was 0.03940. Values derived from samples collected in the Pacific Ocean were comparatively small. No significant difference between PCen and PWest was indicated for these 2 sampling units collected from the Pacific Ocean. The results so far
obtained indicated that characters of IMadN and INor appeared to significantly differ from the rest of the sampling units. Further between-ocean analy-ses, which excluded IMadN and INor, using the
FST statistic were performed to better understand the tendencies between the Pacific and Indian Oceans. The results of these analyses are shown in table 4. The minimum value of FST (0.03153) was observed when the pooled Pacific sample (PCen and PWest) was compared against the pooled Indian sample, and the maximum value (0.17715) appeared when the pooled Pacific sam-ple was compared against INor. Higher FSTvalues were detected in comparisons including the IMadN and INor populations. The permutation test result of the between-ocean analyses showed signifi-cance between populations of pooled oceanic samples.
Results of the UPGMA tree (Fig. 3) imply that
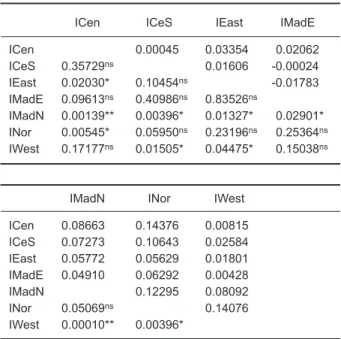
Table 3. Results of pairwise comparisons in terms
of FST among sampling units from the Indian Ocean
ICen ICeS IEast IMadE
ICen 0.00045 0.03354 0.02062 ICeS 0.35729ns 0.01606 -0.00024 IEast 0.02030* 0.10454ns -0.01783 IMadE 0.09613ns 0.40986ns 0.83526ns IMadN 0.00139** 0.00396* 0.01327* 0.02901* INor 0.00545* 0.05950ns 0.23196ns 0.25364ns IWest 0.17177ns 0.01505* 0.04475* 0.15038ns
IMadN INor IWest
ICen 0.086630.14376 0.00815 ICeS 0.072730.106430.02584 IEast 0.05772 0.05629 0.01801 IMadE 0.04910 0.06292 0.00428 IMadN 0.12295 0.08092 INor 0.05069ns 0.14076 IWest 0.00010** 0.00396*
FSTvalues are in the upper right diagonal; p values are in the lower left diagonal. * Significant at p < 0.05 by the permuta-tion test; ** Significant p values after Bonferroni correcpermuta-tion; ns, not significant.
Fig. 3. Results of the UPGMA tree derived from 9 sampling units (suggesting Gp1, 4, and 5 in table 5).
ICeS IMadE ICen IWest IEast PCen PWest IMadN INor 0.01 Gp1 Gp4 Gp5
Table 4. Results of pairwise comparisons in terms
of FST among groups in the Indian and Pacific Oceans
Pacific Indian IMadN INor
Pacific - 0.03153 0.10086 0.17715
Indian 0.00059** - 0.06651 0.10432
IMadN 0.00010** 0.00168** - 0.12295
INor 0.00485** 0.04257ns 0.05148ns
-FSTvalues are in the upper right diagonal; p values are in the lower left diagonal. *Significant at p < 0.05 by the permuta-tion test; **Significant p values after Bonferroni correcpermuta-tion; ns, not significant.
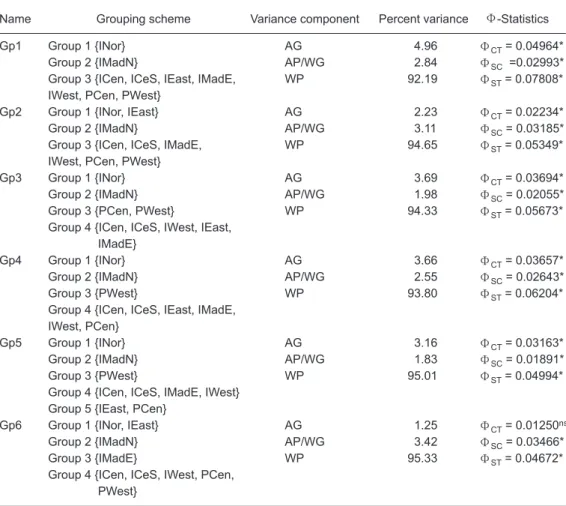
the IMadN and INor regions may have already sig-nificantly differentiated away from other regions. It was also suggested, based on the results of fur-ther clustering analyses and the character of the geographic locations, that 6 primary regional divi-sions of the original 9 sampling units could appro-priately be grouped for detailed AMOVA analyses. According to the among-group variance compo-nent test results, 5 grouping schemes (Gp1, Gp2, Gp3, Gp4, and Gp5 of Table 5) of all 6 designated grouping schemes were statistically significant. The Gp1 grouping scheme, comprised of 3 groups, consistently showed the highest value for the among-group variance components and was selected as the best grouping of all sampling units in the present study. The selection of the Gp1 grouping scheme as the best grouping scheme was based on the statistics of ΦCT values. The
obtained value of ΦCTof 0.04964 was the highest
appearing among all grouping schemes, as shown in table 5.
DISCUSSION
The swordfish population in the northern Madagascar (IMadN) sampling unit showed differ-ent characters from the others in terms of the hap-lotype diversity index (h). The h value of IMadN revealed the lowest level in this study. The unique characters of haplotype diversity in IMadN are interesting, and more information is needed to bet-ter understand this area. The IMadN and INor (the Bay of Bengal) sampling units differed from the rest of the samples from the Indian Ocean accord-ing to the FST statistics and AMOVA. The 2
sam-Table 5. AMOVA results for the Indian and Pacific Ocean groups of swordfish
Name Grouping scheme Variance component Percent variance Φ-Statistics
Gp1 Group 1 {INor} AG 4.96 ΦCT= 0.04964*
Group 2 {IMadN} AP/WG 2.84 ΦSC =0.02993*
Group 3 {ICen, ICeS, IEast, IMadE, WP 92.19 ΦST= 0.07808*
IWest, PCen, PWest}
Gp2 Group 1 {INor, IEast} AG 2.23 ΦCT= 0.02234*
Group 2 {IMadN} AP/WG 3.11 ΦSC= 0.03185*
Group 3 {ICen, ICeS, IMadE, WP 94.65 ΦST= 0.05349*
IWest, PCen, PWest}
Gp3Group 1 {INor} AG 3.69 ΦCT= 0.03694*
Group 2 {IMadN} AP/WG 1.98 ΦSC= 0.02055*
Group 3 {PCen, PWest} WP 94.33 ΦST= 0.05673*
Group 4 {ICen, ICeS, IWest, IEast, IMadE}
Gp4 Group 1 {INor} AG 3.66 ΦCT= 0.03657*
Group 2 {IMadN} AP/WG 2.55 ΦSC= 0.02643*
Group 3 {PWest} WP 93.80 ΦST= 0.06204*
Group 4 {ICen, ICeS, IEast, IMadE, IWest, PCen}
Gp5 Group 1 {INor} AG 3.16 ΦCT= 0.03163*
Group 2 {IMadN} AP/WG 1.83 ΦSC= 0.01891*
Group 3 {PWest} WP 95.01 ΦST= 0.04994*
Group 4 {ICen, ICeS, IMadE, IWest} Group 5 {IEast, PCen}
Gp6 Group 1 {INor, IEast} AG 1.25 ΦCT= 0.01250ns
Group 2 {IMadN} AP/WG 3.42 ΦSC= 0.03466*
Group 3 {IMadE} WP 95.33 ΦST= 0.04672*
Group 4 {ICen, ICeS, IWest, PCen, PWest}
AG is the among-group component of variance; AP/WG is the among-populations/within group component of variance, and WP is the within-population component of variance. *Significant at p < 0.05 by the permu-tation test; ns, not significant.
ple units of IMadN and INor drawn from northern Indian waters showed very high levels of FST when respectively compared to the pooled Indian and pooled Pacific samples. The lower values of FST obtained between the pooled Indian and pooled Pacific samples imply that gene exchange between central and southern Indian Ocean swordfish and the Pacific ones may exist. This might stem from the throughflow (Meyers et al.
1995) that connects the 2 oceans. This through-flow must apparently have been more extensive in ancient times when the India and Australian plates were further away from the Eurasian plate. The continued throughflow between the current west-ern Pacific Ocean and the current central and southern Indian Ocean perhaps explains the less-significant molecular genetic difference between these 2 oceans, once IMadN and INor were
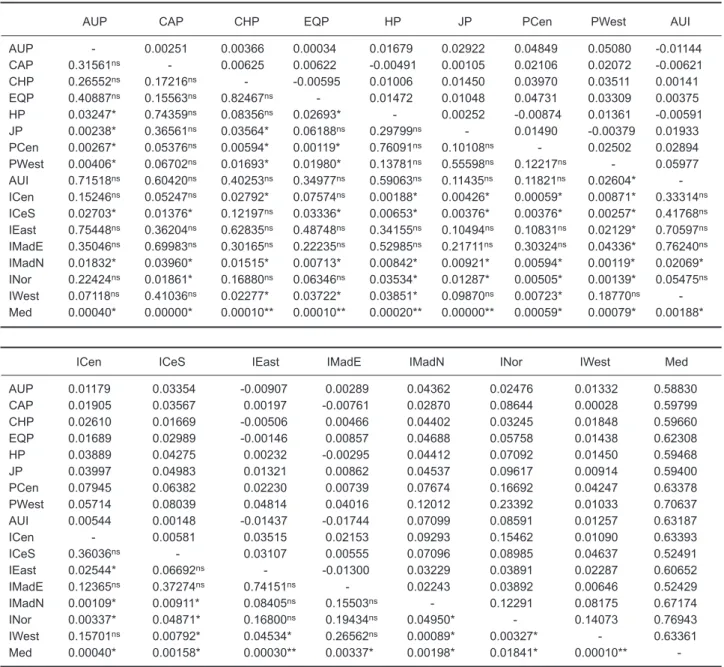
Table 6. Results of pairwise comparisons in terms of FSTamong sampling units from the Indian and Pacific Oceans
AUP CAP CHP EQP HP JP PCen PWest AUI
AUP - 0.00251 0.00366 0.00034 0.01679 0.02922 0.04849 0.05080 -0.01144 CAP 0.31561ns - 0.00625 0.00622 -0.00491 0.00105 0.02106 0.02072 -0.00621 CHP 0.26552ns 0.17216ns - -0.00595 0.01006 0.01450 0.03970 0.03511 0.00141 EQP 0.40887ns 0.15563ns 0.82467ns - 0.01472 0.01048 0.04731 0.03309 0.00375 HP 0.03247* 0.74359ns 0.08356ns 0.02693* - 0.00252 -0.00874 0.01361 -0.00591 JP 0.00238* 0.36561ns 0.03564* 0.06188ns 0.29799ns - 0.01490 -0.00379 0.01933 PCen 0.00267* 0.05376ns 0.00594* 0.00119* 0.76091ns 0.10108ns - 0.02502 0.02894 PWest 0.00406* 0.06702ns 0.01693* 0.01980* 0.13781ns 0.55598ns 0.12217ns - 0.05977 AUI 0.71518ns 0.60420ns 0.40253ns 0.34977ns 0.59063ns 0.11435ns 0.11821ns 0.02604* -ICen 0.15246ns 0.05247ns 0.02792* 0.07574ns 0.00188* 0.00426* 0.00059* 0.00871* 0.33314ns ICeS 0.02703* 0.01376* 0.12197ns 0.03336* 0.00653* 0.00376* 0.00376* 0.00257* 0.41768ns IEast 0.75448ns 0.36204ns 0.62835ns 0.48748ns 0.34155ns 0.10494ns 0.10831ns 0.02129* 0.70597ns IMadE 0.35046ns 0.69983ns 0.30165ns 0.22235ns 0.52985ns 0.21711ns 0.30324ns 0.04336* 0.76240ns IMadN 0.01832* 0.03960* 0.01515* 0.00713* 0.00842* 0.00921* 0.00594* 0.00119* 0.02069* INor 0.22424ns 0.01861* 0.16880ns 0.06346ns 0.03534* 0.01287* 0.00505* 0.00139* 0.05475ns IWest 0.07118ns 0.41036ns 0.02277* 0.03722* 0.03851* 0.09870ns 0.00723* 0.18770ns -Med 0.00040* 0.00000* 0.00010** 0.00010** 0.00020** 0.00000** 0.00059* 0.00079* 0.00188*
ICen ICeS IEast IMadE IMadN INor IWest Med
AUP 0.01179 0.03354 -0.00907 0.00289 0.04362 0.02476 0.01332 0.58830 CAP 0.01905 0.03567 0.00197 -0.00761 0.02870 0.08644 0.00028 0.59799 CHP 0.02610 0.01669 -0.00506 0.00466 0.04402 0.03245 0.01848 0.59660 EQP 0.01689 0.02989 -0.00146 0.00857 0.04688 0.05758 0.01438 0.62308 HP 0.03889 0.04275 0.00232 -0.00295 0.04412 0.07092 0.01450 0.59468 JP 0.03997 0.04983 0.01321 0.00862 0.04537 0.09617 0.00914 0.59400 PCen 0.07945 0.06382 0.02230 0.00739 0.07674 0.16692 0.04247 0.63378 PWest 0.05714 0.08039 0.04814 0.04016 0.12012 0.23392 0.01033 0.70637 AUI 0.00544 0.00148 -0.01437 -0.01744 0.07099 0.08591 0.01257 0.63187 ICen - 0.00581 0.03515 0.02153 0.09293 0.15462 0.01090 0.63393 ICeS 0.36036ns - 0.03107 0.00555 0.07096 0.08985 0.04637 0.52491 IEast 0.02544* 0.06692ns - -0.01300 0.03229 0.03891 0.02287 0.60652 IMadE 0.12365ns 0.37274ns 0.74151ns - 0.02243 0.03892 0.00646 0.52429 IMadN 0.00109* 0.00911* 0.08405ns 0.15503ns - 0.12291 0.08175 0.67174 INor 0.00337* 0.04871* 0.16800ns 0.19434ns 0.04950* - 0.14073 0.76943 IWest 0.15701ns 0.00792* 0.04534* 0.26562ns 0.00089* 0.00327* - 0.63361 Med 0.00040* 0.00158* 0.00030** 0.00337* 0.00198* 0.01841* 0.00010**
-FSTvalues are in the upper right diagonal; p values are in the lower left diagonal. *Significant at p < 0.05 by the permutation test; **Significant p values after Bonferroni correction; ns, not significant. Pacific Ocean populations: AUP, CAP, CHP, EQP, HP, JP (from Reeb et al. 2000), PCen, and PWest. Indian Ocean populations: AUI (from Reeb et al. 2000), ICeS, IEast, IMadE, IMadN, INor, ICen, and IWest. Mediterranean Sea population: Med (from Reeb et al. 2000).
excluded.
Nishikawa et al. (1985) indicated that a wide distribution of swordfish larvae was discovered in the western tropical Pacific, where archipelagos and islands are abundant, and they presumed that a major spawning ground for swordfish must exist here. If this spawning in the tropical archipelago region of an ocean is one of the reproductive traits in swordfish, then the current results of isolation off the northern Madagascar region and the Bay of Bengal differing from the rest of the Indian Ocean are not unreasonable.
As abundant and widely distributed in all oceans nowadays as swordfish are, they were very likely also to have been thriving in ancient times when Madagascar and India were 2 large land masses surrounded by oceans, both of which were then located near the equator. Plate tectonic movements of these 2 lands have resulted in the current Indian Ocean geography as well as its
spe-cific hydrographic characters. The water mass of the eastwardly flowing South Equatorial Current, which may well include throughflow from the west-ern Pacific, differs from that which originates from the Red Sea, which is high in salinity and nutrients and low in oxygen contents (Wyrtki 1971, DiMarco et al. 2002). The circulation of the water mass in the Bay of Bengal, in which the upper layer is less saline because that it receives a significant amount of fresh water from hinterland rivers and oceanic precipitation, seems to be a semi-enclosed and rather self-contained system driven by the season-ally reversing monsoons (Subramanian 1993). As a rational inference, the IMadN and INor areas appear to be ecologically specific in the Indian Ocean. It is thus not irrational to recognize, based on the D-loop sequence character analyses, the swordfish populations in the Indian and the west-ern Pacific region as 3 major groups of IMadN, INor, and the remaining Indian and Pacific Oceans.
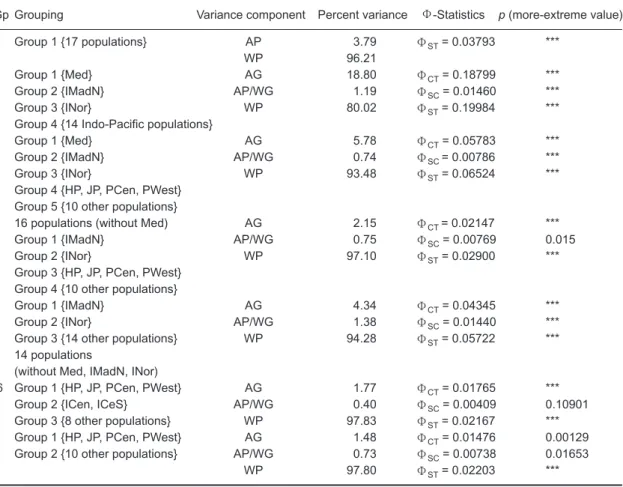
Table 7. AMOVA results for 17 populations in the Indian and Pacific Oceans
Gp Grouping Variance component Percent variance Φ-Statistics p (more-extreme value)
1 Group 1 {17 populations} AP 3.79 ΦST= 0.03793 ***
WP 96.21
2 Group 1 {Med} AG 18.80 ΦCT= 0.18799 ***
Group 2 {IMadN} AP/WG 1.19 ΦSC= 0.01460 ***
Group 3 {INor} WP 80.02 ΦST= 0.19984 ***
Group 4 {14 Indo-Pacific populations}
3Group 1 {Med} AG 5.78 ΦCT= 0.05783***
Group 2 {IMadN} AP/WG 0.74 ΦSC = 0.00786 ***
Group 3 {INor} WP 93.48 ΦST= 0.06524 ***
Group 4 {HP, JP, PCen, PWest} Group 5 {10 other populations}
4 16 populations (without Med) AG 2.15 ΦCT = 0.02147 ***
Group 1 {IMadN} AP/WG 0.75 ΦSC= 0.00769 0.015
Group 2 {INor} WP 97.10 ΦST= 0.02900 ***
Group 3 {HP, JP, PCen, PWest} Group 4 {10 other populations}
5 Group 1 {IMadN} AG 4.34 ΦCT= 0.04345 ***
Group 2 {INor} AP/WG 1.38 ΦSC= 0.01440 ***
Group 3 {14 other populations} WP 94.28 ΦST= 0.05722 ***
14 populations
(without Med, IMadN, INor)
6 Group 1 {HP, JP, PCen, PWest} AG 1.77 ΦCT= 0.01765 ***
Group 2 {ICen, ICeS} AP/WG 0.40 ΦSC= 0.00409 0.10901
Group 3 {8 other populations} WP 97.83 ΦST= 0.02167 ***
7 Group 1 {HP, JP, PCen, PWest} AG 1.48 ΦCT= 0.01476 0.00129
Group 2 {10 other populations} AP/WG 0.73 ΦSC= 0.00738 0.01653
WP 97.80 ΦST= 0.02203***
AG is the among-group component of variance; AP/WG is the among-populations/within-group
component of variance, and WP is the within-population component of variance. ***Significant at p < 0.001 by the per-mutation test; ns, not significant.
As we were concerned with the Indo-Pacific swordfish population structure, we combined the sequences from the research of Reeb et al. (2000) with those of this study. From their work, 284 swordfish were included with our research to increase the Pacific swordfish sample size. From the research on Pacific swordfish, we expected that the sequences would provide more informa-tion to understand the populainforma-tion structure. The Mediterranean samples of Reeb,s research were included in our study to provide contrast. The FST statistic and AMOVA test were carried out in this section. The FST statistic of the combined data of 17 populations in the Pacific and Indian Oceans, and Mediterranean Sea also revealed that the 3 populations IMadN, INor, and Med showed great differences with each other. Results of these analyses are shown in table 6. Comparisons of
FST of the other populations in the Indian and Pacific Oceans revealed no obvious differences among them. According to the FST statistic, this implies that the Med, IMadN, and INor regions may have already significantly differentiated away from other regions. It is also suggested, based on the characters of the geographic locations, that 7 pri-mary regional divisions of the 17 sampling units are appropriate for grouping the detailed AMOVA analytical results (Table 7). According to the among-group variance component test results, 6 grouping schemes (Gp1, Gp2, Gp3, Gp4, Gp5, and Gp6 of Table 7) of all designated 7 grouping schemes were statistically significant.
The Gp2 grouping scheme, which was com-prised of 4 groups, consistently showed the high-est values for the among-group variance compo-nents; thus it was selected as the best grouping of all sampling units. The selection of the Gp2 group-ing scheme as the best groupgroup-ing scheme was based on the statistics of the ΦCT value. The
obtained value of ΦCT of 0.18799 was the largest
value appearing in all grouping schemes, as shown in table 7. The 4 grouping schemes of Gp2, Gp3, Gp4, and Gp5 revealed the same trend that IMadN and INor differed from the others, and that the other populations in the Pacific and Indian Oceans revealed large-scale gene exchange. Although the population structure between the Pacific and Indian Oceans remains indistinct, we found consistent groupings of genetic differences for IMadN and INor in the Indian Ocean. The FST and AMOVA analyses of the 17 populations were based on both the 5'- and 3'-ends of the control region sequences. This suggests that complete control region sequences may provide more
infor-mation for analyzing the swordfish population structure.
Although much research effort was expended in collecting in situ swordfish samples from the Taiwanese longline vessels, the number of sam-ples collected for this study was still limited. In particular, swordfish samples from areas off north-ern Madagascar and the Bay of Bengal are still urgently needed to confirm the stock structures in those regions.
Acknowledgments: The authors are most grateful
for the financial support of this survey kindly pro-vided by the Fisheries Agency, Council of Agriculture, Executive Yuan, Taipei, through con-tract number (91-93)AS-(2.5.2/9.1.2)-FA-F1. We appreciate 2 anonymous reviewers for the revi-sion. Chaolun Allen Chen was supported by grants from the Academia Sinica Thematic Program (2002-2004) and Research Center for Biodiversity, Academia Sinica, Taipei, Taiwan.
REFERENCES
Alvarado-Bremer JR, AJ Baker, J Mejuto. 1995. Mitochondrial DNA control region sequences indicate extensive mixing of swordfish (Xiphias gladius) populations in the Atlantic Ocean. Can. J. Fish Aquat. Sci. 52: 1720-1732.
Alvarado-Bremer JR, J Mejuto, TW Greig, B Ely. 1996. Global population structure of the swordfish (Xiphias gladius L.) as revealed by analysis of the mitochondrial DNA control region. J. Exp. Mar. Biol. Ecol. 197: 295-310.
Carey FG, BJ Robison. 1981. Daily patterns in the activities of swordfish, Xiphias gladius, observed by acoustic teleme-try. Fish. Bull. US 79: 277-292.
Chow S, H Okamoto, Y Uozum, Y Takeuchi, H Takeyama. 1997. Genetic stock structure of the swordfish (Xiphias
gladius) inferred by PCR-RFLP analysis of the
mitochon-drial DNA control region. Mar. Biol. 127: 359-367. Chow S, H Takeyama. 2000. Nuclear and mitochondrial DNA
analyses reveal four genetically separated breeding units of the swordfish. J. Fish. Biol. 56: 1087-1098.
DiMarco SF, P Chapman, WD Nowlin, P Hacker, KA Donohue, M Luther, GC Johnson, JM Toole. 2002. Volume trans-port and property distributions of the Mozambique Channel. Deep-Sea Res. Pt. II 49: 1481-1511.
Excoffier L. 1993. MINSPNET: Minimum Spanning Network. Geneva: Department of Anthropology, Univ. of Geneva. Excoffier L, PE Smouse, JM Quattro. 1992. Analysis of
molec-ular variance inferred from metric distances among DNA haplotypes: application to human mitochondrial DNA restriction data. Genetics 131: 479-491.
FAO Fisheries Department. 1994. World review of highly migratory species and straddling stocks. FAO Fisheries Technical Pap. No. 337. Rome: FAO, 70 pp.
Holm S. 1979. A simple sequentially rejective multiple test procedure. Scand. J. Stat. 6: 65-70.
Hudson RR, M Slatkin, WP Maddison. 1992. Estimation of lev-els of gene flow from DNA sequence data. Genetics 132:
583-589.
Kimura M. 1980. A simple method for estimating evolutionary rates of base substitution through comparative studies of nucleotide sequences. J. Mol. Evol. 16: 111-120. Kocher TD, WK Thomas, A Meyer, SV Edwards, S Paabo, FX
Villablanca, AC Wilson. 1989. Dynamics of mitochondrial DNA evolution in animals: amplification and sequencing with conserved primes. Proc. Natl. Acad. Sci. USA 86: 6196-6200.
Kotoulas G, A Magoulas, N Tsimenides, E Zouros. 1995. Marked mitochondrial DNA differences between Mediterranean and Atlantic populations of the swordfish,
Xiphias gladius. Mol. Ecol. 4: 473-481.
Kumar S, K Tamura, IB Jakobsen, M Nei. 2001. MEGA2: Molecular Evolutionary Genetics Analysis software, Bioinformatics 12: 1244-1245.
Linnaeus C. 1758. Systema Naturae, ed. 10. Holmiae. Systema Nat. ed. 10 i-ii + 1-824.
Meyers G, R Bailey, A Worby. 1995. Geostrophic transport of Indonesian throughflow. Deep-Sea Res. 42: 1163-1174. Nei M. 1987. Molecular Evolutionary Genetics. New York:
Columbia Univ. Press.
Nicholas KB, HB Nicholas Jr, DW Deerfield II. 1997. GeneDoc: analysis and visualization of genetic variation, EMBNEW.NEWS 4: 14.
Nishikawa Y, M Honma, S Ueyanagi, S Kikawa. 1985. Average distribution of larvae of oceanic species of scom-broid fishes, 1956-1981. Shimizu, Japan: Far Seas Fisheries Research Laboratory.
Reeb CA, L Arcangeli, BA Block. 2000. Structure and migra-tion corridors in Pacific populamigra-tions of the swordfish (Xiphias gladius) as inferred through analyses of mito-chondrial DNA. Mar. Biol. 136: 1123-1131.
Rosel, PE, BA Block. 1996. Mitochondrial control region vari-ability and global population structure in the swordfish,
Xiphias gladius. Mar. Biol. 125: 11-22.
Rozas J, JC Sánchez-DelBarrio, X Messegyer, R Rozas. 2003. DnaSP, DNA polymorphism analyses by the coalescent and other methods. Bioinformatics 19: 2496-2497. Schneider S, D Roessli, L Excoffier. 2000. Arlequin Version
2.000: a software for population genetics data analysis. Geneva: Genetics and Biometry Laboratory, Univ. of Geneva.
Stanley HF, S Casey, JM Carnahan, S Goodman, J Harwood, K Wayne. 1996. Worldwide patterns of mitochondrial DNA differentiation in the harbor seal (Phoca vitulina). Mol. Biol. Evol. 13: 368-382.
Subramanian V. 1993. Sediment load of Indian rivers. Curr. Sci. 64: 928-930.
Ward RD, CA Reeb, BA Block. 2001. Population structure of Australian swordfish, Xiphias gladius. Final report to the Australian Fisheries Management Authority, Canberra, Australia.
Wyrtki K. 1971. Oceanographic atlas of the International Indian Ocean Expedition. Washington, DC: Super-intendent of Documents, US Government Printing Office, 531 pp.