Abstract
Based on the concept of shear-induced anisotropic degradation, a model involving time dependent behavior is proposed to simulate the deformational characteristics of weak sandstone. The stress-strain relationship of the proposed model was originated from the degradation of moduli K and G subjected to different loading conditions. An anisotropic factor β is introduced to indicate the tendency of shear-induced volumetric deformation. Furthermore, to incorporate time-dependent deformation behavior of sandstone, this anisotropic degradation model is further extended using a generalized Burger’s model. As a result, this proposed constitutive model is characterized by the following features: (1) being capable of describing shear-induced volumetric deformation, either compression or dilation, prior to the failure state; (2) being versatile in the time-dependent (creep) deformations (3) the anisotropic factor β serves as a convenient index regarding whether shear-induced volumetric deformation dilates or not; and (4) the number of material parameters is controlled to be as few as possible. The proposed model has been verified by comparing to experimental results. It is found that the proposed model is versatile in simulating short-term and long-term deformations of sandstone under different stress paths.
Keywords: weak sandstones, constitutive model, creep.
1 Introduction
In western part of Taiwan, weak sedimentary rocks (including sandstone, shale and mudstone) are often encountered during tunnel constructions, and these materials exhibit relatively low shear strength, enormous dilation, and significant creep deformation. In order to realize the deformation characteristics of weak sandstone, a series of laboratory tests including pure-shear triaxial tests and creep tests were
Paper 124
An Anisotropic Degradation Model for Weak Sandstone
considering Time Dependent Deformation
M.C. Weng1, F.S. Jeng2, C.Y. Liao3 and L.S. Tsai4 1Department of Civil and Environmental Engineering National University of Kaohsiung, Taiwan
2 Department of Civil Engineering
National Taiwan University, Taipei, Taiwan
3 Sinotech Engineering Consultants, Ltd., Taipei, Taiwan 4 China Engineering Consultants, Inc., Taipei, Taiwan
©Civil-Comp Press, 2010
Proceedings of the Seventh International Conference on Engineering Computational Technology, B.H.V. Topping, J.M. Adam, F.J. Pallarés, R. Bru and M.L. Romero, (Editors), Civil-Comp Press, Stirlingshire, Scotland
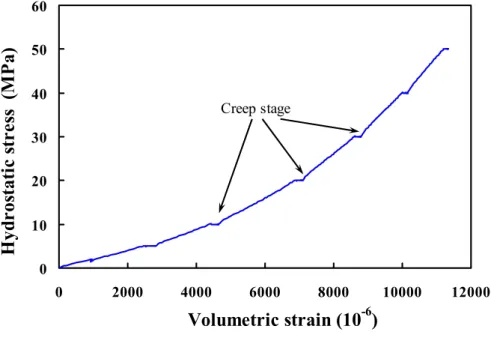
performed by Jeng et al. [1], Weng et al. [2] and Tsai et al. [3]. According to the results of these researches, weak rocks typically exhibit the following behaviors: (1) In the hydrostatic loading stage, the total strain possesses nonlinear behavior as
shown in Fig. 1a, which indicates that bulk modulus would increase as hydrostatic stress increases. Furthermore, an observation on the time-variations of creep deformation, shown in Fig. 1b, reveals that an increase of hydrostatic stress would suppress the amount of creep deformation.
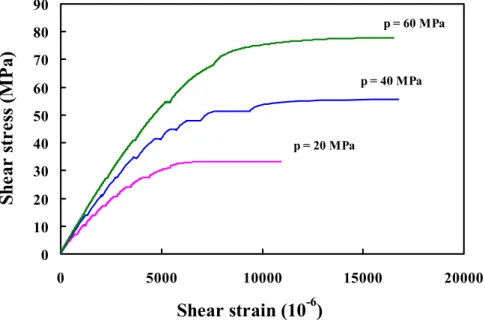
(2) In the shear loading stage, Fig. 2 depicts the variation of shear strain induced by shearing. It shows that the initial shear modulus increases with increasing hydrostatic pressure applied. Furthermore, it is seen that greater creep shear strains can be induced (Fig. 2b), especially when the loading is approaching shear strength.
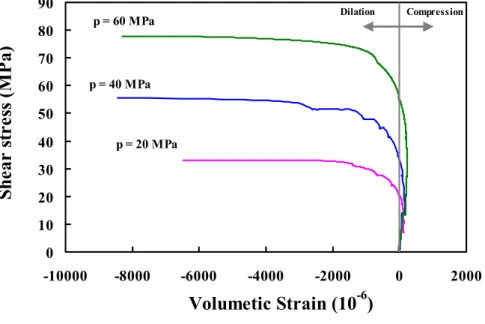
(3) Figure 3 illustrates the variation of the volumetric strain upon shear loading. The total volumetric strain induced by shear is initially contractive, and then gradually transits to be dilative upon increases of shear stresses as shown in Fig. 3a. For the creep component shown in Fig. 3b, it is also initially compressive and then dilative at later stages of loadings.
Since squeezing phenomenon in tunnel constructions is inherently related to the aforementioned shear-induced deformation and dilative creep, proper assessments for the rock mass prone to such behavior is of interest in engineering practice. Therefore, it is needed to develop a constitutive model that can properly describe these deformational characteristics.
Traditionally, constitutive models simulating the time-dependent behaviors of rock material are often based on viscoelastic concept [4-5] or elastic-viscoplastic concept [6-9]. In general, the more sophisticated deformation behavior to be simulated, the more complicated the models and the more material parameters are required as well. Therefore, a novel yet effective constitutive model, provided that it has as few material parameters as possible and the parameters can easily be obtained, is still desired since it can serve as a handy tool for a preliminary analysis before employing those sophisticated models. Therefore, a simple, time-dependent model for weak sandstones considering shear-induced anisotropic degradation is proposed in this study.
2 Model formulation
Incorporating the characteristics of instantaneous deformation of sandstone, especially for shear contraction/dilation, the compliance matrix in the principal stress coordinate is proposed accordingly based on Weng et al. [10] and Graham and Houlsby [11] as:
0 10 20 30 40 50 60 0 2000 4000 6000 8000 10000 12000 Volumetric strain (10-6) H yd ros tati c s tr es s (M P a) Creep stage
(a) Total volumetric strain
0 2000 4000 6000 8000 10000 12000 0 1 2 3 4 5 6 7 Time (hour) V olu m et ric s tra in εv ( 10 -6 ) Creep stage p = 5 MPa p = 10 MPa p = 20MPa p = 30 MPa p = 40 MPa p = 50 MPa
(b) Strain versus time under different loading stages
Figure 1 Typical deformation curves of volumetric strain induced by hydrostatic stress obtained from weak sandstones.
0 10 20 30 40 50 60 70 80 90 0 5000 10000 15000 20000 Shear strain (10-6) She ar st re ss ( M P a) p = 20 MPa p = 60 MPa p = 40 MPa
(a) Total shear strain
0 200 400 600 800 1000 1200 1400 0 5 10 15 20 25 30 Time (hour) Sh ea r creep s tra in ( 10 -6 ) ξ = 0.25 ξ = 0.86 ξ = 0.91 ξ = 0.76 ξ: Stress ratio
(b) Creep strain versus time under different shear stress ratio
0 10 20 30 40 50 60 70 80 90 -10000 -8000 -6000 -4000 -2000 0 2000 Volumetic Strain (10-6) She ar st re ss ( M P a) p = 60 MPa p = 20 MPa p = 40 MPa Dilation Compression
(a) Total shear strain
-1600 -1400 -1200 -1000 -800 -600 -400 -200 0 200 400 0 5 10 15 20 25 30 Time (hour) V olu m et ric creep s tra in ( 10 -6 ) Dilation Compression ξ = 0.25 ξ = 0.86 ξ = 0.91 ξ = 0.76 ξ: Stress ratio
(b) Creep strain versus time under different shear stress ratio
1 1 2 2 3 3 1 1 1 1 1 1 9 3 9 6 9 6 1 1 1 1 1 1 9 6 9 3 9 6 1 1 1 1 1 1 9 6 9 6 9 3 K G K G K G K G K G K G K G K G K G β β δε δσ δε δσ β β β δε δσ β β β ⎡ + − − ⎤ ⎢ ⎥ ⎢ ⎥ ⎡ ⎤ ⎡ ⎤ ⎢ ⎥ ⎢ ⎥= − + − ⎢ ⎥ ⎢ ⎥ ⎢ ⎥ ⎢ ⎥ ⎢ ⎥ ⎢ ⎥ ⎢ ⎥ ⎣ ⎦ ⎢ ⎥⎣ ⎦ − − + ⎢ ⎥ ⎣ ⎦ 2 2 2 2 (1)
where K and G are tangent bulk modulus and shear modulus; β is the anisotropic factor; δσ1, δσ2, and δσ3 are the major, intermediate and minor stress increments respectively along the three directions of the principal stresses; and δε1, δε2, and
3
δε are the corresponding principal strain increments.
When β equals to 1, Eq. 1 in fact is a constitutive relation of isotropic, linear elastic materials. However, sandstone under shearing, for instance, β can differ from 1 so that shear-induced volumetric deformation would happen.
Furthermore, based on Eq. 1, the volumetric strain increment δε , and the shear v
strain increment δγ can be expressed in terms of the deformation moduli and the applied stress increments as shown by Eqs. 2 and 3.
1 2 1 2 2 1 1 1 2 2 1 1 ( ) ( ) 3 3 9 9 9 9 9 9 v I I J K G G G G G G δε δ δ δ β β β β = + + − + − − (2) 2 2 2 4 1 1 1 2 ' ( ) 3 3 3 12 J J G G G δγ δ δ β β = = + + (3)
where δI1 is the increment of the first stress invariant; δJ2 and 2
'
J
δ are the increments of second deviatoric stress and strain invariants, respectively.
To incorporate the time-dependent deformation behavior of sandstone, the concept of constitutive model is extended based on a generalized Burger’s model. The generalized Burger’s model is based on rheology, and it consists of an elastic spring (Spring I), a dashpot (Dashpot II), and a group of an elastic spring (Spring II) and a dashpot (Dashpot I) connected in series, as shown in Fig. 4. Therefore, for the
Spring I, the initial strain at the time t = 0 can be obtained as Eq. 1. Furthermore,
considering the time-dependent behavior (Spring II, Dashpot I and Dashpot II), a similar compliance matrix is proposed as:
1 1 1 2 1 2 2 2 3 3 1 2 2 * * 1 1 1 1 1 1 1 3 6 6 9 9 9 3 ( ) 1 1 1 1 1 1 1 ( ) 9 9 9 3 6 3 6 ( ) 1 1 1 1 1 1 1 9 9 9 3 6 6 3 9 c 9 I G G G K K K t S t I S K K K G G G t S I K K K G G G p p K K δ β β δε δ δε δ δ β β β δε δ δ β β β ⎡ ⎤ ⎡ ⎤ ⎡ ⎤ − − ⎢ ⎥ ⎢ ⎥ ⎢ ⎥ ⎢ ⎥ ⎡ ⎤ ⎢ ⎥ ⎢ ⎥ ⎡ ⎤ ⎢ ⎥ ⎢ ⎥=⎢ ⎥ ⎢ ⎥+ − − ⎢ ⎥ ⎢ ⎥ ⎢ ⎥ ⎢ ⎥ ⎢ ⎥ ⎢ ⎥ ⎢ ⎥ ⎢ ⎥ ⎢ ⎥ ⎢ ⎥ ⎢ ⎥ ⎣ ⎦ ⎢ ⎥⎣ ⎦ ⎢ ⎥ ⎢ ⎥ − − ⎢ ⎥ ⎢ ⎥ ⎢ ⎥ ⎣ ⎦ ⎣ ⎦ ⎣ ⎦ + * * * * 1 1 * * * * * * 1 2 2 2 3 * * * * * * 1 2 2 1 9 3 3 6 6 1 9 9 9 3 6 3 6 1 3 9 9 9 6 6 3 c c c c c c c c c c c c c c c c c c c c c c c c c p q q q I K G G G S p p p q q q I S K K K G G G S p p p I q q q K K K G G G δ β β δ δ δ β β β δ δ β β β ⎡ ⎤⎡ ⎤ ⎡ ⎤ − − ⎢ ⎥⎢ ⎥ ⎢ ⎥ ⎢ ⎥⎢ ⎥ ⎢ ⎥ ⎡ ⎤ ⎢ ⎥⎢ ⎢ ⎥ ⎢ ⎥ ⎥ + − − ⎢ ⎥⎢ ⎥ ⎢ ⎥ ⎢ ⎥ ⎢ ⎥⎢ ⎥ ⎢ ⎥ ⎢ ⎥ ⎣ ⎦ ⎢ ⎥⎢ ⎥ ⎢ ⎥ ⎢ ⎥⎢ ⎥ ⎢− − ⎥ ⎣ ⎦ ⎢ ⎥ ⎢ ⎥ ⎣ ⎦ ⎣ ⎦ (5)
where δS1, δS2 , and δS3 are the deviatoric stress increments along the three directions of the principal stresses, respectively. Kc and Gc are bulk modulus and shear modulus for creep; βc is the anisotropic factor for creep; p* (1= −e−tKcηK)
and 1 2 * (1 G tc G c ) G G t q e η
η
− = − + .Experimental results of sandstone have indicated that the tendencies of instantaneous and creep deformation are similar. Hence, we may set Kc =m K,
c
G =n G and
β
c =β
for the sake of convenience, where m and n are the proportional factors. Equation 6 can be further simplified as:** ** ** ** ** ** 1 ** ** ** ** ** ** 1 2 2 2 2 3 ** ** ** ** ** ** 3 2 2 9 3 9 6 9 6 ( ) ( ) 9 6 9 3 9 6 ( ) 9 6 9 6 9 3 c c c c c c c c c c c c c c c c c c c p q p q p q K G K G K G t p q p q p q t K G K G K G t p q p q p q K G K G K G
β
β
δε
δσ
δε
δσ
β
β
β
δε
δσ
β
β
β
⎡ ⎤ + − − ⎢ ⎥ ⎢ ⎥ ⎡ ⎤ ⎢ ⎥⎡ ⎤ ⎢ ⎥=⎢ − + − ⎥⎢ ⎥ ⎢ ⎥ ⎢ ⎥⎢ ⎥ ⎢ ⎥ ⎢ ⎥ ⎣ ⎦ ⎢ ⎥⎣ ⎦ ⎢ − − + ⎥ ⎢ ⎥ ⎣ ⎦ (6) where p** (1= + −m e−tKcηK) and 1 2 ** (1 G tc G c ) G G t q n e ηη
− = + − + .Figure 4 Schematic illustration of the proposed model
3 The variations of modulus and anisotropic factor of
sandstones
The next step is to determine the function forms of K, G, Kc, Gc and β based on the behaviors of sandstone. The proposed model is designated to be simple both in parameter acquirement and in function forms, and it tries to simulate the major deformational behavior of sandstone. As a result, simplified function forms are proposed as follows.
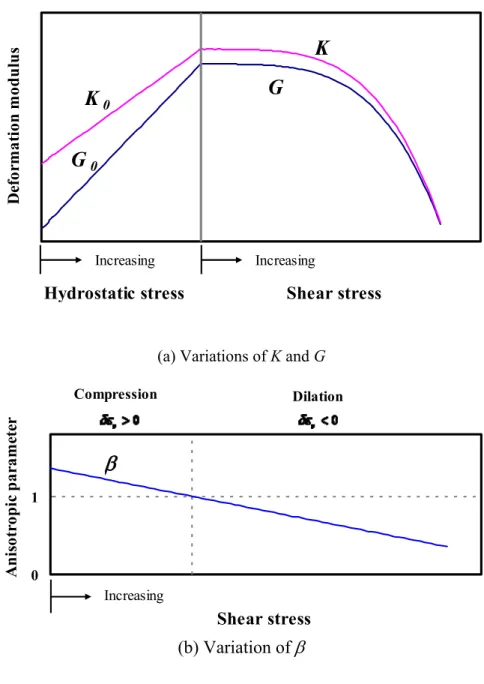
When sandstone is subjected to increasing hydrostatic loading, its stiffness may increase possibly owing to the closer packing of particles inside the material. Therefore, as shown in Fig. 5a, the initial shear modulus G is correspondingly set 0 to be linear with the variation of hydrostatic stress as:
0 1
1 3
G = ×a ⎛⎜ I ⎞⎟+b
⎝ ⎠ (7)
So is the initial bulk modulusK , and we have: 0
0 1
1 3
K = ×c ⎛⎜ I ⎞⎟+d
⎝ ⎠ (8)
where parameters a and c determine how rapid the increase of initial shear and bulk moduli with increasing confining pressure; b and d are the initial values of shear and
bulk moduli with no confining pressure. The greater the four values, the stiffer the shear and bulk moduli.
When the material is subjected to shear loading, the shear induces softening of all deformation moduli. Based on experimental results, the typical degradation of G corresponding to shear stress increasing is illustrated in Fig. 5a, in which Go is the
initial shear modulus. The degradation behavior is often nonlinear during the stages of shearing. As such, the shear modulus variation of G can be expressed in terms of
Go and stress levels, as shown in Eq. 9:
2 4 0 2, 1 ( ) f J G G J ⎛ ⎞ ⎜ ⎟ = − ⎜ ⎟ ⎝ ⎠ (9)
where J2,f is the shear strength, which has the form as: J2,f =α I1 +k. α, k are the material parameters. Similar relationships for soils have also been proposed [12-13].
The degradation of bulk modulus K can also take a similar function form as:
2 4 0 2, 1 ( ) f J K K J ⎛ ⎞ ⎜ ⎟ = − ⎜ ⎟ ⎝ ⎠ (10)
Accordingly, the shear modulus for creep Gc and bulk modulus for creep Kc can be expressed as: 2 4 1 2, 1 ( )(1 ( ) ) 3 c f J G nG n c I d J = = + − (11) 2 4 1 2, 1 ( )(1 ( ) ) 3 c f J K mK m a I b J = = + − (12)
Notably, the application of shear stress will induce anisotropic deformation and the factor β will no longer be 1. The variation of β under shearing is illustrated as Fig. 5b, and it can be described by Eq. 13 as:
2 0 2, c f J J
β
= =β β
− (13)G
0K
0K
G
Hydrostatic stress Shear stress
Increasing Increasing De fo rm at io n m od u lu s
(a) Variations of K and G
0 1
β
Increasing Compression Dilation A n is ot ro pi c pa ra me te r Shear stress (b) Variation of βFigure 5 Schematic illustration for the variations of K , G and β upon hydrostatic stress p and shear stress J . 2
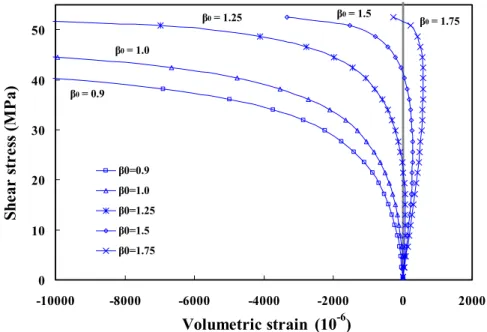
The parameter β0 reflects the initial degree of anisotropy. An increase of β0 increases the initial amount of shear-induced compression and the influence of parameter β0 on deformation is illustrated in Fig. 6. When β0 is greater than 1, the more β0 results in more initial contraction. When β0 is less than or equal to 1, monotonic shear dilation can be obtained.
0 10 20 30 40 50 -10000 -8000 -6000 -4000 -2000 0 2000 Volumetric strain (10-6) She ar st re ss ( M P a) β0=0.9 β0=1.0 β0=1.25 β0=1.5 β0=1.75 β0 = 1.75 β0 = 1.5 β0 = 1.25 β0 = 1.0 β0 = 0.9
Figure 6 Influences of parameter β0 on volumetric deformation induced by shearing.
4 Determination of material parameters
There are twelve material parameters (α , k, a, b, c, d,
β
0m, n, ηK,ηG1, and ηG2) to be determined from experimental results. The physical meaning of these parameters is quite straight-forward: Parameters α and k are parameters related to the shear strength of the material. Parameters a and b are parameters representing the variation of the initial shear modulus increasing with the applied hydrostatic stress. Similarly, parameters c and d represent how fast the initial bulk modulus would increase with the applied hydrostatic stress. Parameterβ
0 is the initial anisotropic parameter, which determines the initial volumetric deformation under shear loading (Fig. 6 and Eq. 13). Parameter m and n are proportional factors between the time-dependent moduli and the instantaneous moduli. The coefficients of viscosity, ηK and ηG1, control the retardation time during the primary creep deformation (DashpotI) under hydrostatic and shear stress, respectively. On the other hand, the coefficient
of viscosity ηG2 controls the creep rate during the secondary creep deformation under shear stress (Dashpot II). In general, these twelve material parameters can be obtained by the curve-fitting method using experimental results.
5 Short-term deformations – modeling under different
hydrostatic stresses
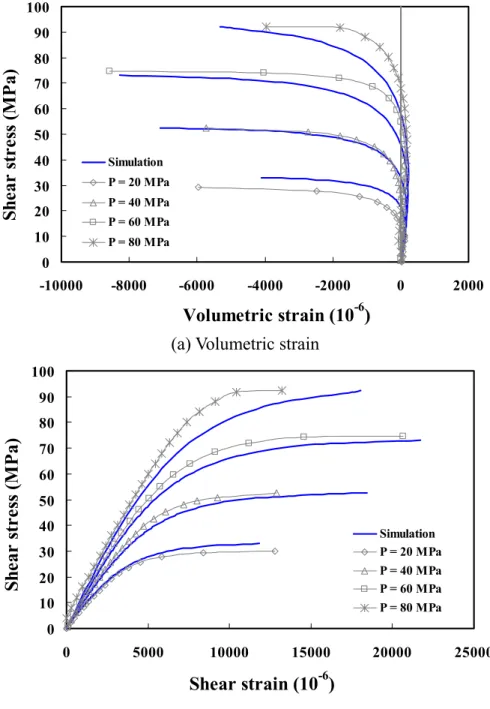
To understand the predictive capability of the proposed model in simulating short-term deformational behaviors under different hydrostatic stresses, the deformations under hydrostatic stress of 20 to 80 MPa, followed by pure-shear condition are simulated and compared. Using the aforementioned procedures, the corresponding material parameters are obtained from test under hydrostatic pressure of 40 MPa and are summarized in Table 1. The measured and the simulated stress-strain curves obtained from pure shear experiments are shown in Fig. 7.
At the shear loading stage, as shown in Fig. 7a, it is seen that the variations of measured volumetric strains under different hydrostatic pressures can be reasonably simulated by the proposed model. Furthermore, as shown in Fig. 7b, shear-induced shear deformations are also reasonably simulated by the proposed model. As a result, the proposed model is capable of modeling deformational behavior of sandstone under different stress conditions.
Model Parameters Value
The proposed model
α 0.375 k 9.9 MPa a 200 b 1500 MPa c 120 d 1400 MPa β0 1.38 m 6 n 11.5 K η 2.11 × 10⁷ MPa-sec 1 G η 8 × 10⁶ MPa-sec 2 G η 1.8 × 10⁹ MPa-sec
0 10 20 30 40 50 60 70 80 90 100 -10000 -8000 -6000 -4000 -2000 0 2000 Volumetric strain (10-6) Sh ea r s tres s ( MPa ) Simulation P = 20 MPa P = 40 MPa P = 60 MPa P = 80 MPa
(a) Volumetric strain
0 10 20 30 40 50 60 70 80 90 100 0 5000 10000 15000 20000 25000 Shear strain (10-6) Sh ea r st re ss ( M P a) Simulation P = 20 MPa P = 40 MPa P = 60 MPa P = 80 MPa (b) Shear strain
Figure 7 Simulation of shear and volumetric strains induced by shear stress under different hydrostatic pressures.
6 Long-term deformations – creep test simulations
A multi-stage, long-term creep experiment is further simulated. The experiment has two stages of sustained loadings: the hydrostatic compression stage and the shear loading stage. The required parameters are also listed in Table 1. The comparison
of the simulated results with the actual creep behavior of the studied sandstone is presented as follows:
(1) Hydrostatic compression stage
Figure 8a illustrates the simulated and the actual deformations at hydrostatic compression stage, induced by the multi-staged creep experiment. Compares with the actual deformation (Figure 1b), the actual volumetric behavior can be properly simulated by the proposed model
(2) Shear loading stage
As of the material behavior during shearing, Fig. 8b shows the predicted and the measured volumetric-strain versus time relationship. As seen in Fig. 8b, the simulated volume contracts under lower shear stress and transits to dilative behavior with increasing shear-stress ratio. Therefore, the material behaviors can be reasonably simulated by the proposed constitutive model. The performance of the proposed constitutive model can be further observed in Fig. 8c, which shows the shear strain versus time during the creep stage. It is seen that a greater shear stress ratio increases the magnitude of creep-induced shear strain. Although there is minor discrepancy of primary creep deformation between the simulation and the actual behavior, the simulated secondary creep deformation is consistent with the experiment results. Overall, the tendency of deformational behavior of sandstone has been captured by the proposed model.
0 2000 4000 6000 8000 10000 12000 0 1 2 3 4 5 6 7 Time (hour) V olu m et ric s tra in ( 10 -6 )
Measured creep def. model P = 5 MPa P =10 MPa P =20 MPa P =30 MPa P =40 MPa P =50 MPa creep stage
(a) Volumetric creep strains induced by hydrostatic stress Figure 8
-1400 -1200 -1000 -800 -600 -400 -200 0 200 0 5 10 15 20 25 30 Time (hour) V olu m et ric creep s tra in ( 10 -6 )
Measured creep def. Simulation
Dilation
Compression
(b) Volumetric creep strains induced by shear stress
0 500 1000 1500 2000 2500 0 5 10 15 20 25 30 Time (hour) Sh ea r creep s tra in ( 10 -6 )
Measured creep def. Simulation
(c) Shear creep strains induced by shear stress
Figure 8 Comparison of volumetric creep strains and shear creep strains predicted by the proposed model.
7 Conclusion
An anisotropic degradation model involving time dependent behavior is proposed to represent the key deformational characteristics of weak sandstone. The stress-strain relationship of the proposed model was originated from the degradation of moduli K and G subjected to different loading conditions, and an anisotropic factor β is introduced to reflect the tendency shear-induced volumetric deformation. Furthermore, to incorporate the time-dependent deformation behavior of sandstone, the anisotropic degradation model is extended based on a generalized Burger’s model. As a result, this proposed constitutive model is characterized by the following features: (1) being capable of describing shear-induced volumetric deformation, either compression or dilation, prior to the failure state; (2) being versatile in the time-dependent (creep) deformations; and (3) the anisotropic factor
β provides a clear index on whether shear-induced volumetric deformation dilate or not.
Acknowledgements
The research is partly supported by the National Science Council of Taiwan, Grant no. NSC-97-2221-E-390-019 and NSC-98-2221-E-390-028-MY2.
References
[1] F.S. Jeng, M.C. Weng, M.L. Lin, T.H. Huang, “Influence of Petrographic Parameters on Geotechnical Properties of Tertiary Sandstones from Taiwan”, Engineering Geology, 73, 71-91, 2004.
[2] M.C. Weng, F.S. Jeng, T.H. Huang, M.L. Lin, “Characterizing the Deformation Behavior of Tertiary Sandstones”, Int. J. Rock Mech. Min. Sci., 42, 388-401, 2005.
[3] L.S. Tsai, Y.M. Hsieh, M.C. Weng, T.H. Huang, F.S. Jeng, “Time-dependent deformation behaviors of weak sandstones”, Int. J. Rock Mech. Min. Sci., 45, 144-154, 2008.
[4] A. Afrouz, J.M. Harvey, “Rheology of rocks withinthe soft to medium strength range”, Int. J. Rock Mech. Min. Sci., 2, 281-290, 1974.
[5] R.E. Goodman, “Introduction to rock mechanics”, John Wiley & Sons, New York, 1989.
[6] N.D. Cristescu, “Rock Rheology. Kluwer Academic”, Dordrecht, 1989.
[7] N.D. Cristescu, G. Gioda, “Vsico-plastic behaviour of geomaterials”, Springer Verlag, New York, 1994.
[8] N.D. Cristescu, U. Hunsche, “Time effect in rock mechanics”, John Wiley & Sons, New York, 1998.
[9] E. Maranini, T. Yamaguchi, “A non-associated viscoplastic model for the behaviour of granite in triaxial compression”, Mechanics of Materials, 33, 283-293, 2001.
[10] M.C. Weng, F.S. Jeng, Y.M. Hsieh, T.H. Huang, “A simple model for stress-induced anisotropic softening of weak sandstones”, Int. J. Rock Mech. Min. Sci. 45, 155-166, 2008.
[11] J. Graham, G.T. Houlsby, “Anisotropic elasticity of a natural clay”, Geotechnique, 33, 165-180, 1983.
[12] D.C.F. LoPresti, O. Pallara, R. Lancellotta, M. Armandi, R. Maniscalco, “Monotonic and cyclic loading behavior of two sands at small strains”, ASTM Geotech. Test J., 16, 409-424, 1993.
[13] F. Tatsuoka, R.J. Jardine, D.C.F. LoPresti, H. DiBenedetto, T. Kodaka, “Characterizing the pre-failure deformation properties of geomaterials”, Proceedings, 14th Int. Conf. soil Mech. Found. Eng., 4, No. 35, 1997.